Seaborn: [Feature request] show rug below axis or on top to not hide crucial info
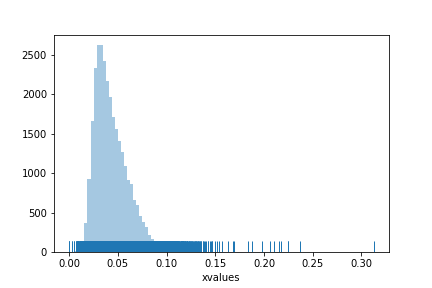
When rug=True is specified with distplot the dense placement of the rug lines can hide important info from the histogram or kde depending on the distribution of the data.
For such situations it would be extremely useful to place the rug either below the axis, or on top of the graph or otherwise in a way where it is added instead of overlaid over useful information.
In this example the rug hides the way how the distribution decreases towards close to zero density, but the rug also shows how the long tail is caused by just a few instances with extreme values. It would be very useful to show both, but with the rug not hiding the very important details:
 johann-petrak
All 2 comments
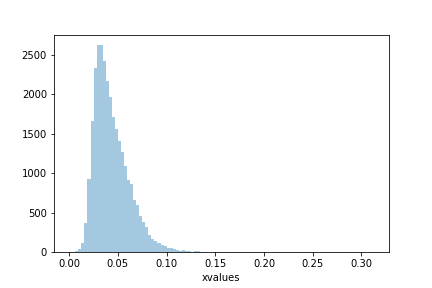
You can change the y axis limits to make this work.
 mwaskom
on 30 Oct 2019
mwaskom
on 30 Oct 2019
e.g.
x = np.random.gamma(4, 1, 1000)
ax = sns.distplot(x, kde=False, rug=True)
ax.set_ylim(-.06 * ax.get_ylim()[1])
👍3
Was this page helpful?
0 / 5 - 0 ratings
Related issues
 ConstantinoSchillebeeckx
·
4Comments
ConstantinoSchillebeeckx
·
4Comments
 phantom0301
·
3Comments
phantom0301
·
3Comments
 wenhaosun
·
3Comments
wenhaosun
·
3Comments
 bondarevts
·
3Comments
bondarevts
·
3Comments
 chanshing
·
3Comments
chanshing
·
3Comments
Most helpful comment
e.g.