Seaborn: Pandas datetime heatmap handling
I have an example which may illuminate easy handling of pandas datetimes for seaborn. I was about to post it to another issue but the issue was locked a few seconds before I hit post.
Actually it may be even easier than I thought:
I have a dataframe called thing representing a histogram in time.
I define the following methods:
def calc_freq(index):
return pd.Series(index[1:] - index[:-1]).mean()
def conv_index_to_bins(index):
assert index.is_monotonic
freq = calc_freq(index)
start = index.min()- freq/2
end = index.max()+ freq/2
N = len(index)+1
if isinstance(index, pd.DatetimeIndex):
return pd.date_range(start, end, N)
elif isinstance(index, pd.Float64Index):
return np.linspace(start, end, N)
else:
raise NotImplementedError('Not sure what to do with index type %s' % type(index))
def calc_df_mesh(df):
return np.meshgrid(conv_index_to_bins(df.index),
conv_index_to_bins(df.columns))
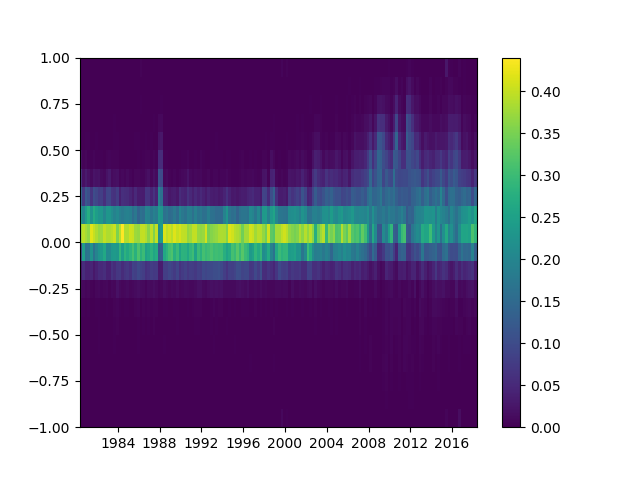
def heatmap(df):
X,Y = calc_df_mesh(df)
c = plt.pcolormesh(X, Y, df.values.T)
plt.colorbar(c)
call
heatmap(thing)
And I obtain
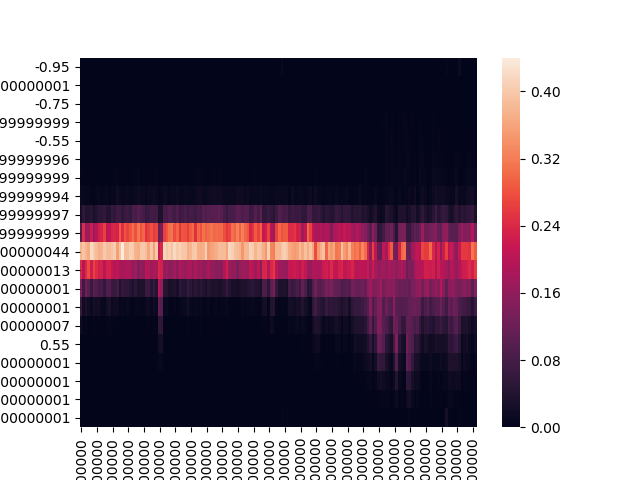
rather than with seaborn
 joseortiz3
All 2 comments
Yes, seaborn heatmap is for when the axes have categorical values, so it doesn't use matplotlib's numerical ticker algorithms. Using the existing matplotlib function for the task it is intended for is the right option.
 mwaskom
on 1 Jul 2019
mwaskom
on 1 Jul 2019
😕2
👎1
maybe it should be called categorical_heatmap instead
joseortiz3
on 1 Jul 2019
Was this page helpful?
0 / 5 - 0 ratings
Related issues
 sungshine
·
3Comments
sungshine
·
3Comments
 phantom0301
·
3Comments
phantom0301
·
3Comments
 bondarevts
·
3Comments
bondarevts
·
3Comments
 Bercio
·
3Comments
Bercio
·
3Comments
 songololo
·
4Comments
songololo
·
4Comments