Seaborn: Too many decimal places in legend labs for relplot with hue or size keywords
I ran into this problem with a particular dataset. Calling replot with either hue or size causes extremely long labels in the legend because of what looks like floating point arithmetic in the labeling logic.
Example:
test = pd.DataFrame({
 'foo' :[1,2,3,4,5,6,7],
 'bar' :[4,6,8,3,5,4,6],
    'baz':[0.4, 0.19, 0.35, 0.22, 0.35, 0.31, 0.09]
}
)
sns.relplot(
data=test.head(7),
x='foo',
y='bar',
size='baz')

Is there some way that the legend labels could be rounded or otherwise formatted to prevent this?
 mojones
All 5 comments
Glancing at other recent issues, I think this is related to https://github.com/mwaskom/seaborn/issues/1653
mojones
on 22 Mar 2019
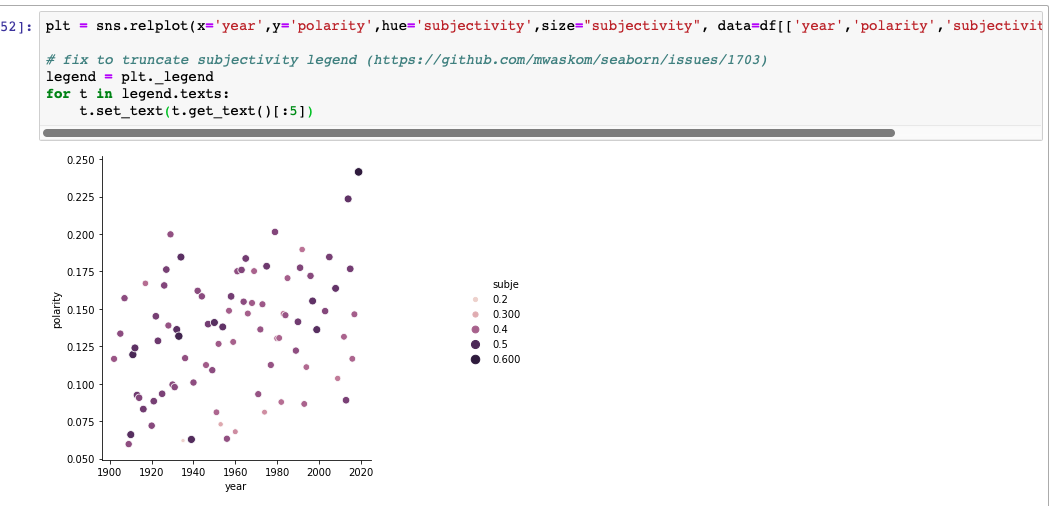
Workaround for anyone else who finds themselves looking at this:
plot =sns.relplot(
data=test.head(7),
x='foo',
y='bar',
size='baz')

leg = plot._legend
for t in leg.texts:
    # truncate label text to 4 characters
    t.set_text(t.get_text()[:4])
same problem found on scatterplot
`test = pd.DataFrame({
'foo': [1,1,1,1,1,
2,2,2,2,2,
3,3,3,3,3,],
'bar': ['A', 'B', 'C', 'D', 'E'] * 3,
'baz': [
1.113724, 1.684478, 1.258712, 1.093084, 2.043681,
1.373130, 1.486539, 1.325999, 1.428729, 1.688664,
1.325381, 1.345571, 1.304717, 1.366071, 1.454929]
})
ax = sns.scatterplot(
x='foo',
y='bar',
size='baz',
hue='baz',
palette="YlOrRd",
legend='brief',
data=test)
ax.legend(loc='lower left',
bbox_to_anchor=(1, 0),
ncol=1)`

python: 3.7.3
pandas: 0.25.3
matplotlib: 3.1.0
seaborn: 0.9.0
 wwang-chcn
on 17 Dec 2019
wwang-chcn
on 17 Dec 2019
Problem still exists. Issue with the truncation fix as above is it shifts the legend rightward
 asaji
on 20 Jan 2020
asaji
on 20 Jan 2020
The specific example at the beginning of this thread now produces the expected result, so if you are having a problem in some other context, you need to provide a reproducible example that demonstrates it.
 mwaskom
on 20 Jan 2020
mwaskom
on 20 Jan 2020
Related issues
 TDaltonC
·
3Comments
TDaltonC
·
3Comments
 amelio-vazquez-reina
·
3Comments
amelio-vazquez-reina
·
3Comments
 stonebig
·
4Comments
amelio-vazquez-reina
·
4Comments
stonebig
·
4Comments
amelio-vazquez-reina
·
4Comments
 sungshine
·
3Comments
sungshine
·
3Comments
Most helpful comment
Workaround for anyone else who finds themselves looking at this: