Seaborn: [Feature request] [boxplot] Option to have boxplot widths according to the number of observations
Hi,
What I would really like as a feature in Seaborn's boxplot function, is the option to set the boxplot's widths according to the size of the dataset visualized in each box. This can be done pretty easily in matplotlib.pyplot with the boxplot widths argument:
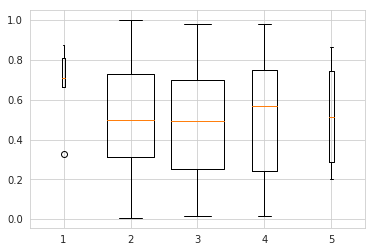
import numpy as np
import pandas as pd
import matplotlib.pyplot as plt
import seaborn as sns

# Create five datasets with different numbers of sample sizes
sample_sizes = [5, 84, 95, 45, 10]
data = [np.random.ranf(s) for s in sample_sizes]

# Define widths for boxplots as 0.8 of the normalized sample size
widths = [0.8 * s / max(sample_sizes) for s in sample_sizes]

plt.boxplot(data, widths=widths)
plt.show()
However, then I'm loosing the awesome data=..., x=…, y=…, hue=… functionality and the nice styling that Seaborn provides:
# Function to make flat list out of list of lists
flatten = lambda l: [item for sublist in l for item in sublist]

# Construct DataFrame for seaborn boxplot
data_df = pd.DataFrame([flatten([[s] * s for s in sample_sizes]), flatten(data)]).T
data_df.rename(columns={0: 'sample_size', 1: 'value'}, inplace=True)

sns.boxplot(data=data_df, x='sample_size', y='value', order=sample_sizes)
plt.show()
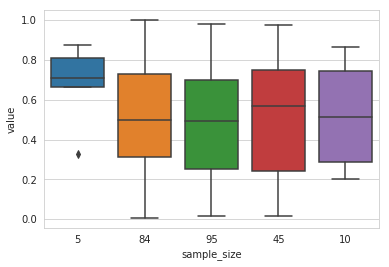
I have tried to pass widths as a keyword argument in sns.boxplot, but then an error is returned saying the argument widths received multiple values. So it would be really cool to be able to pass the widths argument to pyplot, or even cooler if there was an argument in sns.boxplot that automatically sets the widths according to the respective sizes if it is set to True.
Thanks a lot!
 RalfG
RalfG
>All comments
I arrived here looking for the same exact thing. Would be super useful!
 datachico
on 5 Feb 2020
datachico
on 5 Feb 2020
Related issues
 wenhaosun
·
3Comments
wenhaosun
·
3Comments
 amelio-vazquez-reina
·
3Comments
amelio-vazquez-reina
·
4Comments
amelio-vazquez-reina
·
3Comments
amelio-vazquez-reina
·
4Comments
 stonebig
·
4Comments
stonebig
·
4Comments
 bondarevts
·
3Comments
bondarevts
·
3Comments
Most helpful comment
I arrived here looking for the same exact thing. Would be super useful!