Seaborn: how can I use fit_kws in distplot?
hi!
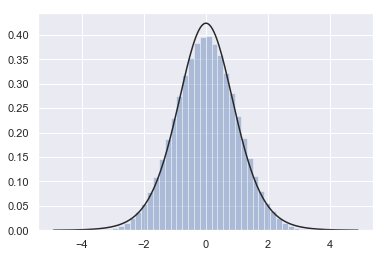
I wanna draw t-distribution with degree of freedom. I could find fit_kws option. I decided to use it.
here is my code.
x = np.random.standard_t(df = 10, size = 1000)
sns.distplot(x, kde = False, fit = stats.t, fit_kws = {"df": 10})
But I got this error message.
File "
sns.distplot(x, kde = False, fit = stats.t, fit_kws = {"df": 10})
File "C:Anaconda3libsite-packagesseaborndistributions.py", line 257, in distplot
ax.plot(x, y, color=fit_color, **fit_kws)
File "C:Anaconda3libsite-packagesmatplotlib__init__.py", line 1867, in inner
return func(ax, args, *kwargs)
File "C:Anaconda3libsite-packagesmatplotlibaxes_axes.py", line 1528, in plot
for line in self._get_lines(args, *kwargs):
File "C:Anaconda3libsite-packagesmatplotlibaxes_base.py", line 406, in _grab_next_args
for seg in self._plot_args(this, kwargs):
File "C:Anaconda3libsite-packagesmatplotlibaxes_base.py", line 396, in _plot_args
seg = func(x[:, j % ncx], y[:, j % ncy], kw, kwargs)
File "C:Anaconda3libsite-packagesmatplotlibaxes_base.py", line 300, in _makeline
seg = mlines.Line2D(x, y, **kw)
File "C:Anaconda3libsite-packagesmatplotliblines.py", line 421, in __init__
self.update(kwargs)
File "C:Anaconda3libsite-packagesmatplotlibartist.py", line 888, in update
for k, v in props.items()]
File "C:Anaconda3libsite-packagesmatplotlibartist.py", line 888, in
for k, v in props.items()]
File "C:Anaconda3libsite-packagesmatplotlibartist.py", line 881, in _update_property
raise AttributeError('Unknown property %s' % k)
AttributeError: Unknown property df
how can I do?
thanks for your help.
have a nice day.
 yoonespi
All 2 comments
fit_kws is just for specifying the appearance of the fitted line (line width, color, etc.), seaborn currently just calls the fit method with the given data (see here).
However, it is possible with scipy to set some of the distribution's parameters fixed while fitting (ref). Something like:
>>> from scipy import stats
>>> stats.t.fit([0, 1, 2], fix_df=2)
(2, 0.9999803125543874, 0.7071133099527851)
I'm not aware of a way to set this a priori (i.e. before calling fit), so I don't think this is currently possible with seaborn. Of course, a workaround would be to fit the distribution yourself and plot it using the Axes object returned by sns.displot. Something like this should work:
import seaborn as sns
from scipy import stats
import numpy as np
x = np.random.standard_t(df=10, size=1000)
params = stats.t.fit(x, fix_df=10)
xf = np.linspace(np.min(x), np.max(x), 100)
yf = stats.t.pdf(xf, *params)
ax = sns.distplot(x, kde=False, norm_hist=True)
ax.plot(xf, yf)
Note that seaborn does some smarter things when determining what xf should be above, but that should work ok for a smooth distribution like Student's t and a large sample size.
 ixjlyons
on 7 Jan 2019
ixjlyons
on 7 Jan 2019
Thanks @ixjlyons. Another trick would be to define your own fitting object. Easiest is to inherit from scipy directly:
class FixedT(stats.distributions.t_gen):
    df = 10
    def fit(self, *args, **kwargs):
        return stats.t.fit(*args, fix_df=self.df, **kwargs)

x = np.random.randn(1000000)
sns.distplot(x, kde=False, fit=FixedT())
 mwaskom
on 7 Jan 2019
mwaskom
on 7 Jan 2019
Related issues
 wenhaosun
·
3Comments
wenhaosun
·
3Comments
 TDaltonC
·
3Comments
TDaltonC
·
3Comments
 chanshing
·
3Comments
chanshing
·
3Comments
 songololo
·
4Comments
songololo
·
4Comments
 sofiatti
·
4Comments
sofiatti
·
4Comments
Most helpful comment
Thanks @ixjlyons. Another trick would be to define your own fitting object. Easiest is to inherit from scipy directly: