Seaborn: Is the `markers` parameter in scatterplot() not implemented?
Hello! I'm trying to create a scatter plot where the markers are different for each category (both the colour and the marker style). I can do this in lmplot(), for example:
iris = sns.load_dataset('iris')
sns.lmplot(data=iris, x='petal_length', y='petal_width', hue='species', markers=['o', '*', '+'], fit_reg=False)

But when I try the equivalent with the scatterplot() function, the markers are all the same style:
sns.scatterplot(data=iris, x='petal_length', y='petal_width', hue='species', markers=['o', '*', '+'])

I'm wondering if this markers parameter hasn't been implemented yet in scatterplot(), or if it requires a different syntax? I've tried various different approaches, but I can't seem to get the markers to be different styles for different categories.
Alternatively, is there some way that I can use lmplot() so that the scatter plot it creates can be created as a subplot within a figure with other subplots, that aren't part of a FacetGrid? This is straightforward with scatterplot() because I can provide the subplot axes as an input to the function, but I can't figure out how to do this with lmplot().
Any assistance would be greatly appreciated! Thank you!
 jenfly
All 14 comments
In scatterplot, you need to assign a variable to the style semantic. It can be the same variable you use for hue, but the assignment needs to be explicit.
 mwaskom
on 3 Nov 2018
mwaskom
on 3 Nov 2018
Hi @mwaskom, thank you for your help! I was playing around with the style parameter as well, and it worked for the iris dataset, which only has 3 categories, but not for the data I'm trying to plot, where I'd like to use different markers for 11 different weather stations, as in the figure below (created with lmplot()):
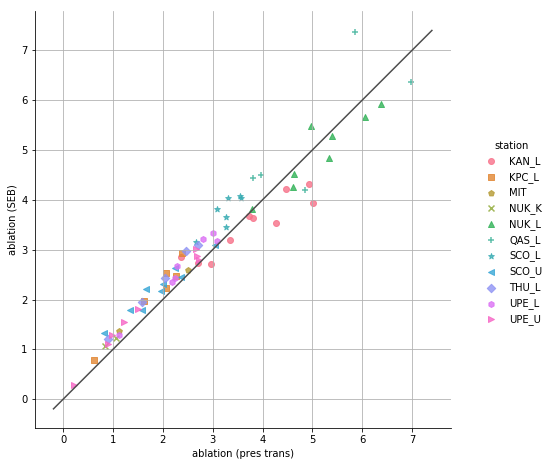
However, lmplot() is awkward because I can't find any way of incorporating this scatter plot within a figure that has other subplots (is there any way to do that?)
When I try using the style parameter to scatterplot(), I get the following error message, which seems to indicate that the style parameter only works for a maximum of 8 categories. Is there any way to get it to work for more categories, specifying a list of marker styles to use? I also tried using setting the style argument to the 'station' column of my data, and specifying a list of markers with the markers argument, but that threw an error as well.
ValueError                                Traceback (most recent call last)
<ipython-input-30-2937793495d5> in <module>()
      1 fig, (ax1, ax2) = plt.subplots(1, 2, figsize=(16, 8))
      2 sns.scatterplot(data=ab_total, x='ablation (pres trans)', y='ablation (SEB)',
----> 3                 hue='station', style='station', ax=ax1)
      4 ax1.set_aspect('equal')
      5

~\Anaconda3\envs\greenland3\lib\site-packages\seaborn\relational.py in scatterplot(x, y, hue, style, size, data, palette, hue_order, hue_norm, sizes, size_order, size_norm, markers, style_order, x_bins, y_bins, units, estimator, ci, n_boot, alpha, x_jitter, y_jitter, legend, ax, **kwargs)
   1333         x_bins=x_bins, y_bins=y_bins,
   1334         estimator=estimator, ci=ci, n_boot=n_boot,
-> 1335         alpha=alpha, x_jitter=x_jitter, y_jitter=y_jitter, legend=legend,
   1336     )
   1337

~\Anaconda3\envs\greenland3\lib\site-packages\seaborn\relational.py in __init__(self, x, y, hue, size, style, data, palette, hue_order, hue_norm, sizes, size_order, size_norm, dashes, markers, style_order, x_bins, y_bins, units, estimator, ci, n_boot, alpha, x_jitter, y_jitter, legend)
    859         self.parse_hue(plot_data["hue"], palette, hue_order, hue_norm)
    860         self.parse_size(plot_data["size"], sizes, size_order, size_norm)
--> 861         self.parse_style(plot_data["style"], markers, None, style_order)
    862         self.units = units
    863

~\Anaconda3\envs\greenland3\lib\site-packages\seaborn\relational.py in parse_style(self, data, markers, dashes, order)
    488
    489             markers = self.style_to_attributes(
--> 490                 levels, markers, self.default_markers, "markers"
    491             )
    492

~\Anaconda3\envs\greenland3\lib\site-packages\seaborn\relational.py in style_to_attributes(self, levels, style, defaults, name)
    303             if any(missing_levels):
    304                 err = "These `style` levels are missing {}: {}"
--> 305                 raise ValueError(err.format(name, missing_levels))
    306
    307         return attrdict

ValueError: These `style` levels are missing markers: {'THU_L', 'UPE_L', 'UPE_U'}
So you’d need to specify the markers you want to use.
mwaskom
on 3 Nov 2018
If you look at the scatterplot docs, there are examples of how to do so.
mwaskom
on 3 Nov 2018
Thanks, @mwaskom, I have looked at the scatterplot docs in detail, but can't find anything that addresses this issue. As I mentioned, I tried specifying both the style and markers parameters, but this doesn't work.
I'm trying to understand why it works when I do this, with lmplot():
markers = ['o', 's', 'p', 'x', '^', '+', '*', '<', 'D', 'h', '>']
sns.lmplot(data=ab_total, x='ablation (pres trans)', y='ablation (SEB)',
                   hue='station', markers=markers, scatter=True, fit_reg=False)
But it doesn't work when I try to do exactly the same thing with scatterplot():
markers = ['o', 's', 'p', 'x', '^', '+', '*', '<', 'D', 'h', '>']
fig, (ax1, ax2) = plt.subplots(1, 2, figsize=(16, 8))
sns.scatterplot(data=ab_total, x='ablation (pres trans)', y='ablation (SEB)',
                hue='station', style='station', markers=markers, ax=ax1)
scatterplot() gives me the following error message about mixing filled and line art markers, even though these exact same markers were not a problem with lmplot(). Why?
ValueError                                Traceback (most recent call last)
<ipython-input-98-b9ab75c4623b> in <module>()
      3 fig, (ax1, ax2) = plt.subplots(1, 2, figsize=(16, 8))
      4 sns.scatterplot(data=ab_total, x='ablation (pres trans)', y='ablation (SEB)',
----> 5                 hue='station', style='station', markers=markers, ax=ax1)

~\Anaconda3\envs\greenland3\lib\site-packages\seaborn\relational.py in scatterplot(x, y, hue, style, size, data, palette, hue_order, hue_norm, sizes, size_order, size_norm, markers, style_order, x_bins, y_bins, units, estimator, ci, n_boot, alpha, x_jitter, y_jitter, legend, ax, **kwargs)
   1333         x_bins=x_bins, y_bins=y_bins,
   1334         estimator=estimator, ci=ci, n_boot=n_boot,
-> 1335         alpha=alpha, x_jitter=x_jitter, y_jitter=y_jitter, legend=legend,
   1336     )
   1337

~\Anaconda3\envs\greenland3\lib\site-packages\seaborn\relational.py in __init__(self, x, y, hue, size, style, data, palette, hue_order, hue_norm, sizes, size_order, size_norm, dashes, markers, style_order, x_bins, y_bins, units, estimator, ci, n_boot, alpha, x_jitter, y_jitter, legend)
    859         self.parse_hue(plot_data["hue"], palette, hue_order, hue_norm)
    860         self.parse_size(plot_data["size"], sizes, size_order, size_norm)
--> 861         self.parse_style(plot_data["style"], markers, None, style_order)
    862         self.units = units
    863

~\Anaconda3\envs\greenland3\lib\site-packages\seaborn\relational.py in parse_style(self, data, markers, dashes, order)
    510         if any(filled_markers) and not all(filled_markers):
    511             err = "Filled and line art markers cannot be mixed"
--> 512             raise ValueError(err)
    513
    514         self.style_levels = levels

ValueError: Filled and line art markers cannot be mixed
Here is a minimum working example with some random data. Can you please advise what am I doing wrong?
np.random.seed(0)
df = pd.DataFrame(np.random.random((100, 2)), columns=['x', 'y'])
df['category'] = np.random.randint(0, 11, 100)
df['category'] = df['category'].map({n : c for n, c in zip(range(11), list('ABCDEFGHIJK'))})
markers = ['o', 's', 'p', 'x', '^', '+', '*', '<', 'D', 'h', '>']

sns.lmplot(data=df, x='x', y='y', hue='category', markers=markers, fit_reg=False)

sns.scatterplot(data=df, x='x', y='y', hue='category', style='category', markers=markers)
ValueError                                Traceback (most recent call last)
<ipython-input-117-921e8c9f432b> in <module>()
----> 1 sns.scatterplot(data=df, x='x', y='y', hue='category', style='category', markers=markers)

~\Anaconda3\envs\greenland3\lib\site-packages\seaborn\relational.py in scatterplot(x, y, hue, style, size, data, palette, hue_order, hue_norm, sizes, size_order, size_norm, markers, style_order, x_bins, y_bins, units, estimator, ci, n_boot, alpha, x_jitter, y_jitter, legend, ax, **kwargs)
   1333         x_bins=x_bins, y_bins=y_bins,
   1334         estimator=estimator, ci=ci, n_boot=n_boot,
-> 1335         alpha=alpha, x_jitter=x_jitter, y_jitter=y_jitter, legend=legend,
   1336     )
   1337

~\Anaconda3\envs\greenland3\lib\site-packages\seaborn\relational.py in __init__(self, x, y, hue, size, style, data, palette, hue_order, hue_norm, sizes, size_order, size_norm, dashes, markers, style_order, x_bins, y_bins, units, estimator, ci, n_boot, alpha, x_jitter, y_jitter, legend)
    859         self.parse_hue(plot_data["hue"], palette, hue_order, hue_norm)
    860         self.parse_size(plot_data["size"], sizes, size_order, size_norm)
--> 861         self.parse_style(plot_data["style"], markers, None, style_order)
    862         self.units = units
    863

~\Anaconda3\envs\greenland3\lib\site-packages\seaborn\relational.py in parse_style(self, data, markers, dashes, order)
    510         if any(filled_markers) and not all(filled_markers):
    511             err = "Filled and line art markers cannot be mixed"
--> 512             raise ValueError(err)
    513
    514         self.style_levels = levels

ValueError: Filled and line art markers cannot be mixed
You can’t mix filled and line markers, just like the error message says.
mwaskom
on 4 Nov 2018
Yes, I did read the error message. I was hoping to gain some insight on the inconsistent behaviour between lmplot() and scatterplot(), since lmplot() allows filled and line markers to be mixed, whereas scatterplot() apparently does not. It would have been nice if I could make the same scatter plot with either function, but no big deal. Thanks.
jenfly
on 5 Nov 2018
I agree, apparently markers only accepts these markers in scatterplot:
filled_markers = ('o', 'v', '^', '<', '>', '8', 's', 'p', '*', 'h', 'H', 'D', 'd', 'P', 'X')
Source of markers: https://matplotlib.org/2.0.2/api/markers_api.html
 ventilator
on 5 Apr 2019
ventilator
on 5 Apr 2019
Matplotlib itself doesn't have any problems with mixing filled and line markers. Why is Seaborn not allowing it?
 romanwerpachowski
on 11 Jun 2020
romanwerpachowski
on 11 Jun 2020
Matplotlib doesn't mix markers, at all. in ax.scatter, the marker= parameter takes a singleton input, and you need to call it multiple times if you want to vary markers with some variable. Seaborn draws a single scatterplot with a dummy marker and then goes into the path collection that's produced and modifies the paths to vary the markers with the style semantic. This way, you avoid having all of the points for the last level in the style order lying on top of the others. But because of the way that matplotlib resolves the colors of path collections, mixing markers will make the line art markers the specified edgecolor, which means that they either won't follow the hue semantic or, if the edge is white (the default in the seaborn style), they'll be invisible. So that check exists to avoid people generating a plot with invisible markers, which is generally considered a visualization antipattern.
mwaskom
on 11 Jun 2020
Makes sense ;-)
romanwerpachowski
on 11 Jun 2020
https://github.com/mwaskom/seaborn/pull/2075 changed scatterplot so that it can generate an arbitrarily large number of distinct (in theory, if not always in practice) markers, so you won't see the original error in 0.11+.
That said, shape is the hardest channel to perceive and I'd encourage people not to make plots that rely on fine discrimination of markers for key insights.
mwaskom
on 11 Jun 2020
Hello! I'm trying to create a scatter plot where the markers are different for each category (both the colour and the marker style). I can do this in
lmplot(), for example:iris = sns.load_dataset('iris') sns.lmplot(data=iris, x='petal_length', y='petal_width', hue='species', markers=['o', '*', '+'], fit_reg=False)
But when I try the equivalent with the
scatterplot()function, the markers are all the same style:sns.scatterplot(data=iris, x='petal_length', y='petal_width', hue='species', markers=['o', '*', '+'])
I'm wondering if this
markersparameter hasn't been implemented yet inscatterplot(), or if it requires a different syntax? I've tried various different approaches, but I can't seem to get the markers to be different styles for different categories.Alternatively, is there some way that I can use
lmplot()so that the scatter plot it creates can be created as a subplot within a figure with other subplots, that aren't part of a FacetGrid? This is straightforward withscatterplot()because I can provide the subplot axes as an input to the function, but I can't figure out how to do this withlmplot().Any assistance would be greatly appreciated! Thank you!
It might be too late but wanted to share my solution.
I had similar issue but I tried the following and it worked - I used my own variables here.
First define markers
markers = {"20CR": "X", "ERA-20C": "s", "ERA-Interim":'o', "MERRA":'^'}
sns.scatterplot(x = x, y = y, s =70, markers = markers, style = 'reanalysis', hue = 'reanalysis', data = dat)
Hope it works :)
 moinabyssinia
on 17 Jul 2020
moinabyssinia
on 17 Jul 2020
Related issues
 queryous
·
4Comments
queryous
·
4Comments
 songololo
·
4Comments
songololo
·
4Comments
 btyukodi
·
3Comments
btyukodi
·
3Comments
 alexpetralia
·
3Comments
alexpetralia
·
3Comments
 Bercio
·
3Comments
Bercio
·
3Comments
Most helpful comment
I agree, apparently markers only accepts these markers in scatterplot:
filled_markers = ('o', 'v', '^', '<', '>', '8', 's', 'p', '*', 'h', 'H', 'D', 'd', 'P', 'X')
Source of markers: https://matplotlib.org/2.0.2/api/markers_api.html