Seaborn: [New feature request] ci = 'se' for categorical plots
This is a new feature request, which should be very straightforward to implement.
Now that the ci parameter supports showing sd, it would be also handy to include the option to show se, i.e., standard error as well. This would be just a division of the standard deviation by $sqrt(n)$.
I would be happy to implement this and submit a PR if people are happy with this addition.
 agamemnonc
All 5 comments
You can show standard error with a 68% confidence interval.
 mwaskom
on 11 May 2018
mwaskom
on 11 May 2018
I am afraid this is not accurate.
Standard error of some quantity is the population standard deviation divided by sqrt(n), without making any assumptions about the underlying distribution.
Another way of seeing why this is not right is that the standard error (of the mean, median or anything else), much like the standard deviation, should be fixed and not dependent on bootstrapping which we would have to rely on to compute 68% intervals.
The standard error is just a metric showing how far is the sample estimate of a quantity (e.g. sample mean) from the population estimate of the same quantity (e.g. population mean).
agamemnonc
on 11 May 2018
Thanks for the link to wikipedia. I'd suggest you read down to the "assumptions and usage" section.
If you have normally distributed data, then the 68% confidence interval will correspond to the standard error of the mean. In the case of bootstrapping, this will only be approximate and dependent on the number of bootstrap samples.
If you do not have normally distributed data, then the standard error of the mean will be useless, and the bootstrap confidence interval will give you much more informative error bars.
mwaskom
on 11 May 2018
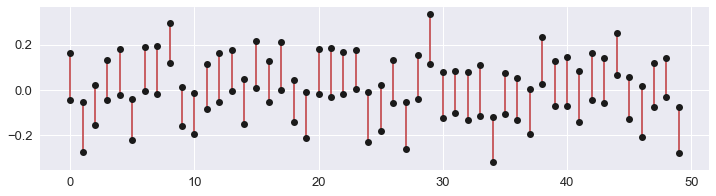
Here, convince yourself:
f, ax = plt.subplots(figsize=(12, 3))
n = 100
for i in range(50):

    x = i, i

    a = np.random.randn(n)
    ci = sns.utils.ci(sns.algorithms.bootstrap(a), 68)
    ax.plot(x, ci, color="r")

    m = a.mean()
    se = a.std() / np.sqrt(n)
    ax.plot(x, [m - se, m + se], "o", color="k")
mwaskom
on 11 May 2018
I am afraid you are right. I was thinking of computing standard error of median, but like you said it doesn't make sense for non-normal distributions.
I am closing this now and thanks for clarifying.
agamemnonc
on 11 May 2018
Related issues
 JanHomann
·
3Comments
JanHomann
·
3Comments
 Bercio
·
3Comments
Bercio
·
3Comments
 alexpetralia
·
3Comments
alexpetralia
·
3Comments
 phantom0301
·
3Comments
phantom0301
·
3Comments
 sungshine
·
3Comments
sungshine
·
3Comments
Most helpful comment
Thanks for the link to wikipedia. I'd suggest you read down to the "assumptions and usage" section.
If you have normally distributed data, then the 68% confidence interval will correspond to the standard error of the mean. In the case of bootstrapping, this will only be approximate and dependent on the number of bootstrap samples.
If you do not have normally distributed data, then the standard error of the mean will be useless, and the bootstrap confidence interval will give you much more informative error bars.