Hi all,
(first of all: awesome library, I love it)
I am wondering about the default behavior of distplot when norm_hist is False.
At least on 0.8.0, when
sns.distplot(x, norm_hist=False)
produces a figure that is 1) normalized and 2) still has the KDE, which is a bit of a gotcha (_i.e._ unless you carefully read the docs for norm_hist and kde and infer if kde is default-True, and it might override norm_hist=False.
If you run:
sns.distplot(x, norm_hist=False, kde=False)
This will give you an unnormed, _sans_-KDE distribution.
Which itself is a little disappointing since the KDE is actually super nice for understanding the structure of the data.
I can think of two potential ways to address this mild annoyance:
- default
kde=Noneand have it infer if it should compute a KDE from the value ofnorm_hist, or - if
norm_hist=False, compute the KDE of the normalized figure, but then multiply it by the integration value of the distribution to put it on the plot. (I am not a statistician, so this seems fine to me, but perhaps isn't kosher for some reason?)
I'd be open to doing this myself (esp 2), as long as I know you'll accept the PR 😅 .
Cheers!
 justinrporter
All 6 comments
This has come up before, see e.g #479 where there is some discussion of technical issues involved in showing an "unnormalized" density curve over a histogram. The short answer is your reasoning about the solution is incorrect because the "raw" density (i.e. without normalization, or by multiplying the normalized density by the normalization constant) will not match a histogram.
I've viewed this as low priority as I think people overestimate how informative the KDE actually is.
 mwaskom
on 27 Sep 2017
mwaskom
on 27 Sep 2017
The short answer is your reasoning about the solution is incorrect because the "raw" density
Yes I figured that there was be some reason for this, and your thinking seems very reasonable to me. I tried searching the issue list but I suspect I forgot to clear is:open from the search and so I didn't find that issue (oops).
I would still lobby for option 1, then, because it is pretty surprising to explicitly call sns.distplot(x, norm_hist=False) and have it be ignored.
Specifically, I'd suggest changing the default value of kde to None, and then inferring its value based upon the value of norm_hist. The behavior would then be something like the following:
| norm_hist | kde | Behavior |
| ------------- | --------| -----|
| True | None | normed w/ KDE (default) |
| True | True | normed w/ KDE |
| True | False | normed w/o KDE |
| False | None | raw w/o KDE |
| False | True | exception or warning |
| False | False | raw w/o KDE |
justinrporter
on 27 Sep 2017
I think your proposed API is no less surprising. The dependence of norm_hist on the presence of the kde is easy to explain and is clearly stated in the docstring.
What is more likely to happen is that I am going to change it to not show the KDE automatically, because I no longer think it's a good part of a default plot.
mwaskom
on 28 Sep 2017
Actually norm_hist is a little vestigial; originally the histogram was always normalized, then that parameter was added to make it optionally not, and then the default changed so the histogram normalization depended somewhat confusingly on two parameters. At this point, norm_hist is actually superfluous and candidate for removal.
mwaskom
on 28 Sep 2017
Hi.
Actually I'm quite fond of norm_hist and would appreciate an evolution of it rather than seeing it disappear.
As seen in #479 #1396 and #61, in certain situations it's problematic to not be able to scale or "denormalize" a kde in distplot.
Here is my situation, I plot 2 histograms on the same axes to see the differences.
At first I used matplotlib's hist as a 'stepfilled' with low alpha.
nWidthBar=20
plt.hist([tJour["Success"], tJour["Fail"]], bins=np.arange(0.0, 1.0, 1/nWidthBar), histtype='stepfilled', alpha=0.1, label=["Pari gagné", "Pari perdu"])
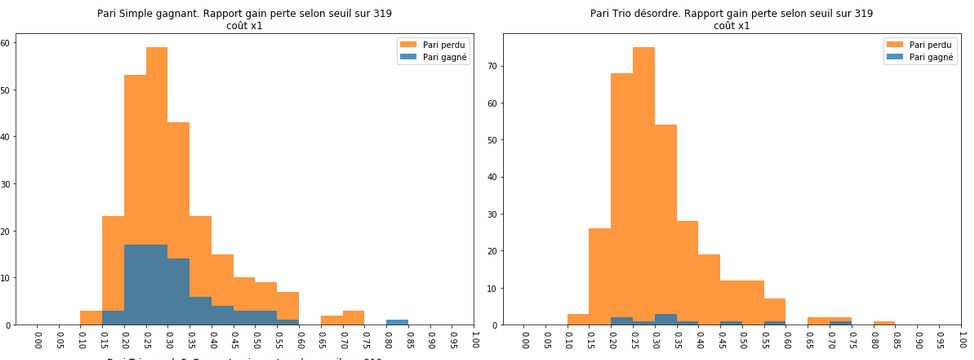
As you can see, values are between 0.0 and 1.0. Both sets can start and end with different minimal and maximal values. I had to set the bins as a list to correct this.
Important: The sets don't have the same quantity of values hence if normalized I will not be able to see where and how much one set is above the other.
I don't really care about the values on y axis, I want to keep the proportion between both sets as said in #61
I wanted to have a better visualization with kde using distplot, I know kde is about density and having an area of 1 under the curve but as I said I don't care about the values, I just need to keep the correct proportion between both sets.
Here is the code, range was used to keep the same bins width with both sets with kde.
ax = plt.subplot(nbLignes, 3, nInd+1)
sns.distplot(tJour["Success"], ax=ax, norm_hist=False, bins=20, hist = True, kde = True, hist_kws={'range':(0,1)}, kde_kws = {'shade': True, 'linewidth': 3, 'bw': 1/40}, label="Pari gagné")
sns.distplot(tJour["Fail"],    ax=ax, norm_hist=False, bins=20, hist = True, kde = True, hist_kws={'range':(0,1)}, kde_kws = {'shade': True, 'linewidth': 3, 'bw': 1/40}, label="Pari perdu")

You can see the problem, both sets are normalized without taking into account the other so the blue set becomes as big as the orange one. It doesn't show anymore that I have very few blues.
I would have like to be able to correct this by giving both sets to one distplot rather than doing 2 distplots or by adding something like norm_kde=False to keep the height of the kde as it is for the histogram.
I did it by drawing on different axes and changing the ylim of each kde in function of the area occupied by each set since whatever the base area, a kde will have an area of 1.0
nWidthBar = 20
arr, _, _ = plt.hist([tJour["Success"], tJour["Fail"]], bins=np.arange(0.0, 1.0, 1/nWidthBar), histtype='stepfilled', alpha=0.1, label=["Pari gagné", "Pari perdu"])
tSurfaces = []
for tab in arr: # get original areas
    tSurfaces.append(np.sum(tab)/nWidthBar)
ax1 = ax.twinx()
ylimMax = ax.get_ylim()[1]
ax1.set_ylim(top=ylimMax/tSurfaces[0]) # scale kde set0
ax1.yaxis.set_ticks([])
sns.distplot(tJour["Succes"], ax=ax1, bins=nWidthBar, hist = False, kde = True, hist_kws={'range':(0,1)}, kde_kws = {'shade': True, 'linewidth': 3, 'bw': 1/40}, color='C0')
ax2 = ax.twinx()
ax2.set_ylim(top=ylimMax/tSurfaces[1]) # scale kde set 1
ax2.yaxis.set_ticks([])
sns.distplot(tJour["Fail"],    ax=ax2, bins=nWidthBar, hist = False, kde = True, hist_kws={'range':(0,1)}, kde_kws = {'shade': True, 'linewidth': 3, 'bw': 1/40}, color='C1')

So what I mean is:
- With multiple sets to plot, normalized or not, sometimes it's important to keep the relative proportion to compare them.
- I prefer to compare them with kde over histograms.
- A lot of code has to be written rather than just giving a list with both sets to distplot (like in matplot.hist) and setting a
norm=False
 Abysselene
on 22 Feb 2019
Abysselene
on 22 Feb 2019
Closed with #2125
mwaskom
on 14 Jun 2020
Related issues
 songololo
·
4Comments
songololo
·
4Comments
 ConstantinoSchillebeeckx
·
4Comments
ConstantinoSchillebeeckx
·
4Comments
 bondarevts
·
3Comments
bondarevts
·
3Comments
 amelio-vazquez-reina
·
3Comments
amelio-vazquez-reina
·
3Comments
 JanHomann
·
3Comments
JanHomann
·
3Comments
Most helpful comment
Hi.
Actually I'm quite fond of norm_hist and would appreciate an evolution of it rather than seeing it disappear.
As seen in #479 #1396 and #61, in certain situations it's problematic to not be able to scale or "denormalize" a kde in distplot.
Here is my situation, I plot 2 histograms on the same axes to see the differences.
At first I used matplotlib's hist as a 'stepfilled' with low alpha.
As you can see, values are between 0.0 and 1.0. Both sets can start and end with different minimal and maximal values. I had to set the bins as a list to correct this.
Important: The sets don't have the same quantity of values hence if normalized I will not be able to see where and how much one set is above the other.
I don't really care about the values on y axis, I want to keep the proportion between both sets as said in #61
I wanted to have a better visualization with kde using distplot, I know kde is about density and having an area of 1 under the curve but as I said I don't care about the values, I just need to keep the correct proportion between both sets.
Here is the code,
rangewas used to keep the same bins width with both sets with kde.You can see the problem, both sets are normalized without taking into account the other so the blue set becomes as big as the orange one. It doesn't show anymore that I have very few blues.
I would have like to be able to correct this by giving both sets to one distplot rather than doing 2 distplots or by adding something like
norm_kde=Falseto keep the height of the kde as it is for the histogram.I did it by drawing on different axes and changing the ylim of each kde in function of the area occupied by each set since whatever the base area, a kde will have an area of 1.0
So what I mean is:
norm=False