Following code scales Y axis with small values wrong in half of cases:
import numpy as np
import pandas as pd
import seaborn as sns
import matplotlib.pyplot as plt

df = pd.DataFrame(np.random.randn(100,4), columns=list('ABCD'))
df.A = df.A/1e6
df.B = df.B/1e3
df.D = df.D*1e3

sns.pairplot(df, vars=["A", "B", "C", "D"])

sns.PairGrid(df).map(plt.scatter) will autoscale both axes wrong in every case for small values:

Probably this goes to plt.scatter, because plt.scatter([-1e-6, 1e-6], [-1e-6, 1e-6]) won't autoscale right.

862 is about exactly this, however, I'm still puzzled with half-normal pairplot behavior, seems it should return diag-symmetrical plots even with wrong autoscale in scatter function.
 oneunreadmail
All 5 comments
I'm still puzzled with half-normal pairplot behavior, seems it should return diag-symmetrical plots even with wrong autoscale in scatter function.
This is probably because the histogram on the diag axes is setting the proper scaling of the x axes?
 mwaskom
on 25 Feb 2017
mwaskom
on 25 Feb 2017
This is probably because the histogram on the diag axes is setting the proper scaling of the x axes?
Yeah, you're probably right. Does it happen inside plt as well? This means, it can't (shouldn't) be fixed in seaborn?
oneunreadmail
on 25 Feb 2017
Yes, I don't understand exactly what the issue with autoscaling is, but this is a problem at the matplotlib layer.
mwaskom
on 25 Feb 2017
I have an issue with distplot and kdeplot in PairGrid with 0.9.0
import seaborn as sns
import pandas as pd
df = sns.load_dataset('tips')
sns.PairGrid(df.dropna())\
   .map_lower(sns.regplot, scatter_kws={'s': 0.5})\
   .map_upper(sns.kdeplot, shade=True)\
   .map_diag(sns.kdeplot)

But using distplot alone will produce
sns.distplot(df.total_bill)
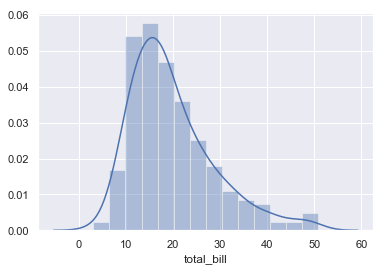
Is there any way to solve this issue?
 StevenLi-DS
on 21 Feb 2019
StevenLi-DS
on 21 Feb 2019
You want
sns.PairGrid(df.dropna(), diag_sharey=False)
to solve the issue.
 thomascarreau
on 16 Apr 2019
thomascarreau
on 16 Apr 2019
Related issues
 vinay-jayaram
·
3Comments
vinay-jayaram
·
3Comments
 alexpetralia
·
3Comments
alexpetralia
·
3Comments
 stonebig
·
4Comments
stonebig
·
4Comments
 rrbarbosa
·
3Comments
rrbarbosa
·
3Comments
 btyukodi
·
3Comments
btyukodi
·
3Comments
Most helpful comment
You want
sns.PairGrid(df.dropna(), diag_sharey=False)to solve the issue.