Sdwebimage: Memory problem that caused the crash
Info | Value
-|-
Platform Name | ios
Platform Version | 11.2
SDWebImage Version | 4.3.0
Integration Method | cocoapods
Xcode Version | Xcode 9.2
Repro rate | all the time
HI,friend
UICollectionView Load more than twenty webp animations
Memory problem that caused the crash
 lzylzy1991
All 61 comments
Could you please provide more detail information about the memory warning.
For example, what size of Animated WebP images are you loading ?
Did you try disable shouldDecompressImages when loading images ?
When did the memory warning notification fired, means does this fired during decoding or the cell reusing and rendering ?
 dreampiggy
on 13 Mar 2018
dreampiggy
on 13 Mar 2018

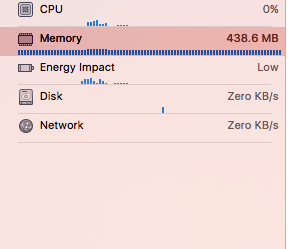
Occupies memory close to 100M。
When you continue to slide the UICollectionView will crash
Animated WebP images size 200 -300 KB
lzylzy1991
on 15 Mar 2018
Hi @lzylzy1991,
I also got this issue while loading 150 - 200 images from URL in collection view and scrolling.
Not sure exactly but till now, did not got this issue in real device, while i tested.. but issue often occurs is simulator...
I am still testing.. Can you share your findings till now? Would be helpful..
 PrakashMaharjan
on 19 Mar 2018
PrakashMaharjan
on 19 Mar 2018
i am also having this issues, while collection view reloading or i am scrolling it crossed 400 Mb and app got crashed
 shaktiprakash099
on 21 Mar 2018
shaktiprakash099
on 21 Mar 2018
@lzylzy1991 @PrakashMaharjan @shaktiprakash099 Are all of you using Animated WebP in collection view ? But it seems that during 4.2.x -> 4.3.x there is no change on SDWebImageWebPCoder. Could you please provide a demo that can trigger this OOM issue
dreampiggy
on 21 Mar 2018
HI @dreampiggy, I am not using animated WebP, but its just normal images from url.
The images are about 150 - 200 in numbers from JSON array. While loading on collection view and then scrolling in collection view, it crashes. I often got this issue in iOS simulator but have not encountered in real device, when i checked. I feel its the memory issue as mentioned by @shaktiprakash099 and @lzylzy1991
PrakashMaharjan
on 21 Mar 2018
@PrakashMaharjan how big are the images in terms of size and resolution?
 mythodeia
on 21 Mar 2018
mythodeia
on 21 Mar 2018
@mythodeia my images are 250 to 300 Kb ,the problem is that when the images are completely downloaded the memory impact drastically getting changed from 45 to 400 Mb ,in simulator it not happening as its using MAC memory but in real device its getting crashed ,i have also tried to use
cache clear ,but nothing happened .i am very close to my app lunch
shaktiprakash099
on 21 Mar 2018
@shaktiprakash099 and whats the resolution of those images? is it lower that 1000x....
mythodeia
on 21 Mar 2018
@lzylzy1991 the webp image you posted is a bit moret than 1MB in size. if you have 200 images of this size then the memory will surely rise
mythodeia
on 21 Mar 2018
@mythodeia yes its 125* 125
shaktiprakash099
on 21 Mar 2018
@lzylzy1991 did you find any solution for this
shaktiprakash099
on 21 Mar 2018
I'm also facing the same issue , memory grows till 1 GB and crashes. But it does not throws memory warning. Instead the log shows "Terminated due to memory error" . I tried disabling shoudCacheInMemory, and the memory usage drastically reduced to 100 MB.
 PadmaPreethi
on 21 Mar 2018
PadmaPreethi
on 21 Mar 2018
Hi @mythodeia ,
they are thumbnail images and are just about 40 - 50 KB and 300 X 408.
I have JSON array that returns around 150 - 200 thumbnail images that is meant to shown in UICollectionview. But while loading and scrolling often it crashes.
PrakashMaharjan
on 21 Mar 2018
I suggest that you spend some time with Instruments and find out exactly where your problem lies. If you can identify that the issue lies with SDWebImage code and not your code, then propose a fix.
 randarnold
on 21 Mar 2018
randarnold
on 21 Mar 2018
@PadmaPreethi where did you write shoudCacheInMemory ,in Viewdidapper or in collection view delegates methods could you please share your code snippet which reduces to 100 mb i am still having 450 Mb memor impact @randarnold hey i checked with instruments also the reason of high memory impact is SDwebimage
shaktiprakash099
on 22 Mar 2018
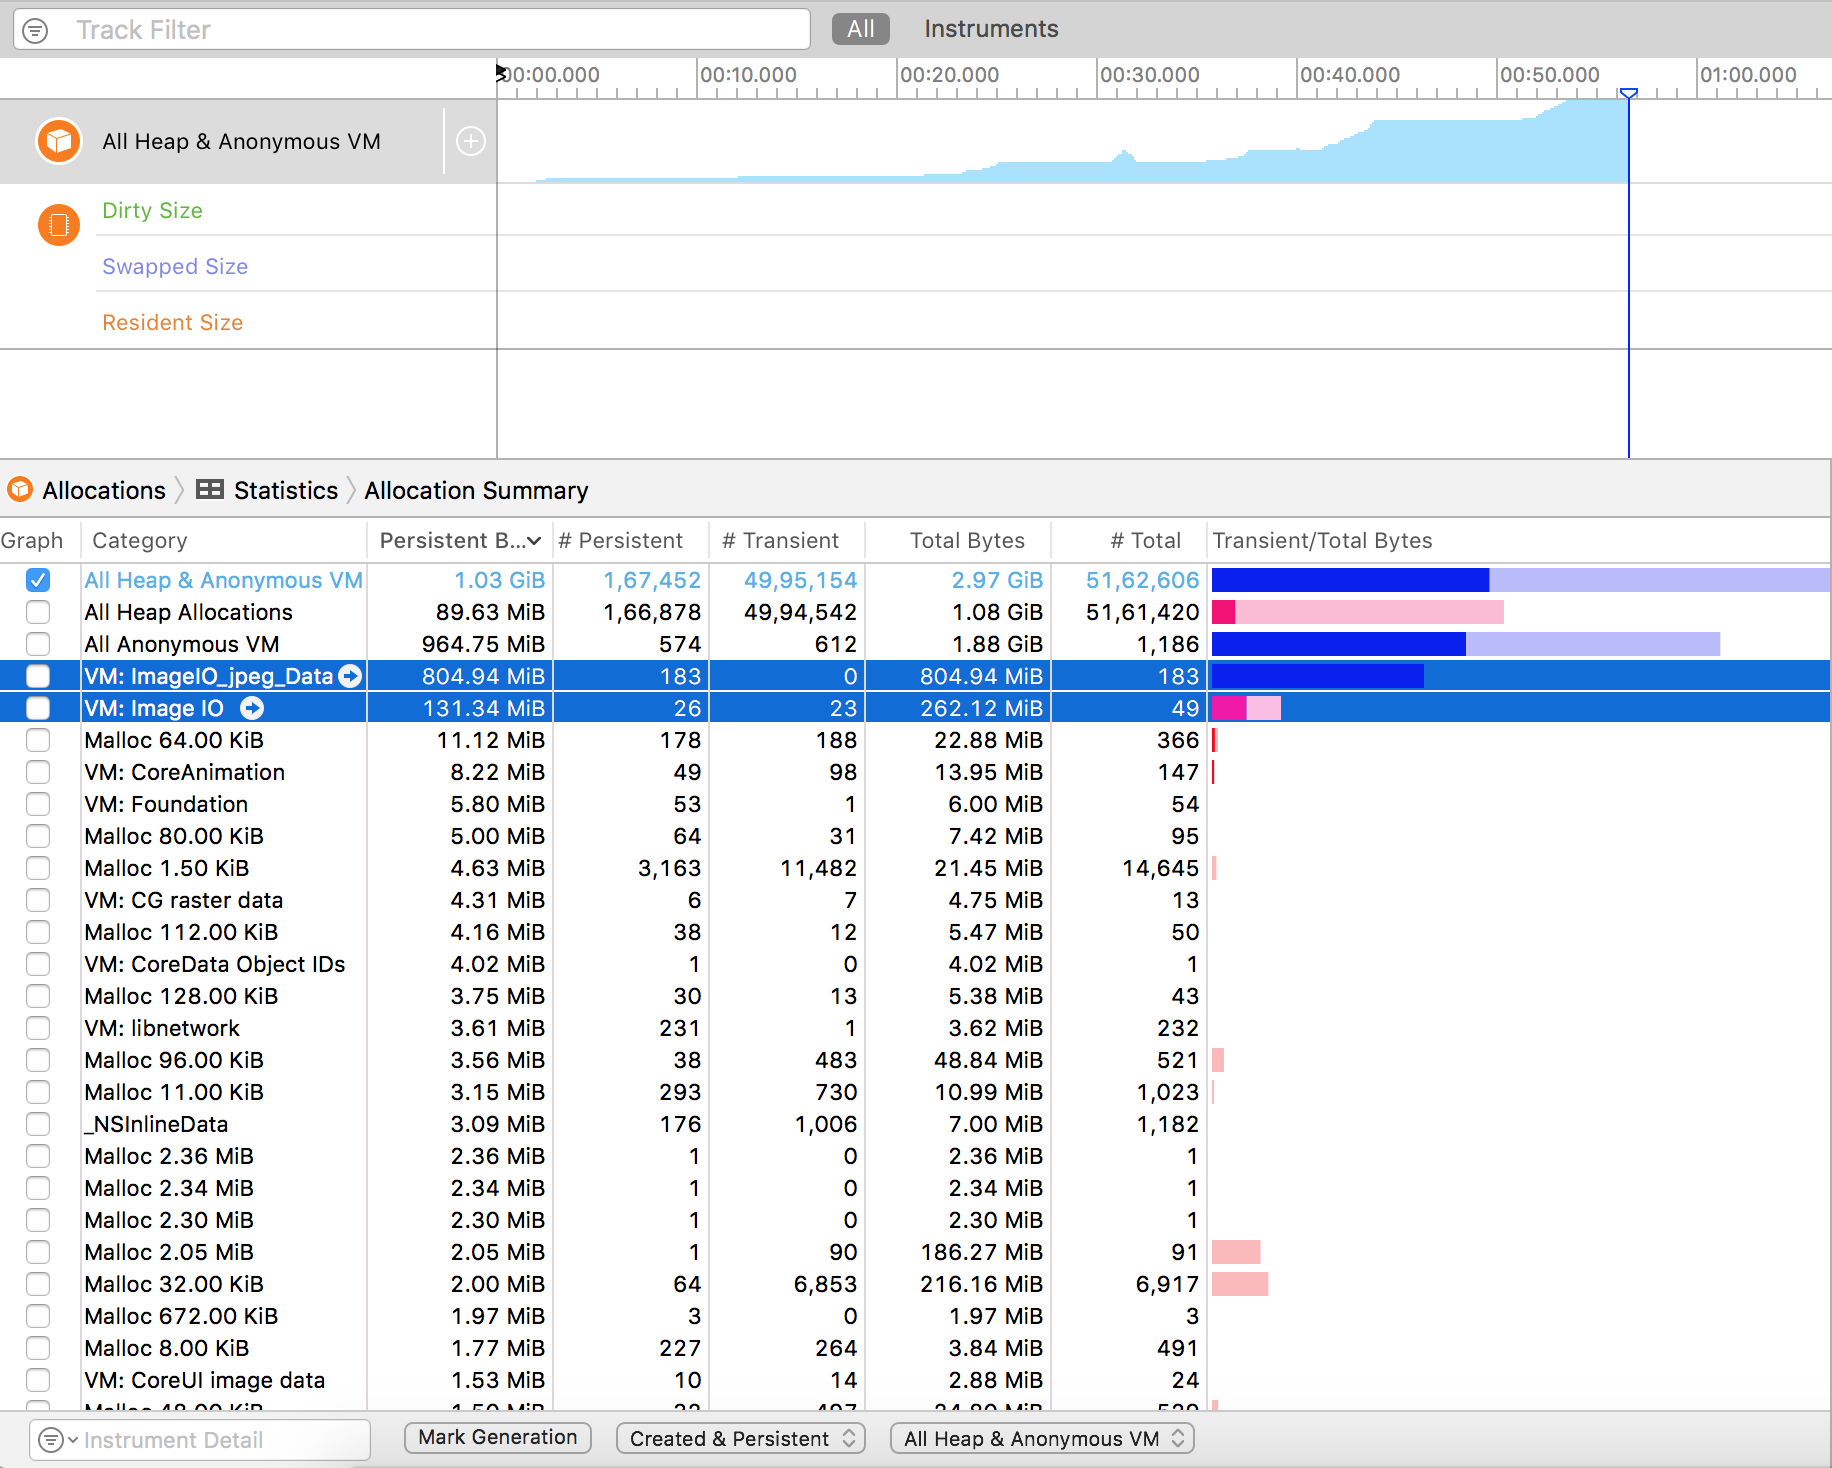
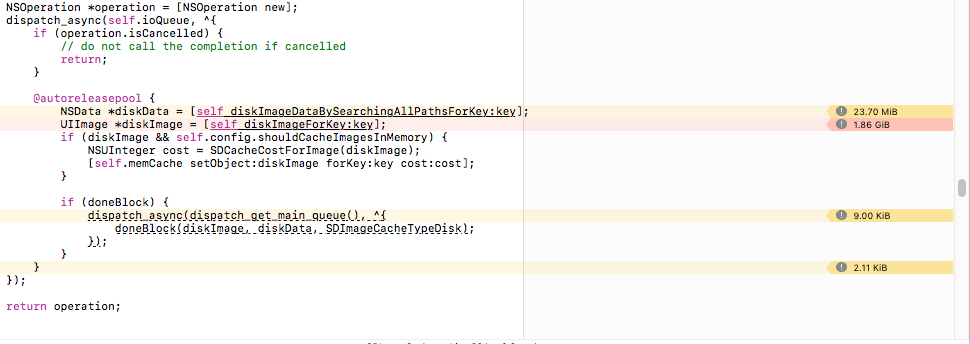
I tried disabling decompressing , but the image consumption is still the same just that now it shows in Image_IO_Jpeg_Data (Instead of raster data) .Refer above image.
I tried enabling decompression and disabled in memory cache. Memory usage reduced a lot and is always around 200 MB. But when i scroll fast, image views goes blank and loads again (which is expected as in memory cache is disabled).
When i disabled both decompression and in memory caching, memory consumption even reduced to 100 MB (But again performance lags).
PS: Each image size is of 100 KB.
PadmaPreethi
on 22 Mar 2018
@shaktiprakash099 : I added it in AppDelegate didFinishLaunchWithOptions.
PadmaPreethi
on 22 Mar 2018
@PadmaPreethi ,here is my App delegate application did finish lunching
 func application(_ application: UIApplication, didFinishLaunchingWithOptions launchOptions:
     [UIApplicationLaunchOptionsKey: Any]?) -> Bool {
     SDWebImageManager.shared().imageCache?.deleteOldFiles(completionBlock: nil)
     SDImageCache.shared().clearMemory()
     SDImageCache.shared().clearDisk()
     URLCache.shared.removeAllCachedResponses()
     return true
  }
have you added any thing extra
shaktiprakash099
on 22 Mar 2018
@shaktiprakash099 : You just need to set decompression to false,
[[[SDImageCache sharedImageCache] config] setShouldDecompressImages:NO];
[[SDWebImageDownloader sharedDownloader] setShouldDecompressImages:NO];
But remember , if you set this to false, the decompression will be done by the UIKit in main thread which will cause a drop in FPS. it's a trade off between memory and performance. Choose according to your need.
PadmaPreethi
on 22 Mar 2018
@PadmaPreethi ,letting performance down its not a good idea ,at the same time i am unable to reduce memory impact ,what to do ??
shaktiprakash099
on 22 Mar 2018
@dreampiggy : Please take a look at the allocations screen shot and let me know if i'm missing something.
PadmaPreethi
on 22 Mar 2018
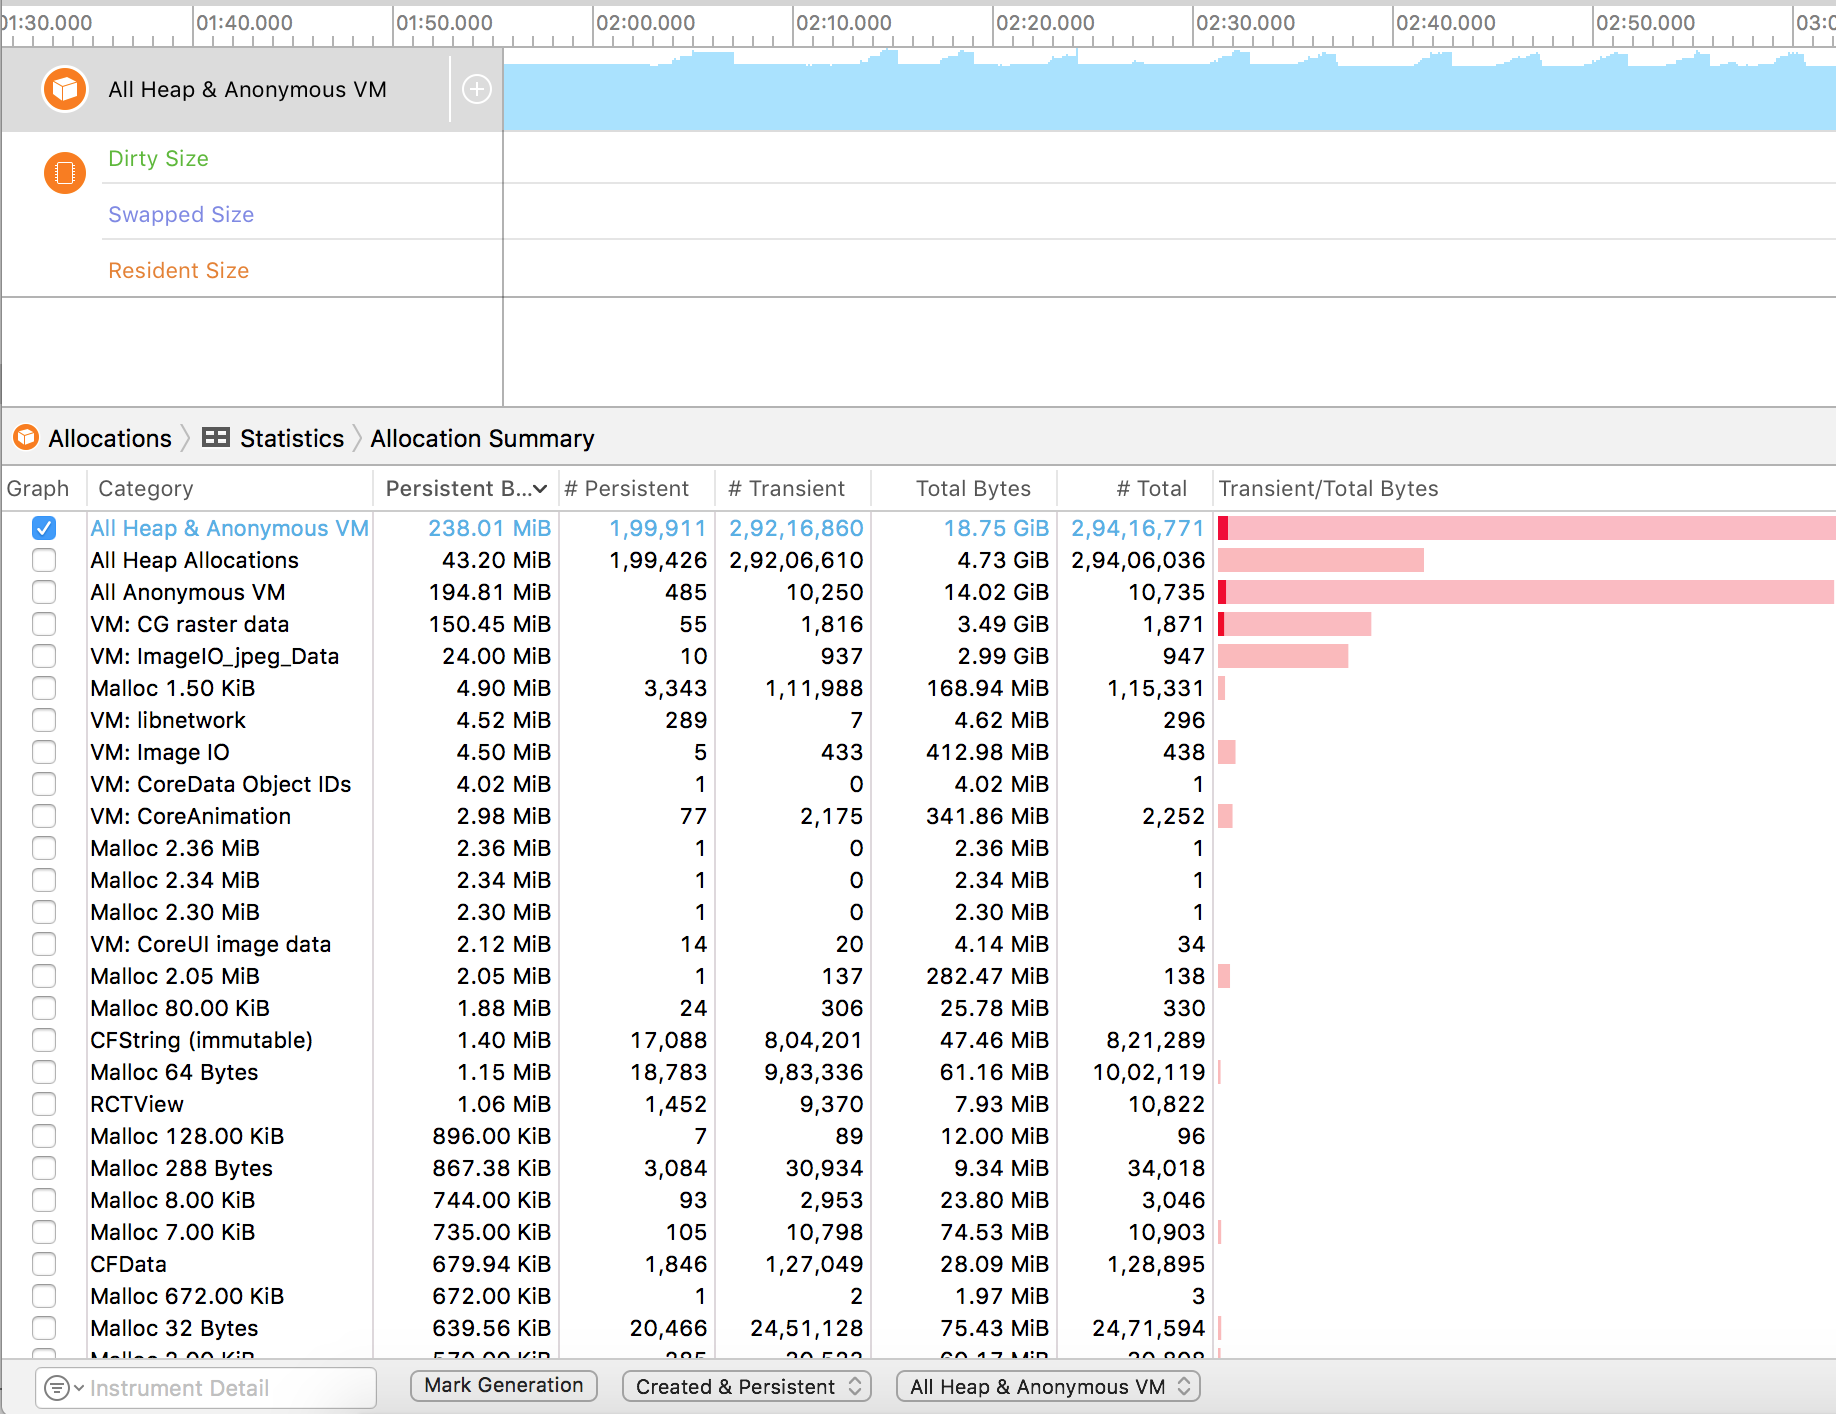
Adding a screen shot when Decompression and in memory caching is enabled.
To give more information about the issue,
i'm using SDWebImage - 4.3.2
Xcode - 9.2
iOS version - Tested on 11.2.1 & 11.2.6
PadmaPreethi
on 22 Mar 2018
So your allocations go up and up. You need to look at why. What are the retain counts? Who owns those allocations? Do you have any retain cycles? What is the life cycle of your objects? Any leaks?
You can call methods to dump objects when you get a memory warning, but if those objects still have a positive retain count they will not go away.
You are working in a constrained environment, you have to understand the constraints and work within them. It can be a long hard process to track down memory issues, but the tools available today it much easier. Try figuring all that out without instruments! (I have, thankfully I don't have to do that anymore).
randarnold
on 22 Mar 2018
@randarnold : Verified leaks as well. There is no major leak. Maximum leak is around 600KB thorugh out app usage. My question is why is Raster data or the image jpeg is not getting released from memory during memory warnings. Does setting totalCostLimit to SD cache helps ?
PadmaPreethi
on 22 Mar 2018
Try looking at the retain history of the objects. In normal use, the count goes up and then down to zero when it is released. There is probably a strong reference in there someplace that should be weak or another object that is holding a strong reference that in itself is not being released.
Is your code objective-c? Are you referencing self within any blocks?
randarnold
on 22 Mar 2018
@PadmaPreethi Hi. Could you please try to downgrade to the 4.3.0 version. Which I guess that #2228 may related to the memory warning behavior from 4.3.0 -> 4.3.3 all PRs.
And all of you, could you please provide any demo to simulate this use case about OOM ? The basic usage seems can not repduce this.
Or could you please set a break point on the memory warning in your own project, then try using Xcode's Memory Graph Debugger to check who retain the UIImage instance (SDImageCache or some other thing) ?
dreampiggy
on 22 Mar 2018
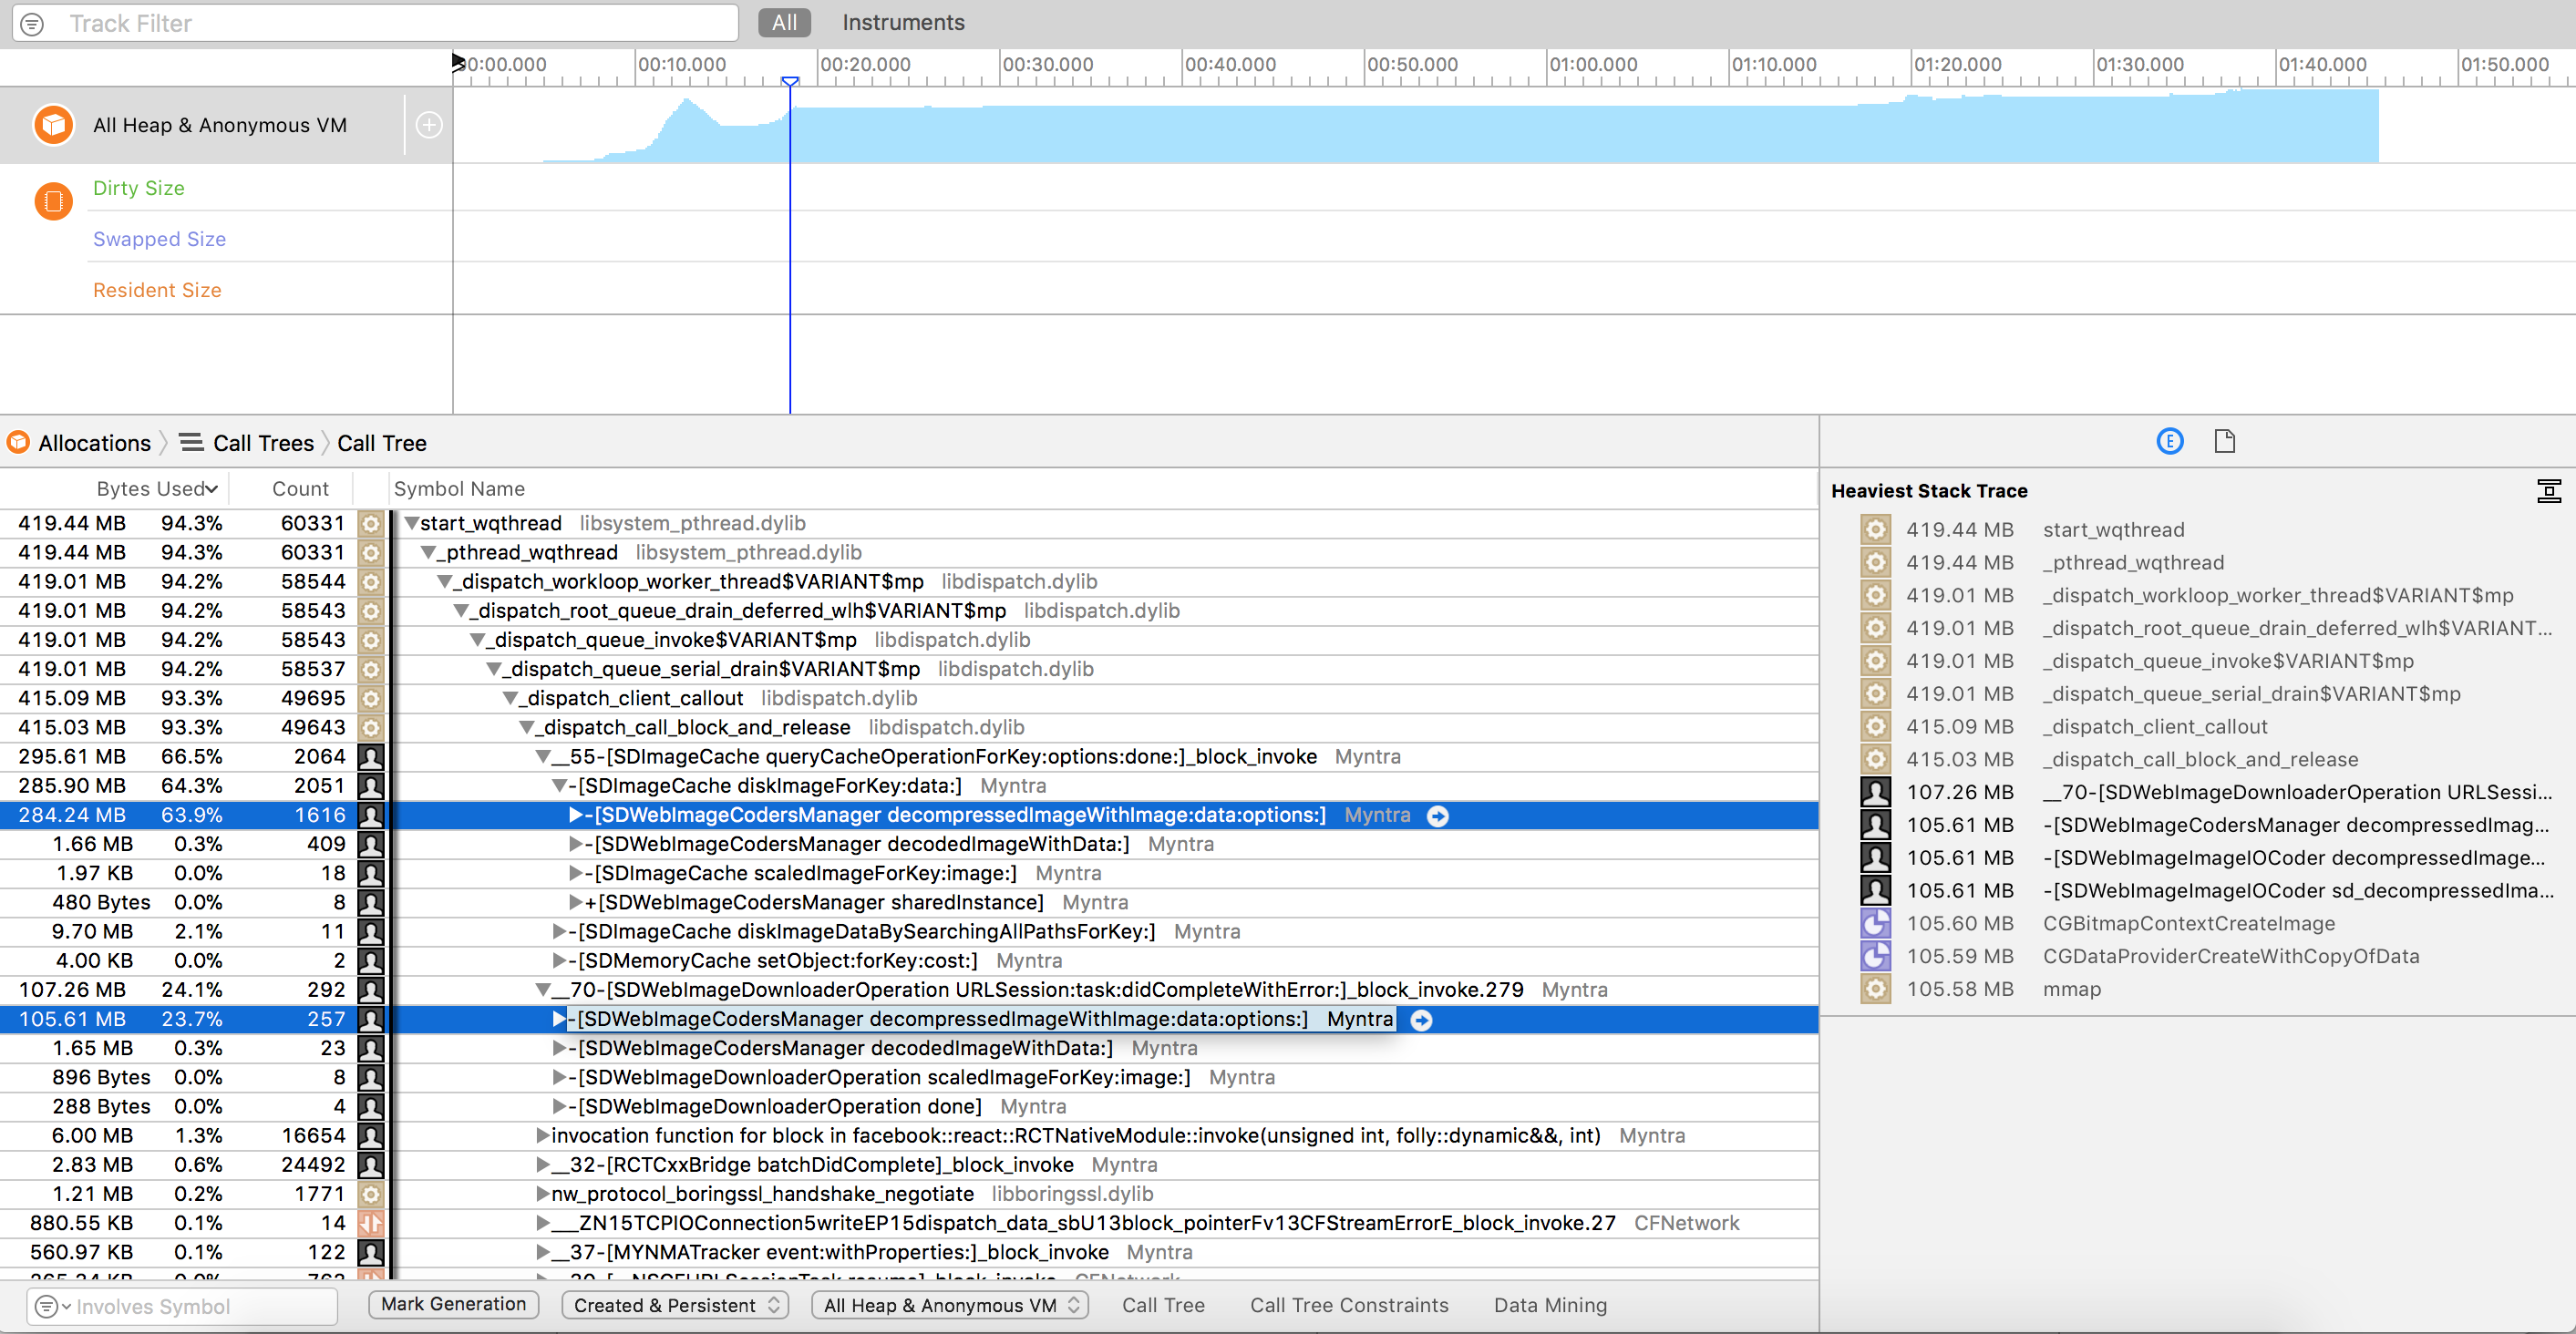
@dreampiggy : Tried downgrading to 4.3.0 , But still the raster data takes up lot of memory. I checked the references of UIIMage object through visual debugger. References seems to be fine (Nothing is retaining it) Also, when i noticed the size of raster data for each uiimage, it's size is between 3-5 MB. That's huge !!
PadmaPreethi
on 24 Mar 2018
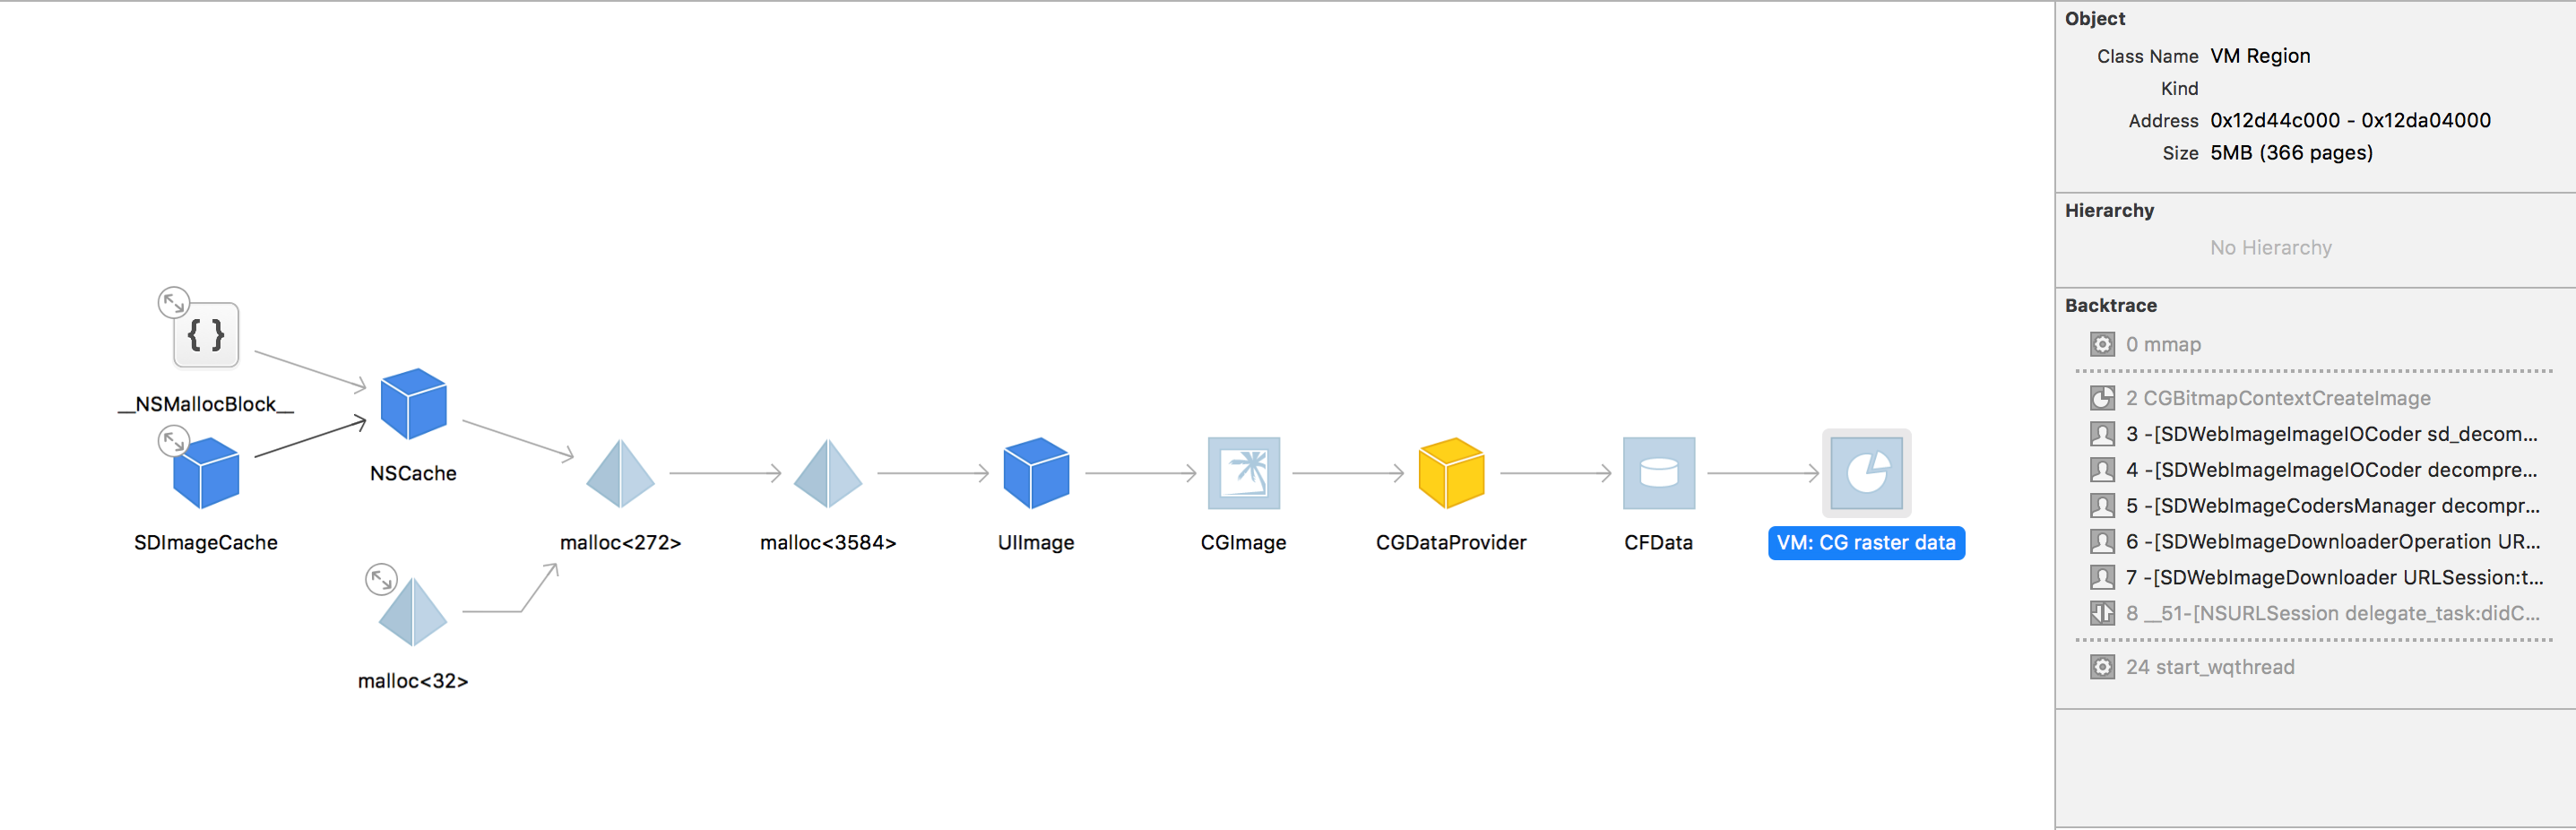
@PadmaPreethi Hi, could you please check that whether these UIImage instance is still alive and retained by SDImageCache, or more specific, in NSCache or SDMemoryCache (from 4.3.1) ? You can use that visual debugger to check by filtering the the name and address.
If so, you should specify a lower limit in maxMemoryCost and maxMemoryCountLimit. The defaults value are both 0, means no limit at all. (But when the memory warning occur, we will clear the memory cache)
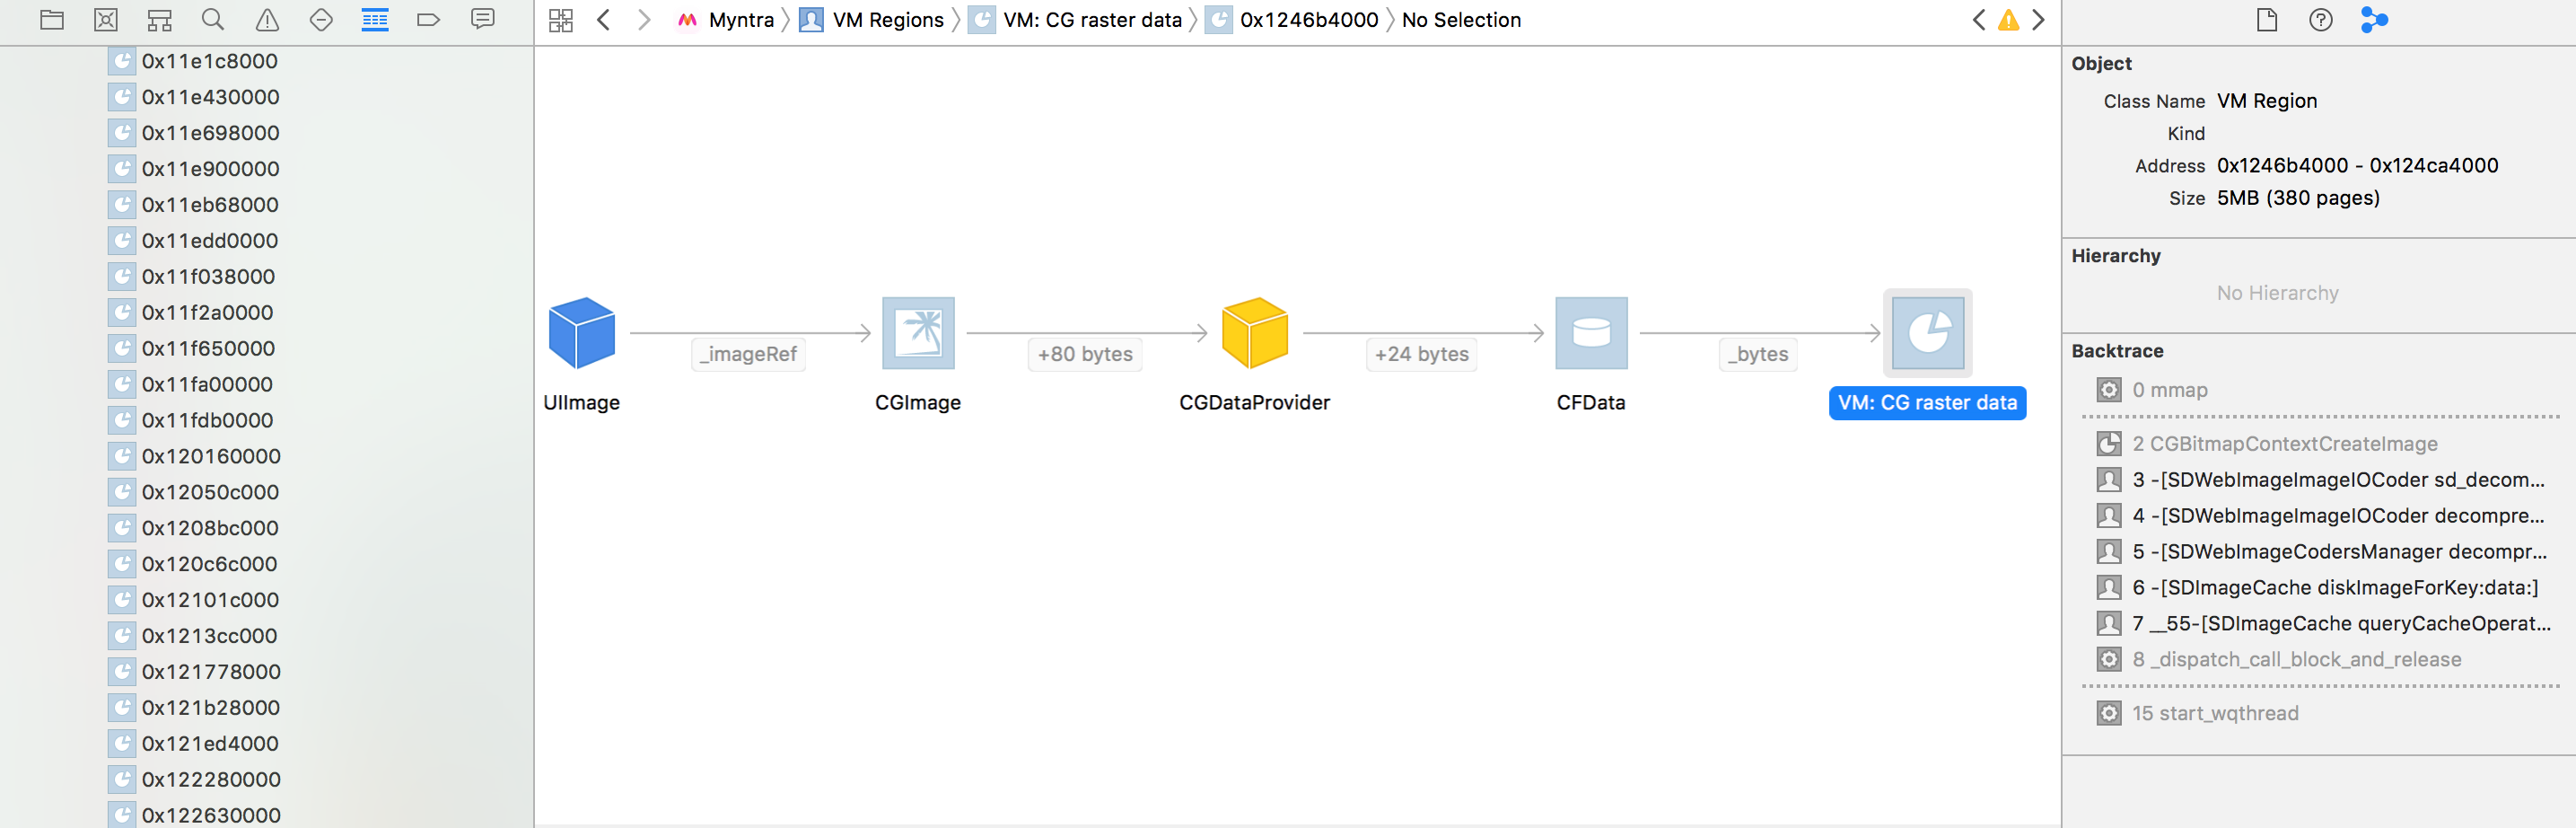
And here is a little more description about what CG raster data means. The CG raster data is just the rendered data represent UIImage, which can be directlly displayed without any extra cost in UIImageView. The opposite one is the normal UIImage which just directlly from the Image/IO or method like -[UIImage imageWithData:], which is in undecompressed format and must be copied by Core Animation before the UIImageView actual rendering it. (You may see some CA::Render::copy_image method call, which is what it need to transform the original data to CG raster data)
When you enable showDecompressImage options in SDImageCache, SDWebImageDownloader, we will try to do this stuff just in background queue to avoid this copy happened on main queue later to reduce frame rate. However, this may consume more memory. It's a trade-off. If you do not want this behavior or your memory is limit, you can try to disable it.
dreampiggy
on 24 Mar 2018
@dreampiggy : Yes, i get that point. So SDWebImage decompression part taking up MB's of data for each image is expected ? If i disable decompression, then it will affect FPS . Is there a better way to handle this situation ?
PadmaPreethi
on 24 Mar 2018
@PadmaPreethi If you do not want to lose the quality of image (Such as scale down pixels), the answer is NO. The original UIImage's contains memory bytes is a compressed format, but because the hardware GPU can only render bitmap, which is just a vector of pixels, so the CG raster data memory cost for specify image, is a FIXED size. You can only decide when to decompress it and consume the memory.
But if your collection view or table view contains little images, you can disable showDecompressImage, which may reduce memory if some of UIImage is not rendering (It stay on SDMemoryCache in a uncompressed format). We could make this as a optional value in SDWebImageOptions, however, base on the historical reason, we put the value in the cache and downloader instance level.
But if you really want to do so and do not want to affect the global cache config, you can provide a custom manager to use for specify view category, See SDWebImageExternalCustomManagerKey
dreampiggy
on 24 Mar 2018
@dreampiggy : Sorry if i'm missing something. I have a question. Will SDWbImage retains the raster data as well ? When does raster data gets deallocated from memory?
I noticed the following behavior in visual memory graph,
1) While UIImage has proper reference as expected , there are few isntances of VM raster data which has more than one reference ( one from UIImage, and another from some malloc region).
2) Also in some instances of VM raster data, intermediate components like CGImage, CFData are also referred by more than one.
PadmaPreethi
on 24 Mar 2018
That CG raster data is kept in UIImage, acutlly CGImage's internal data, See your visual debugger's screenshot...If Core Animation render you UIImage on a UIImageView, it automatically create that data and it kept alive...
dreampiggy
on 24 Mar 2018
@dreampiggy : And check this, so SDWebImage cache maintains the image in cache. That also keeps the raster data in memory which is 5MB. Does that mean, caching each image in memory will cost in MB's? Am i missing something ?
PadmaPreethi
on 24 Mar 2018
@PadmaPreethi All these screenshot in visual debugger are designed behavior if you enable shouldDecompressImage. But since we add a memory warning action to clear the memory cache, normally this should not cause crash. Or could you please provide the last crash log when the OOM occur ?
If you want to limit the memory cost, you can consider these solution.
- Disable
shouldDecompressImage - Try using
SDWebImageScaleDownLargeImages, or do your own by usingimageManager:transformDownloadedImage:withURL: - Limit the
maxMemoryCostandmaxMemoryCountLimit - Consider let your server response the small pixel image or non-alpha image, because the memory data is only related to resolution and channels.
- Maybe you can only disable memory cache using
shouldCacheImagesInMemoryif you want to render too many images at the same time.
dreampiggy
on 24 Mar 2018
Wait...Are you using animated images ? If so, maybe we should talk this from the beginning..
dreampiggy
on 24 Mar 2018
Nope, we don't use animated images.
PadmaPreethi
on 24 Mar 2018
@dreampiggy : Just a thought , will you be able to provide support for adding delegate to the memory cache to get notification when it evicts objects(which NSCache already provides) ? Will be useful to debug when we set some certain parameters like maxMemoryCountLimit or maxMemoryCost.
Currently i have set maxMemoryCountLimit and it seems to be better than before.
PadmaPreethi
on 27 Mar 2018
@PadmaPreethi This can be accomplish in 5.x using the custom memory cache in #2195 . We does not consider to add support to 4.x because this may cause some API-changes.
However, I understand your use case, currently just directly access the internal memory cache property and set a delegate :)
SDImageCache *imageCache;
NSCache *memCache = [imageCache valueForKey:@"memCache"];
if (![memCache isKindOfClass:[NSCache class]]) {
    return;
}
memCache.delegate = self;
@dreampiggy : Thanks !
PadmaPreethi
on 27 Mar 2018
same issue
 wucanqi
on 27 Mar 2018
wucanqi
on 27 Mar 2018
@dreampiggy : valueForKey:@"memCache" always returns nil.
PadmaPreethi
on 27 Mar 2018
Issue Info
Info | Value |
-------------------------|-------------------------------------|
Platform Name | ios
Platform Version |11.0
SDWebImage Version |4.0
Integration Method |cocoapods
Xcode Version |Xcode 9
Repro rate | all the time (100%)
Repro with our demo prj |NA
Demo project link | NA
Issue Description and Step
Loading image normally with SDSebImage on UITableview Cell
 dipkasyap
on 27 Jun 2018
dipkasyap
on 27 Jun 2018
@dreampiggy do you think that the 5.0 release will provide a workaround for this issue? I can't keep up with this conversation :)
 bpoplauschi
on 16 Jul 2018
bpoplauschi
on 16 Jul 2018
This issue has been automatically marked as stale because it has not had recent activity. It will be closed if no further activity occurs. If this is still an issue, please make sure it is up to date and if so, add a comment that this is still an issue to keep it open. Thank you for your contributions.
![stale[bot] picture](https://avatars.githubusercontent.com/in/1724?v=4&s=40) stale[bot]
on 14 Nov 2018
stale[bot]
on 14 Nov 2018
Related to some architecture issues, users provide some good comments for us to find issues.
 zhongwuzw
on 22 Nov 2018
zhongwuzw
on 22 Nov 2018
This issue has been automatically marked as stale because it has not had recent activity. It will be closed if no further activity occurs. If this is still an issue, please make sure it is up to date and if so, add a comment that this is still an issue to keep it open. Thank you for your contributions.
stale[bot]
on 22 Dec 2018
I got the same issue.
Look like when I am loading many WebP at the time then it will be crashed without raised memory warning. Because I see sometimes the memory was taken about 200mb but It crashed immediately without memory warning.
Could you please check this issue?
 nvduc2910
on 4 Mar 2019
nvduc2910
on 4 Mar 2019
the memory was taken about 200mb
This is the App Process memory. If the other process like Render server process, occupy too much memory, the Jetsam is still be triggered and your App get killed.
And, the memory warning is always dispatched on the main queue, so if you're alloacting large memory in the global queue outside the main queue, your app may already been killed before you receive memory warning... 😥
You can using Xcode, to check the Free Memory in memory footprint tabs, but not only about App Process.
You can also using Instruments, which have a Allocation template, to check all the memory footprint used by your App. When your app is terminated, you can check all persistent object which occupy the large memory.
dreampiggy
on 4 Mar 2019
Thank for your reply, I will check.
At the time I must load about ten webp. I think it's really large and take huge memory then it will be crashed without raise memory warning. this is bad so any solution, please
nvduc2910
on 4 Mar 2019
I got same issue. When i try load about 10->20 WebP at the same time, my app crashed and show this message: "Message from debugger: Terminated due to memory issue". Although memory just 70mb
Btw: I test on iphone 6 and I config on Appdelagate like this:
SDImageCache.shared().maxMemoryCost = 1024 * 1024 * 120
        SDImageCache.shared().config.shouldDecompressImages = false
        SDWebImageDownloader.shared().shouldDecompressImages = false
        SDImageCache.shared().config.diskCacheReadingOptions = NSData.ReadingOptions.mappedIfSafe
 Baolv
on 5 Mar 2019
Baolv
on 5 Mar 2019
Could you take a look this screen?
nvduc2910
on 5 Mar 2019
Could you take a look this screen?
This is a designed behavior.
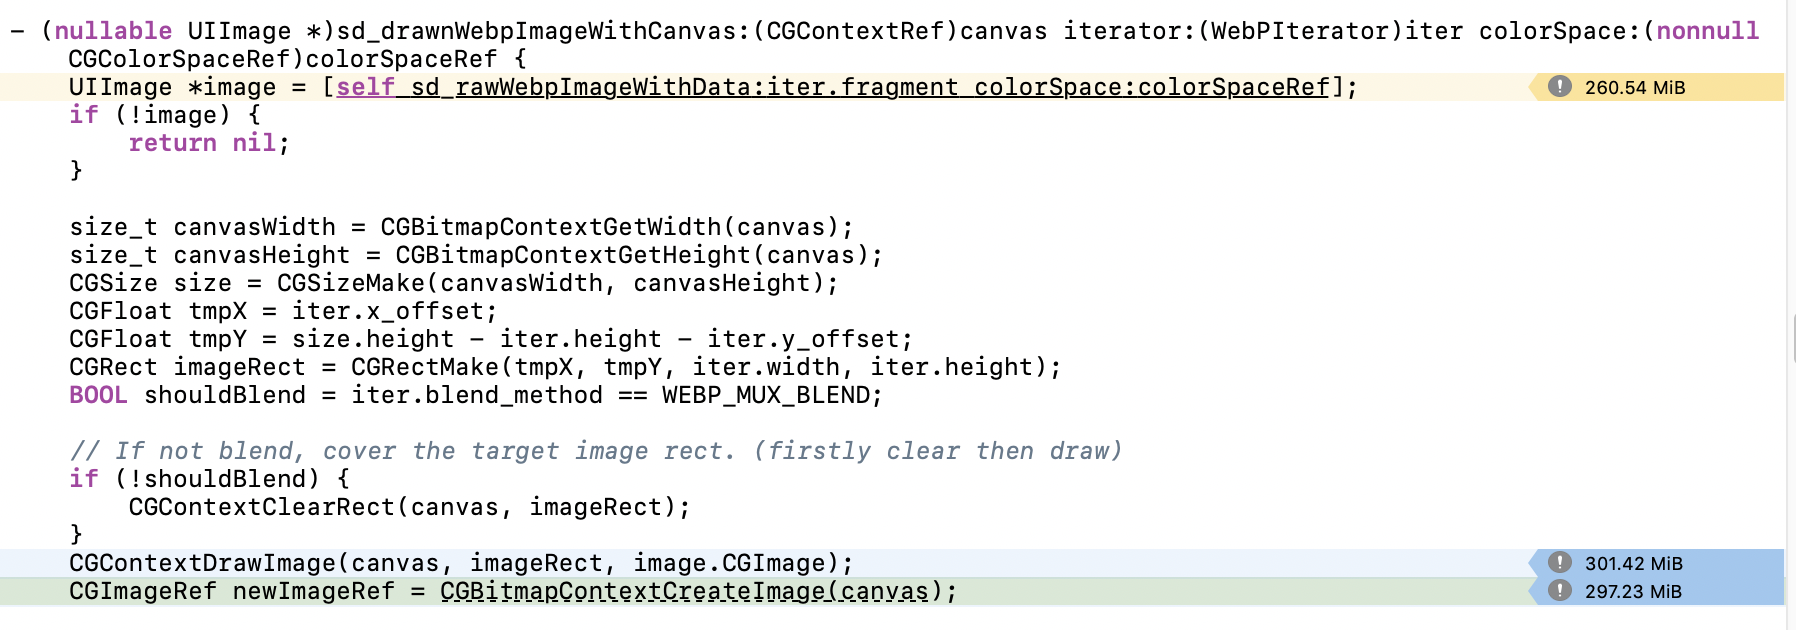
You must loading Animated WebP. And maybe your animated webp resolution is too large (260MB, assume RGBA8888, the pixel count is 68,157,440, nearly like a 8255x8255 pixels). It’s really not recommaned to load such an image. It’s better to let your inage server to do a thumb and scale before loading.
For that CGBitmapContext RAM usage. The animated webp, must keeping a canvas the same size as plaeceholder (in iOS, it’s the CGContext) to draw frames, it’s WebP standard. Maybe there are no better way to avoid this.
dreampiggy
on 5 Mar 2019
Actually, I’ve done one feature, to support the Thumb Decoding, which means even the original image is 100000x100000 pixels, the decoder can decode a scaled pixel width. It’s supported by the Image IO(Apple built-in, JPEG/PNG/HEIF only) and WebP(using libwebp). See #2560
However, many other decoder can not support this, and it need some more APIs in 5.0, I don’t know whether it’s suitable or not to add to our milestone.
I can create one MR later to let you have a try.
dreampiggy
on 5 Mar 2019

Could you take a look this screen?
This is a designed behavior.
You must loading Animated WebP. And maybe your animated webp resolution is too large (260MB, assume RGBA8888, the pixel count is 68,157,440, nearly like a 8255x8255 pixels). It’s really not recommaned to load such an image. It’s better to let your inage server to do a thumb and scale before loading.
For that CGBitmapContext RAM usage. The animated webp, must keeping a canvas the same size as plaeceholder (in iOS, it’s the CGContext) to draw frames, it’s WebP standard. Maybe there are no better way to avoid this.
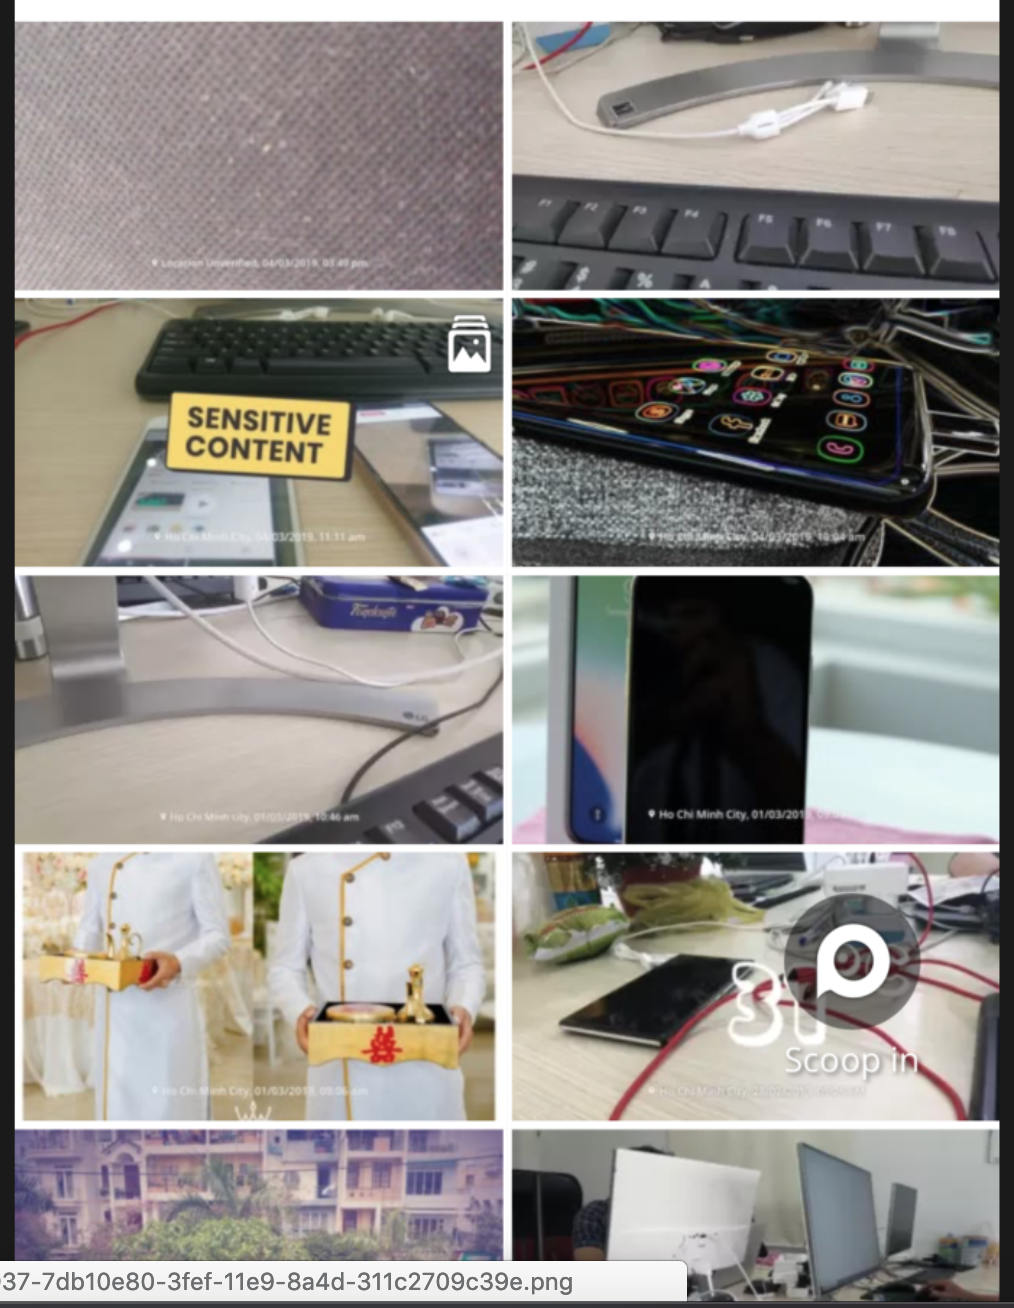
All Webp I am loading always less 2MB. but the behavior is loading many webp at the time ( about 15 - 20 webp) . The UI like this screen.
An example webp: https://storage.googleapis.com/myscoop/scoops/webp/5d5o3jqjsmkshry3ilkcew_320.webp

Even I loaded on iphone xs but it's still crash.
Please check.
nvduc2910
on 6 Mar 2019
the memory was taken about 200mb
This is the App Process memory. If the other process like Render server process, occupy too much memory, the Jetsam is still be triggered and your App get killed.
And, the memory warning is always dispatched on the main queue, so if you're alloacting large memory in the global queue outside the main queue, your app may already been killed before you receive memory warning... 😥
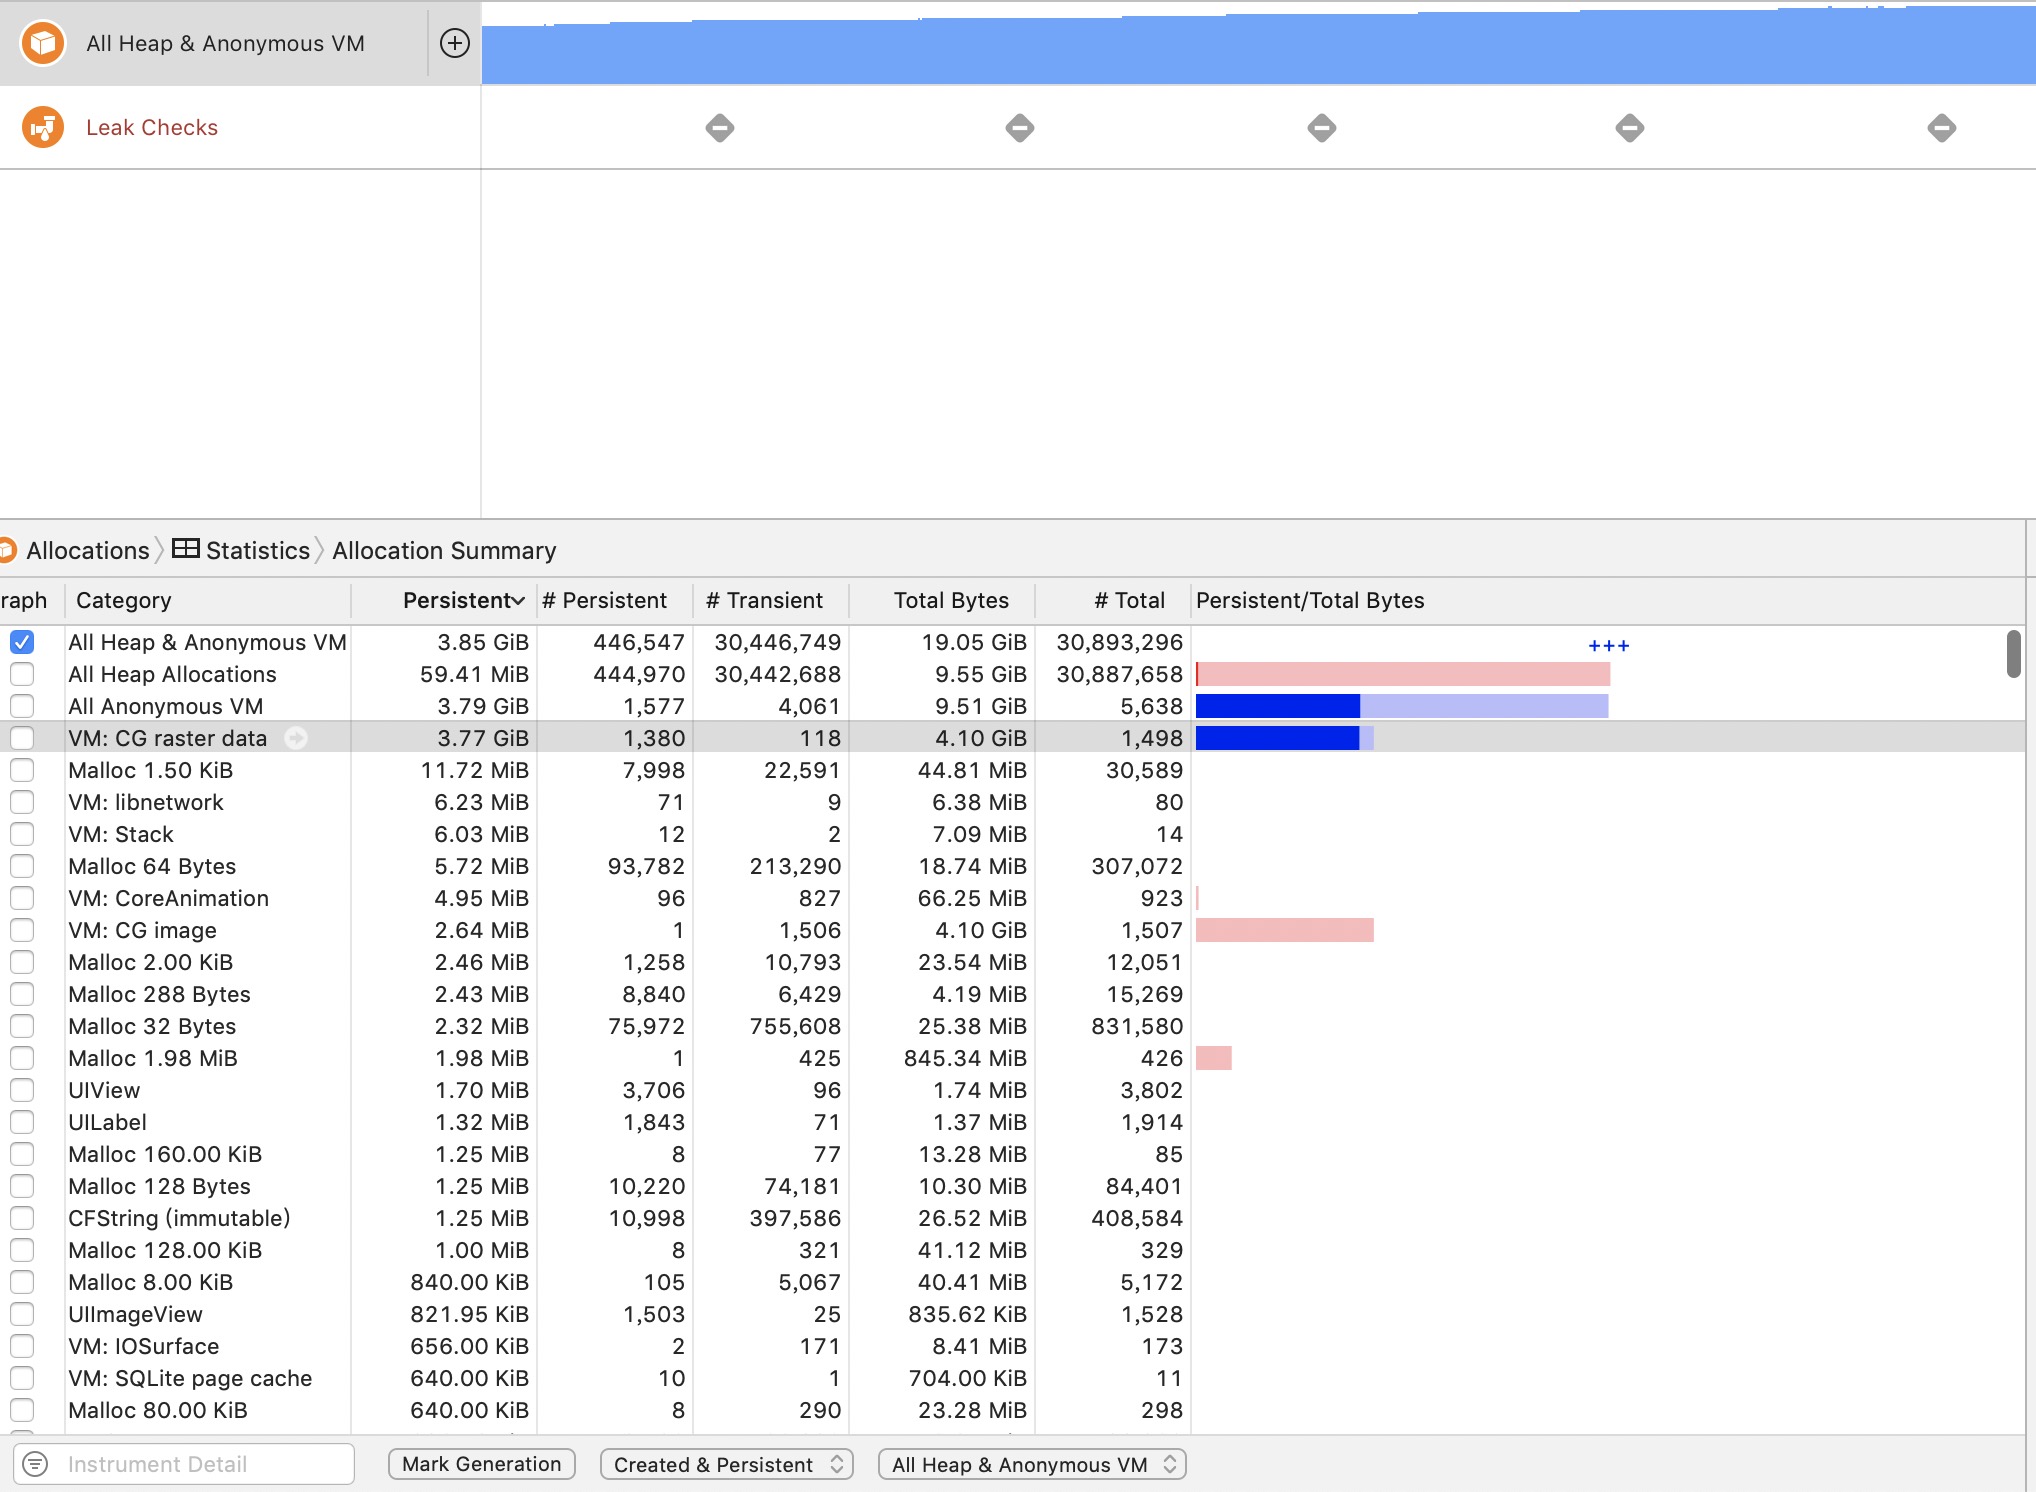
You can using Xcode, to check the
Free Memoryin memory footprint tabs, but not only aboutApp Process.You can also using Instruments, which have a
Allocationtemplate, to check all the memory footprint used by your App. When your app is terminated, you can check all persistent object which occupy the large memory.
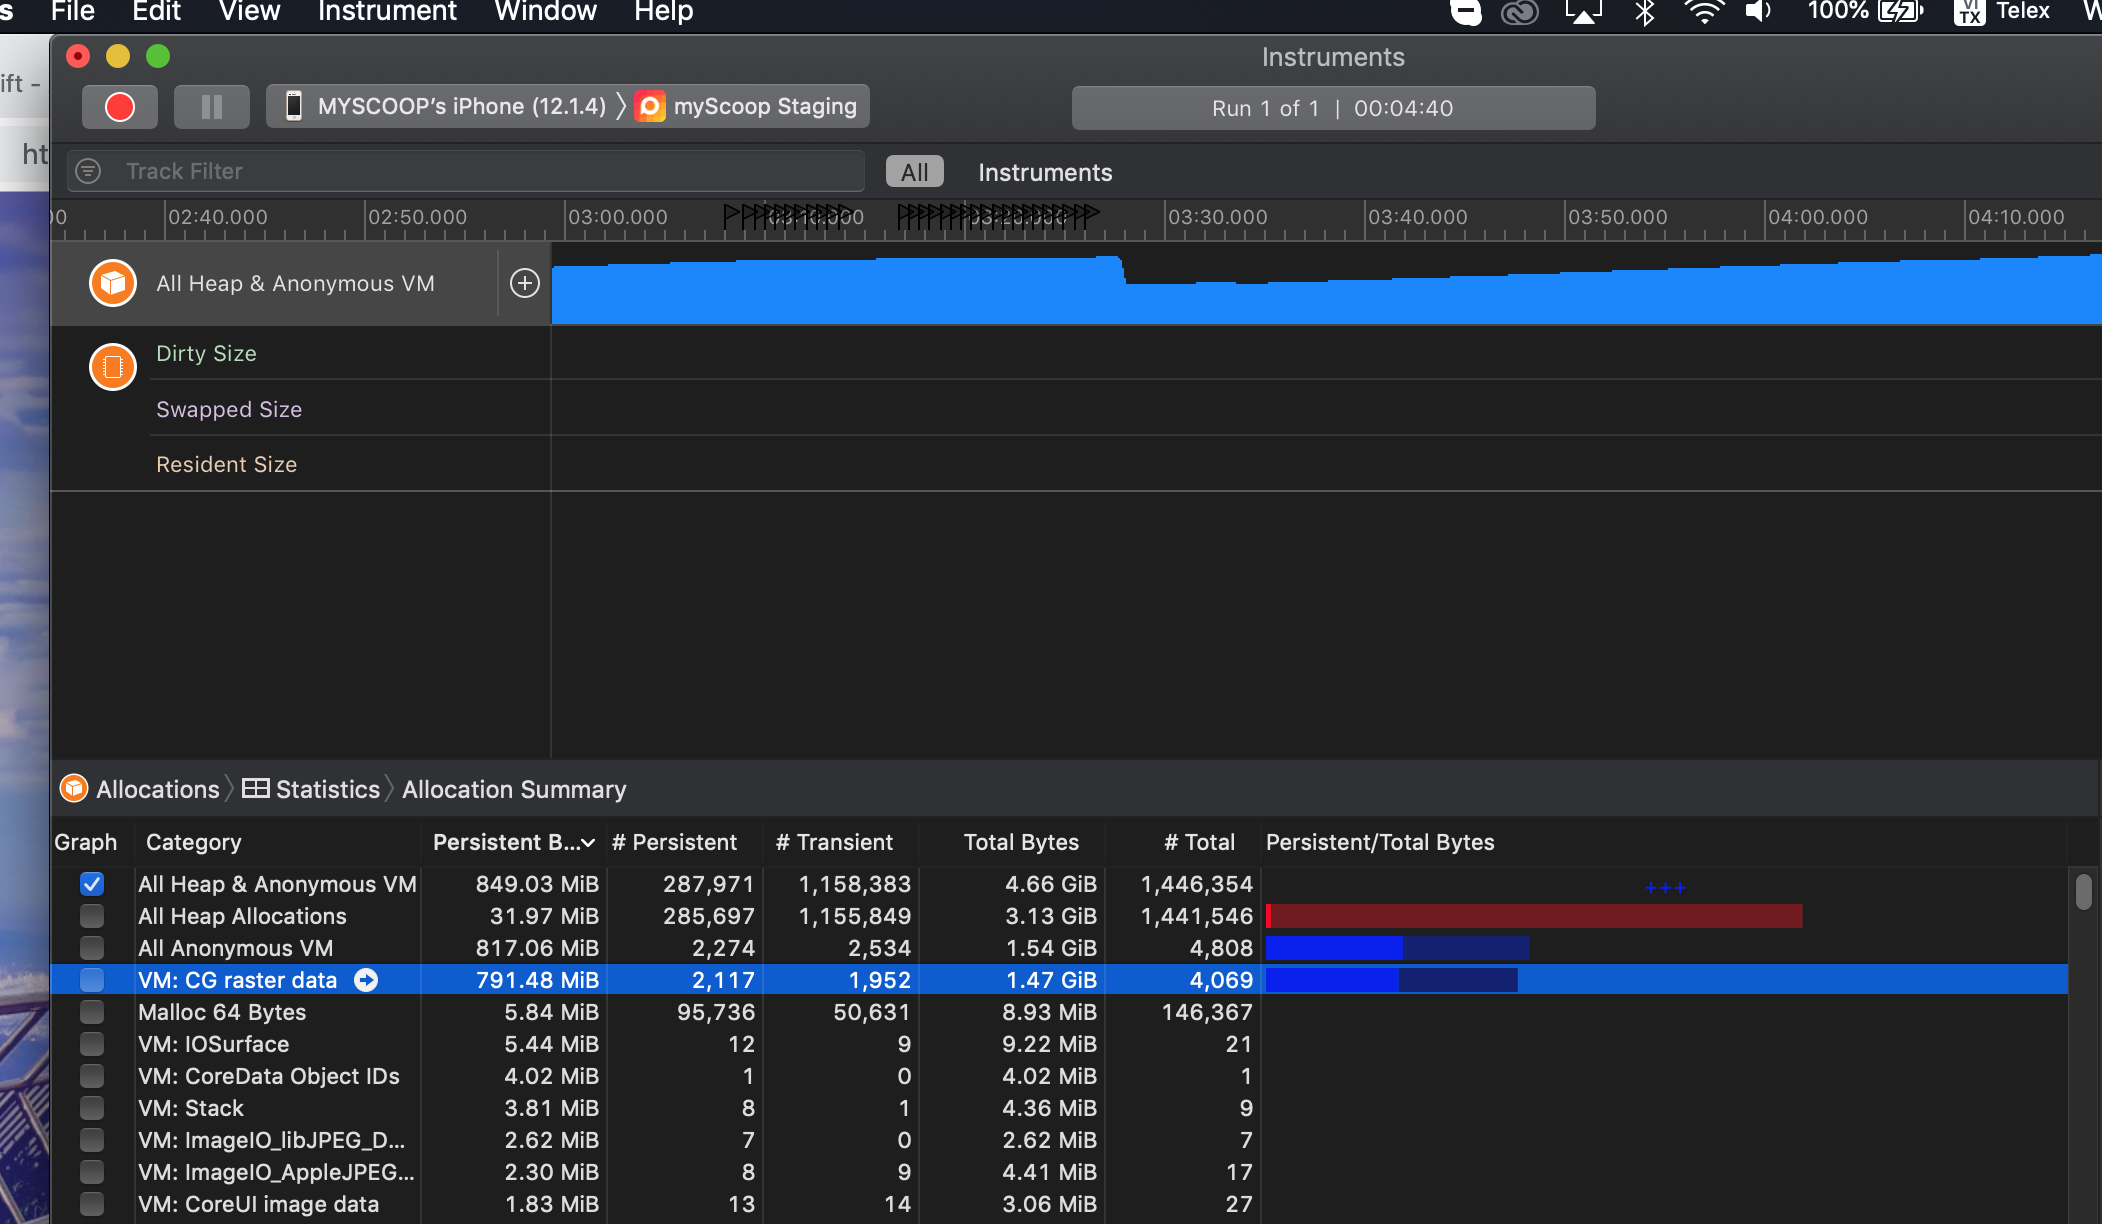
I follow by your instruction and got crashed. then I see that.
nvduc2910
on 6 Mar 2019
@nvduc2910 The size of WebP files does not count anything. Maybe you're not famaliar with What is Image Bitmap (The array contains pixels, which is used for Low-level API and Hardware to render), and what is Compressed Image Format( Like JPEG/PNG/WebP). You can have a check in https://en.wikipedia.org/wiki/Image_file_formats and https://en.wikipedia.org/wiki/Bitmap
A image bitmap memory usage = bytes per pixel * pixel count, it does not related to what the compressed image format (WebP or something) size. So if you're using image with alpha (4 channels), the bytes usage = 4 * pixel count, only related to the resolution.
Could you please have a check or show me some of your images to load ? I remember the SDImageCache have a limit for bitmap image cached in memory (SDImageCacheConfig.maxMemoryCost, it's a pixel count in 4.x but bytes size in 5.x), if the limit is hitted, the image should be purged to free up memory.
dreampiggy
on 6 Mar 2019
I think the problem here is the memory consume suddenly so it crashed without raise memory warning because I already set limit cache but it still crashes.
nvduc2910
on 6 Mar 2019
https://storage.googleapis.com/myscoop/scoops/webp/zztnkorims5k6fexsw7q_320.webp
https://storage.googleapis.com/myscoop/scoops/webp/w9yihxxutqsrjzp6drbtfw_320.webp
https://storage.googleapis.com/myscoop/scoops/webp/stcis6rctzcjafckbtfng_320.webp
https://storage.googleapis.com/myscoop/scoops/webp/mtu1mtm0otu3ms44mjg5oty_320.webp
https://storage.googleapis.com/myscoop/scoops/webp/5d5o3jqjsmkshry3ilkcew_320.webp
I share you some webp that I am loading in my application. some link like that about 15-20 webp load at the time will be crashed.
Please check.
nvduc2910
on 6 Mar 2019
This issue has been automatically marked as stale because it has not had recent activity. It will be closed if no further activity occurs. If this is still an issue, please make sure it is up to date and if so, add a comment that this is still an issue to keep it open. Thank you for your contributions.
stale[bot]
on 5 Apr 2019
swift 4.0 ios 12 Xcode 10.3
Message from debugger: Terminated due to memory issue
IGlist is pic list
sdwebcache not perform didReceiveMemoryWarning
 WXXXXH
on 10 Sep 2019
WXXXXH
on 10 Sep 2019
Related issues
 bembem1011
·
6Comments
bembem1011
·
6Comments
 paul-lavoine
·
4Comments
dreampiggy
·
3Comments
paul-lavoine
·
4Comments
dreampiggy
·
3Comments
 maundytime
·
5Comments
maundytime
·
5Comments
 Binusz
·
4Comments
Binusz
·
4Comments
Most helpful comment
Occupies memory close to 100M。
When you continue to slide the UICollectionView will crash
Animated WebP images size 200 -300 KB
Webp URL:
https://pic.huke88.com/video/cover/2017-10-19/9DDFAEC0-E926-137F-0107-82CF55D1F14F.gif!/fw/432/format/webp