Sdk: debugger breaks multiple times on an exception
This tracker is for issues related to:
- Dart VM
[√] Flutter (Channel beta, v1.7.8+hotfix.4, on Microsoft Windows [Version 10.0.17134.885], locale de-DE)
    • Flutter version 1.7.8+hotfix.4 at C:\Entwicklung\flutter
    • Framework revision 20e59316b8 (8 days ago), 2019-07-18 20:04:33 -0700
    • Engine revision fee001c93f
    • Dart version 2.4.0

[√] Android toolchain - develop for Android devices (Android SDK version 29.0.0)
    • Android SDK at C:\Users\escam\AppData\Local\Android\sdk
    • Android NDK location not configured (optional; useful for native profiling support)
    • Platform android-29, build-tools 29.0.0
    • Java binary at: C:\Program Files\Android\Android Studio\jre\bin\java
    • Java version OpenJDK Runtime Environment (build 1.8.0_152-release-1343-b01)
    • All Android licenses accepted.

[√] Android Studio (version 3.4)
    • Android Studio at C:\Program Files\Android\Android Studio
    • Flutter plugin version 36.1.1
    • Dart plugin version 183.6270
    • Java version OpenJDK Runtime Environment (build 1.8.0_152-release-1343-b01)

[√] IntelliJ IDEA Community Edition (version 2018.2)
    • IntelliJ at C:\Program Files\JetBrains\IntelliJ IDEA Community Edition 2018.2.5
    • Flutter plugin version 29.1.3
    • Dart plugin version 182.4892.25

[√] VS Code, 64-bit edition (version 1.36.1)
    • VS Code at C:\Program Files\Microsoft VS Code
    • Flutter extension version 3.2.0
I made today the observation that my debugger breaks multple times on the same exception, please see this screencast: https://www.screencast.com/t/GynUdWWO
Is it normal to get another exeption after an .timeOut()?
I disussed it already with @DanTup and he assured me it comes from the VM, see:
Definitely seems to be coming from the VM... Here's a snippet from your log where we get an exception, you press Resume, the VM tells us is resumed, then it tells us about the exception again (and it has a newer timestamp).

On Fri, Jul 26, 2019 at 5:59 PM Thomas Burkhart <[email protected]> wrote:


Dart-Code-Log-2019-06-05 18-50-48.txt

[18:52:44] [Observatory] [Info] <== {"jsonrpc":"2.0","method":"streamNotify","params":{"streamId":"Debug","event":{"type":"Event","kind":"PauseException","isolate":{"type":"@Isolate","id":"isolates\/869650738","name":"main","number":"869650738"},"timestamp":1564159964557,"topFrame":{"type":"Frame","kind":"Regular","location":{"type":"SourceLocation","script":{"type":"@Script","fixedId":true,"id":"libraries\/@560215572\/scripts\/package%3Ahttp%2Fsrc%2Fio_client.dart\/16c2f31aec0","uri":"package:http\/src\/io_client.dart","_kind":"kernel"},"tokenPos":1039},"function":{"type":"@Function","fixedId":true,"id":"classes\/3840\/closures\/394","name":"async_op","_vmName":":async_op","owner":{"type":"@Function","fixedId":true,"id":"classes\/3840\/functions\/send","name":"send","owner":{"type":"@Class","fixedId":true,"id":"classes\/3840","name":"IOClient"},"_kind":"RegularFunction","static":false,"const":false,"_intrinsic":false,"_native":false},"_kind":"ClosureFunction","static":false,"const":false,"_intrinsic":false,"_native":false},"code":{"type":"@Code","fixedId":true,"id":"code\/3a4ea860-7bd819ec39e0","name":"[Unoptimized] IOClient.send","_vmName":"[Unoptimized] async_op","kind":"Dart","_optimized":false,"_intrinsic":false,"_native":false},"vars":[{"type":"BoundVariable","name":"request","value":{"type":"@Instance","class":{"type":"@Class","fixedId":true,"id":"classes\/3847","name":"Request"},"kind":"PlainInstance","id":"objects\/2545"},"declarationTokenPos":952,"scopeStartTokenPos":952,"scopeEndTokenPos":2383},{"type":"BoundVariable","name":"this","value":{"type":"@Instance","class":{"type":"@Class","fixedId":true,"id":"classes\/3840","name":"IOClient"},"kind":"PlainInstance","id":"objects\/2546"},"declarationTokenPos":-1,"scopeStartTokenPos":952,"scopeEndTokenPos":2383},{"type":"BoundVariable","name":"stream","value":{"type":"@Instance","class":{"type":"@Class","fixedId":true,"id":"classes\/3835","name":"ByteStream"},"kind":"PlainInstance","id":"objects\/2547"},"declarationTokenPos":977,"scopeStartTok…
[18:52:47] [Observatory] [Info] ==> {"id":"774","method":"resume","params":{"isolateId":"isolates/869650738"}}
[18:52:47] [Observatory] [Info] <== {"jsonrpc":"2.0", "result":{"type":"Success"},"id":"774"}
[18:52:47] [Observatory] [Info] <== {"jsonrpc":"2.0","method":"streamNotify","params":{"streamId":"Debug","event":{"type":"Event","kind":"Resume","isolate":{"type":"@Isolate","id":"isolates\/869650738","name":"main","number":"869650738"},"timestamp":1564159967774,"topFrame":{"type":"Frame","kind":"Regular","location":{"type":"SourceLocation","script":{"type":"@Script","fixedId":true,"id":"libraries\/@560215572\/scripts\/package%3Ahttp%2Fsrc%2Fio_client.dart\/16c2f31aec0","uri":"package:http\/src\/io_client.dart","_kind":"kernel"},"tokenPos":1039},"function":{"type":"@Function","fixedId":true,"id":"classes\/3840\/closures\/394","name":"async_op","_vmName":":async_op","owner":{"type":"@Function","fixedId":true,"id":"classes\/3840\/functions\/send","name":"send","owner":{"type":"@Class","fixedId":true,"id":"classes\/3840","name":"IOClient"},"_kind":"RegularFunction","static":false,"const":false,"_intrinsic":false,"_native":false},"_kind":"ClosureFunction","static":false,"const":false,"_intrinsic":false,"_native":false},"code":{"type":"@Code","fixedId":true,"id":"code\/3a4ea860-7bd819ec39e0","name":"[Unoptimized] IOClient.send","_vmName":"[Unoptimized] async_op","kind":"Dart","_optimized":false,"_intrinsic":false,"_native":false},"vars":[{"type":"BoundVariable","name":"request","value":{"type":"@Instance","class":{"type":"@Class","fixedId":true,"id":"classes\/3847","name":"Request"},"kind":"PlainInstance","id":"objects\/2752"},"declarationTokenPos":952,"scopeStartTokenPos":952,"scopeEndTokenPos":2383},{"type":"BoundVariable","name":"this","value":{"type":"@Instance","class":{"type":"@Class","fixedId":true,"id":"classes\/3840","name":"IOClient"},"kind":"PlainInstance","id":"objects\/2753"},"declarationTokenPos":-1,"scopeStartTokenPos":952,"scopeEndTokenPos":2383},{"type":"BoundVariable","name":"stream","value":{"type":"@Instance","class":{"type":"@Class","fixedId":true,"id":"classes\/3835","name":"ByteStream"},"kind":"PlainInstance","id":"objects\/2754"},"declarationTokenPos":977,"scopeStartTokenPos":9…
[18:52:47] [Observatory] [Info] <== {"jsonrpc":"2.0","method":"streamNotify","params":{"streamId":"Debug","event":{"type":"Event","kind":"PauseException","isolate":{"type":"@Isolate","id":"isolates\/869650738","name":"main","number":"869650738"},"timestamp":1564159967778,"topFrame":{"type":"Frame","kind":"Regular","location":{"type":"SourceLocation","script":{"type":"@Script","fixedId":true,"id":"libraries\/@560215572\/scripts\/package%3Ahttp%2Fsrc%2Fio_client.dart\/16c2f31aec0","uri":"package:http\/src\/io_client.dart","_kind":"kernel"},"tokenPos":-1},"function":{"type":"@Function","fixedId":true,"id":"classes\/3840\/closures\/394","name":"async_op","_vmName":":async_op","owner":{"type":"@Function","fixedId":true,"id":"classes\/3840\/functions\/send","name":"send","owner":{"type":"@Class","fixedId":true,"id":"classes\/3840","name":"IOClient"},"_kind":"RegularFunction","static":false,"const":false,"_intrinsic":false,"_native":false},"_kind":"ClosureFunction","static":false,"const":false,"_intrinsic":false,"_native":false},"code":{"type":"@Code","fixedId":true,"id":"code\/3a4ea860-7bd819ec39e0","name":"[Unoptimized] IOClient.send","_vmName":"[Unoptimized] async_op","kind":"Dart","_optimized":false,"_intrinsic":false,"_native":false},"vars":[],"index":0},"exception":{"type":"@Instance","class":{"type":"@Class","fixedId":true,"id":"classes\/939","name":"SocketException"},"kind":"PlainInstance","id":"objects\/2755"}}}}
 escamoteur
All 23 comments
From the log, looks like exceptions VM paused on are not exactly the same, even they carry the same information. It is probably because the exception has been thrown again.
Here is a place, OnError handler throws the error again, which trigger exception handler and debugger will pause on it.
https://github.com/dart-lang/sdk/blob/08205fd62f6afc3cda34005635d08e56cce0e439/sdk/lib/_http/http_impl.dart#L2025
Can you share more info like stacktrace when debugger pauses? Or a sample program I can test with.
 zichangg
on 7 Aug 2019
zichangg
on 7 Aug 2019
Aha! The top frame of each stack is different. So I think this might be a cause of the debugger pausing at different locations as the exception passes through code (possibly related to it breaking on exceptions that will be handled, but look uncaught - for ex. because of .catch()).
It's not obvious this is happening because by default we make VS Code break on the users code (not inside external libraries), so although the stack will differ slightly, they all have the same entry point from the users code.
Changing the VS Code default to debug in external libraries would make it more obvious what's happening, but it wouldn't resolve having to break/step repeatedly as an exception moves up the stack.
@escamoteur to test this - you could try enabling dart.debugExternalLibraries and dart.debugSdkLibraries and then repro - I suspect you'll end up breaking at different locations in the http library.
[
    {
    "script": {
        "uri": "package:http\/src\/io_client.dart"
    },
    "tokenPos": 1039
},
{
    "script": {
        "uri": "package:http\/src\/io_client.dart"
    },
    "tokenPos": -1
},
{
    "script": {
        "uri": "package:http\/src\/base_client.dart"
    },
    "tokenPos": 7118
},
{
    "script": {
        "uri": "package:http\/http.dart"
    },
    "tokenPos": 7181
},
{
    "script": {
        "uri": "package:http\/http.dart"
    },
    "tokenPos": -1
}
]
 DanTup
on 8 Aug 2019
DanTup
on 8 Aug 2019
Will do when I m back from vacation
escamoteur
on 8 Aug 2019
based on the comment by @DanTup above this looks like an IDE issue, so directing issue to @DanTup
 a-siva
on 13 Aug 2019
a-siva
on 13 Aug 2019
@a-siva @ZichangG I think there are two issues here:
- The IDE focuses the first "user stack frame" when an exception occurs, which masks that these breaks are actually at different locations
- A single exception causes the debugger to break multiple times (due to
catch()- similar to the issue we've discussed recently)
I don't think fixing 1 solves the issue - it just makes it confusing. And generally I think 1 is good default behaviour - it just makes 2 more confusing.
Is there anything we can do about 2? I suspect not easily (since I think it's the same break-on-caught-exception confusion), but it results in a confusing experience (especially since the SDK is using .catch() a lot so it keeps triggering this).
DanTup
on 19 Aug 2019
Is there anything we can do about 2? I suspect not easily (since I think it's the same break-on-caught-exception confusion)
Essentially the same problem.
For this issue, exceptions are basically rethrown inside catch() so they contains the same errors. They come out in a row.
I am wondering whether it is feasible that IDE can pause on first appearance of exception if exceptions have the same entry point from the users code and same error messages?
zichangg
on 19 Aug 2019
I am wondering whether it is feasible that IDE can pause on first appearance of exception if exceptions have the same entry point from the users code and same error messages?
It might be possible we could auto-resume if the exception is the same as the previous, but it could be fragile. I think it'd need some testing.
That would need doing in each editor though, so I don't think it's an ideal solution. Given the limitations of using catch would it be better if the SDK favoured try/catch and maybe migrated to it over time? Even if we auto-resumed, the user here isn't expecting to see any exception since it was "caught", so the ideal solution would be to avoid any breaking at all.
DanTup
on 19 Aug 2019
Given the limitations of using catch would it be better if the SDK favoured try/catch and maybe migrated to it over time?
In terms of exception handling, it is true. Since we can't handle future machinery. But I'm not sure whether this brings up some other side effects.
zichangg
on 19 Aug 2019
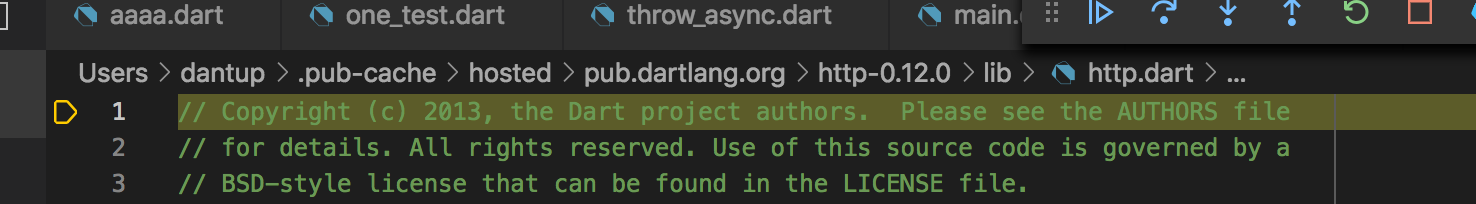
@ZichangG I did some more testing of this in VS Code by setting debugExternalLibraries: true and debugSdkLibraries: true to avoid focusing the users stack frames, however it's still not clear why we're breaking multiple times - since we don't seem to get valid source locations for some.
Here's the code:
import 'package:http/http.dart' as http;
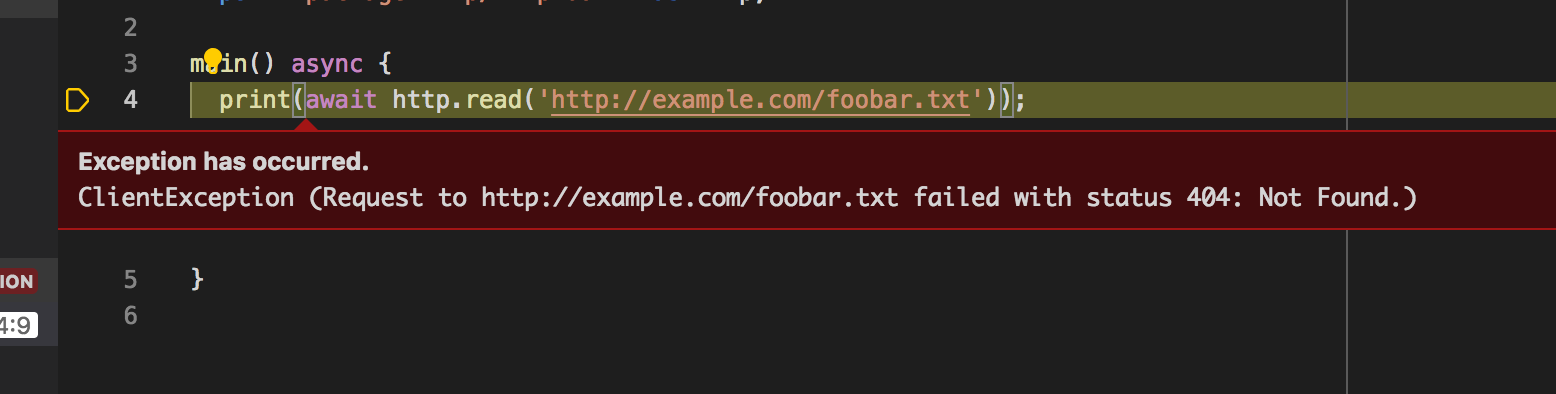
main() async {
print(await http.read('http://example.com/foobar.txt'));
}
I'm setting "Break on unhandled exceptions". When I run, it first breaks here:
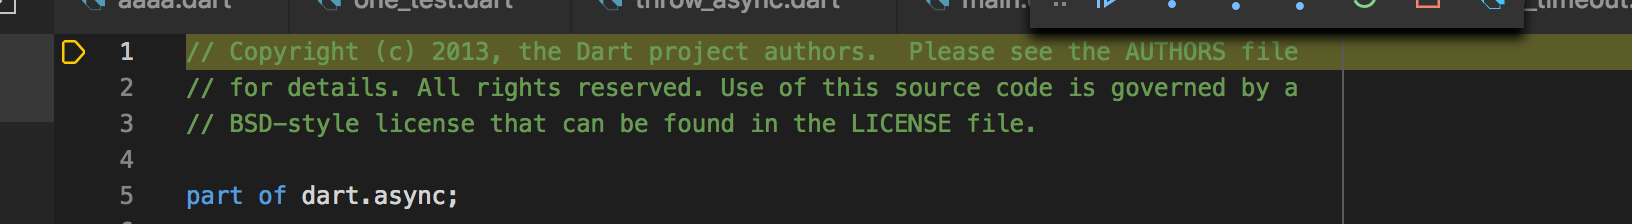
Then I click continue and it breaks here:
(I think focusing the first line is what happens when we don't have a valid tokenPos)
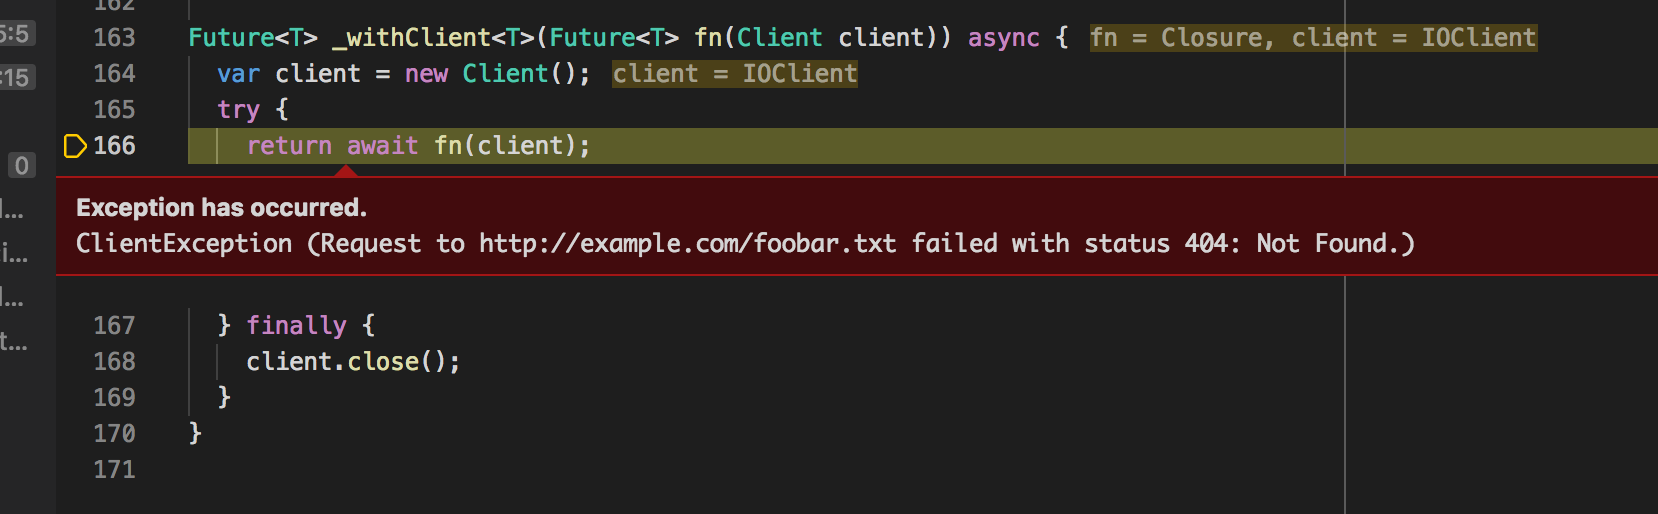
Then I click continue and it breaks here (which is the place I was actually expect/want):
Then I click continue and it goes back here:
Finally, I click continue and it stops breaking, and writes the unhandled exception to stdout.
Because of the async stack frame, it's hard to examine where it's really going, but I searched the HTTP package and could only find .catchError() and it looked like test code (I suspect there may be SDK code involved, but I don't seem to be able to get to it).
@lrhn if this is (as suspected) caused by use of .catchError() in the SDK/packages, would migrating them long-term to use try/catch and having a preference for try/catch over .then()/.catchError() for new code be a) possible (I think all code could be rewritten and preserve behaviour, but I'm not certain?) and b) feasible? This has come up quite a few times recently and is quite confusing to users.
I'm considering whether we should make some changes in VS Code (like not breaking on any exceptions by default, renaming "pause on caught errors", changing default behaviour to break inside SDKs), but none of them are ideal, so if it's possible the causes of some of these "false breaks" I think that'd be much better for the end user.
DanTup
on 26 Aug 2019
In the sample, I also used something that failed for simplicity, but the original issue here is where the user code has already continued, for example:
main() async {
  print(await http
      .read('https://www.google.co.uk:81')
      .timeout(Duration(seconds: 1), onTimeout: () => "Timed out!"));
}
Here the user breaks 4 times, but expected 0 times because they wanted to only break on uncaught exceptions.
DanTup
on 26 Aug 2019
@DanTup You can pass "--trace-debugger-stacktrace" to vm to print out Stacktrace for exceptions. For this case, perhaps observatory is better since it shows the function body of closures that having invalid line number.
Here are top frames for all 4 exceptions:
top frame:[ Frame pc(0x7ffff212eeca code offset:0x6aa) fp(0x7ffff1cbd3c8) sp(0x7ffff1cbd338)
        function = :async_op
        url = package:http/http.dart
        line = 166
        context = Context: null
        context level = 1 ]

top frame:[ Frame pc(0x7ffff212ef78 code offset:0x758) fp(0x7ffff1cbd3c8) sp(0x7ffff1cbd338)
        function = :async_op
        url = package:http/http.dart
        line = -1
        context = Context: null
        context level = 1 ]

top frame:[ Frame pc(0x7ffff212dd4a code offset:0x58a) fp(0x7ffff1cbcfd0) sp(0x7ffff1cbcf48)
        function = :async_op
        url = file:///usr/local/google/home/zichangguo/dart-sdk/sdk/Junk/test.dart
        line = 7
        context = Context: null
        context level = 0 ]

top frame:[ Frame pc(0x7ffff001707d code offset:0x2bd) fp(0x7ffff1cbd750) sp(0x7ffff1cbd710)
        function = _startMicrotaskLoop@8048458
        url = dart:async/schedule_microtask.dart
        line = -1
        context = Context: null
        context level = -1 ]
If I remember correctly, try finally block(without catch block) will throw the exception again. That explains why exceptions are thrown multiple times.
For example, second exception comes from this finally block, which is a closure doesn't have valid token position.
var client = new Client();
  try {
    return await fn(client);
  } finally {
    client.close();
  }
The fourth exception:
  try {
    // Moved to separate function because try-finally prevents
    // good optimization.
    _microtaskLoop();
  } finally {
    _lastPriorityCallback = null;
    _isInCallbackLoop = false;
    if (_nextCallback != null) {
      _AsyncRun._scheduleImmediate(_startMicrotaskLoop);
    }
  }
For example, second exception comes from this finally block, which is a closure doesn't have valid token position.
I'm not very familiar with the details here, so sorry if this is a silly question, but why isn't there a valid token position? If we know the code is in a particular file, why don't we know where about in the file it is? It's a strange experience for the debugger to break, open the correct file, but highlight line 1. In VS Code, that ends up being worse than when there's no source code at all - because in that case VS Code would move up to the next stack frame automatically.
DanTup
on 3 Sep 2019
If I remember correctly, try finally block(without catch block) will throw the exception again. That explains why exceptions are thrown multiple times.
This also seems really unfortunate. Is there any way to prevent the debugger from pausing in this case? (if there isn't, is it a reasonable request for a feature? the debugger breaking frequently and users being shown exceptions that they don't need to fix is very confusing).
DanTup
on 3 Sep 2019
why isn't there a valid token position?
Because "throw" in the finally is not an explicit throw which does not have a valid token position. I think one way to improve user experience is to point to the function instead of top of the file when line number is not valid. That's what observatory is doing. Otherwise, having yellow triangle pointing to the top of the file is confusing.
zichangg
on 11 Sep 2019
Is there any way to prevent the debugger from pausing in this case?
I think debugger is correct in this case. It is supposed to pause on unhandled exception. The problem for this case is that no catch block is provided to handle. For unpausing, one easy solution is to check whether exception is the same as the previous one. This goes back to our old discussion.
It might be possible we could auto-resume if the exception is the same as the previous, but it could be fragile. I think it'd need some testing.
Maybe we can do a bit more by ignoring exceptions not in user written script. What do you think? @DanTup
zichangg
on 12 Sep 2019
Because "throw" in the finally is not an explicit throw which does not have a valid token position. I think one way to improve user experience is to point to the function instead of top of the file when line number is not valid. That's what observatory is doing.
That sounds like an improvement to me, but it would be even better to point closer (like the try or finally block?).
Maybe we can do a bit more by ignoring exceptions not in user written script. What do you think? @DanTup
This seems slightly related to https://github.com/dart-lang/sdk/issues/36914. We have a switch in VS Code that lets users choose whether SDK libraries should be debuggable or not. It's not totally clear exactly what this should affect (since the spec says it will prevent breakpoints, but that doesn't seem to be the case).
In C#, when I set the equiv setting (debug "Just My Code") if an exception occurred in SDK code, it would only break once the exception made it up to the user code. This is somewhat what we achieve in VS Code today by automatically jumping up the call stack to the users code - however we end up with multiple breaks as a result (the advantage is that the user can jump into the SDK code to examine state, which wasn't possible the C# way, but if you've chosen to debug only your own code, I don't think that's a poor trade-off).
So how about that? If a library is marked as non-debuggable, exceptions to not break the debugger (but they would break as they bubble up and hit a library that is marked as debuggable)? Doing it that way seems logical, and the user can easily change the behaviour from the IDE.
(note: I don't know how IntelliJ/Android Studio work here - I think they have all libraries debuggable by default - which is different to VS Code, but I'm not certain).
DanTup
on 16 Sep 2019
We have a switch in VS Code that lets users choose whether SDK libraries should be debuggable or not. It's not totally clear exactly what this should affect (since the spec says it will prevent breakpoints, but that doesn't seem to be the case).
I can take a look later if no one is working on that.
If a library is marked as non-debuggable, exceptions to not break the debugger (but they would break as they bubble up and hit a library that is marked as debuggable)? Doing it that way seems logical, and the user can easily change the behaviour from the IDE.
Sounds good. I'm not sure how hard it is, but I assume you can auto resume non-debuggable stops on IDE side? Or do you expect to use setLibraryDebuggable?
How about this? Let me look at setLibraryDebuggable first and leave this open. If that perfectly matches what we want (they would break as they bubble up and hit a library that is marked as debuggable), we can use that flag. If not, let us come back to this issue and figure out another way.
zichangg
on 17 Sep 2019
I'm not sure how hard it is, but I assume you can auto resume non-debuggable stops on IDE side? Or do you expect to use setLibraryDebuggable?
I was hoping it could be rolled into setLibraryDebuggable (though I don't know if that's possible or if there are implications). Auto-resuming on the client side seems risky to me - especially as we want to move to supporting multiple concurrent debuggers being attached (eg. VS Code + DevTools), so the less behaviour like this in the editor, the less likely they will affect each other (for example if two debuggers both tried to auto-resume, it would likely resume past the intended location).
Thanks!
DanTup
on 18 Sep 2019
An update for this issue.
Instead of ignoring all exceptions, a better way to handle this issue is to suppress exception on implicit throw inside finally block. It makes sense to pause on exception for the first time but implicit throw throws the same exception again, which is a duplicate.
zichangg
on 24 Sep 2019
@jensjoha Do you know how to distinguish implicit "throw" from regular user-written "throw"? I think implicit throw doesn't have a valid token position. Can I check for invalid token positions? Is that enough? At the time exception was thrown, ignoring if it comes from an implicit throw.
zichangg
on 25 Sep 2019
@ZichangG from what I understand about this discussion the implicit throw in the finally is a VM-thing so I have no special insight...
 jensjoha
on 30 Sep 2019
jensjoha
on 30 Sep 2019
Instead of ignoring all exceptions, a better way to handle this issue is to suppress exception on implicit throw inside finally block. It makes sense to pause on exception for the first time but implicit throw throws the same exception again, which is a duplicate.
On the surface, this sounds like a great change to me 👍 I don't know the internal details though (but as a user, it's how I'd expect things to work, and how I think at least some other languages I've used work).
DanTup
on 30 Sep 2019
I'll close the issue since the fix has been landed.
zichangg
on 1 Nov 2019
Related issues
 emilniklas
·
3Comments
emilniklas
·
3Comments
 nex3
·
3Comments
nex3
·
3Comments
 55555Mohit55555
·
3Comments
55555Mohit55555
·
3Comments
 Hixie
·
3Comments
Hixie
·
3Comments
 ranquild
·
3Comments
ranquild
·
3Comments