Scylla: cassandra-stress starts to timeout and fail after ~20min with GCE local disks
Installation details
Scylla version (or git commit hash): 4.1.7 (4.1.7-0.20200918.2251a1c577)
Cluster size: 4
OS (RHEL/CentOS/Ubuntu/AWS AMI): Centos8/Ubuntu1804
Hardware details (for performance issues)
Platform (physical/VM/cloud instance type/docker): GCE (n1-highmem-16)
Hardware: sockets= cores= hyperthreading= memory=
Disks: (SSD/HDD, count) Nvme 8/6 disks
Summary
Trying to fill up a GCE setup with 1Tb of data, for testing backup to Google Storage.
This is the stress command we are using:
cassandra-stress write cl=QUORUM n=1100200300 -schema 'replication(factor=3) compaction(strategy=LeveledCompactionStrategy)' -port jmx=6868 -mode cql3 native -rate threads=150 -col 'size=FIXED(200) n=FIXED(5)' -pop seq=1..1100200300
After ~20min we start getting timeouts that fails the load with the following errors:
com.datastax.driver.core.exceptions.WriteTimeoutException: Cassandra timeout during SIMPLE write query at consistency QUORUM (2 replica were required but only 1 acknowledged the write)
Logs (Centos8)
- db-cluster - https://cloudius-jenkins-test.s3.amazonaws.com/519a5474-7368-4a4d-8ac2-485540923422/20201005_113703/db-cluster-519a5474.zip
- loader-set - https://cloudius-jenkins-test.s3.amazonaws.com/519a5474-7368-4a4d-8ac2-485540923422/20201005_113703/loader-set-519a5474.zip
- monitor-set - https://cloudius-jenkins-test.s3.amazonaws.com/519a5474-7368-4a4d-8ac2-485540923422/20201005_113703/monitor-set-519a5474.zip
- sct-runner - https://cloudius-jenkins-test.s3.amazonaws.com/519a5474-7368-4a4d-8ac2-485540923422/20201005_113703/sct-runner-519a5474.zip
- monitor -
hydra investigate show-monitor 519a5474-7368-4a4d-8ac2-48554092342
Further thing we tried
we tried this also with ubuntu1804, suspecting maybe it's a kernel related issue, but got the similar results
talking with @tarzanek, we looking into the io_properties.yaml, he suggested to lower it down, to let scylla throttle it a bit
this is the output of iotune, while measuring:
disks:
  - mountpoint: /var/lib/scylla
    read_iops: 721717
    read_bandwidth: 2949972224
    write_iops: 400594
    write_bandwidth: 1504807040
and this is the io_properties.yaml we overwrite it with: (the parameter that are not part of master, which are calculated base on number of local disks)
disks:
  - mountpoint: /var/lib/scylla
    read_iops: 680000
    read_bandwidth: 2778726400
    write_iops: 360000
    write_bandwidth: 1468006400
After applying the suggested io_properties.yaml, we are still facing those issues
monitor -http://35.196.159.20:3000/d/Z3dCVz5Mk/scylla-per-server-metrics-nemesis-master?orgId=1&from=1601970238340&to=1601972849329
 fruch
fruch
All 89 comments
so we have the reason, the nodes run with mq and share cpus with OS, so NIC traffic and SIs interfere
btw. neither of the tuning runs by default:
Do you want to enable Network Interface Card (NIC) and disk(s) optimization?
Yes - optimize the NIC queue and disks settings. Selecting Yes greatly improves performance. No - skip this step.
[yes/NO]
Do you want to set the CPU scaling governor to Performance level on boot?
Yes - sets the CPU scaling governor to performance level. No - skip this step.
[YES/no]
This computer doesn't supported CPU scaling configuration.
 tarzanek
on 6 Oct 2020
tarzanek
on 6 Oct 2020
so we have the reason, the nodes run with mq and share cpus with OS, so NIC traffic and SIs interfere
btw. neither of the tuning runs by default:
Do you want to enable Network Interface Card (NIC) and disk(s) optimization?
Yes - optimize the NIC queue and disks settings. Selecting Yes greatly improves performance. No - skip this step.
[yes/NO]
Do you want to set the CPU scaling governor to Performance level on boot? Yes - sets the CPU scaling governor to performance level. No - skip this step. [YES/no] This computer doesn't supported CPU scaling configuration.
--setup-nic-and-disks seem like we need to add this to scylla_setup we didn't passing that in SCT so far.
we'll try again
as for CPU scaling, I don't seem to be able to turn it on, I'm not even sure we can do that on GCE, didn't found any information regarding that.
fruch
on 6 Oct 2020
talking offline with @vladzcloudius
he mentioned this issue:
https://github.com/scylladb/seastar/issues/729
and this rule of thumb, base on the number of cpu might work better:
0-4: mq
5-8: sq
9-: sq_split
I'll give it a try too
fruch
on 6 Oct 2020
hmm and looking at my comment I wanted to say it's about
cpuset, not cpuscaling governor,
so basically /etc/scylla.d/cpuset.conf
is empty
while for 16 vcpus it should set correct pairs
https://github.com/scylladb/scylla/blob/master/dist/common/scripts/scylla_cpuset_setup
is called from
https://github.com/scylladb/scylla/blob/master/dist/common/scripts/scylla_sysconfig_setup#L81
so the fix needs to happen in perftune while called for --get-cpu-mask
https://github.com/scylladb/seastar/blob/master/scripts/perftune.py#L1355
tarzanek
on 6 Oct 2020
that command on your GCP does:
# /opt/scylladb/scripts/perftune.py --tune net --nic eth0 --get-cpu-mask
Traceback (most recent call last):
  File "/opt/scylladb/scripts/libexec/perftune.py", line 1326, in <module>
    args.cpu_mask = run_hwloc_calc(['all'])
  File "/opt/scylladb/scripts/libexec/perftune.py", line 58, in run_hwloc_calc
    return run_read_only_command(['hwloc-calc'] + prog_args).rstrip()
  File "/opt/scylladb/scripts/libexec/perftune.py", line 46, in run_read_only_command
    return __run_one_command(prog_args, stderr=stderr, check=check)
  File "/opt/scylladb/scripts/libexec/perftune.py", line 30, in __run_one_command
    proc = subprocess.Popen(prog_args, stdout = subprocess.PIPE, stderr = stderr)
  File "/opt/scylladb/python3/lib64/python3.7/subprocess.py", line 800, in __init__
    restore_signals, start_new_session)
  File "/opt/scylladb/python3/lib64/python3.7/subprocess.py", line 1551, in _execute_child
    raise child_exception_type(errno_num, err_msg, err_filename)
FileNotFoundError: [Errno 2] No such file or directory: 'hwloc-calc': 'hwloc-calc'
after yum install hwloc
and reruning scylla_setup
I get:
cat /etc/scylla.d/cpuset.conf
# DO NO EDIT
# This file should be automatically configure by scylla_cpuset_setup
#
# CPUSET="--cpuset 0 --smp 1"
CPUSET="--cpuset 0-15 "
which is also not what we want
the question here is what does perftune of nic lock the rx queues to
tarzanek
on 6 Oct 2020
dry run of perftune:
[root@mgr-backup-1tb-manager--db-node-8782ad1e-0-4 ~]# /opt/scylladb/scripts/perftune.py --dry-run --tune net --nic eth0
# irqbalance is not running
# Setting a physical interface eth0...
# Distributing all IRQs
echo 00000001 > /proc/irq/53/smp_affinity
echo 00000001 > /proc/irq/72/smp_affinity
echo 00000001 > /proc/irq/73/smp_affinity
echo 00000100 > /proc/irq/46/smp_affinity
echo 00000100 > /proc/irq/48/smp_affinity
echo 00000002 > /proc/irq/55/smp_affinity
echo 00000002 > /proc/irq/69/smp_affinity
echo 00000200 > /proc/irq/65/smp_affinity
echo 00000200 > /proc/irq/70/smp_affinity
echo 00000004 > /proc/irq/66/smp_affinity
echo 00000004 > /proc/irq/76/smp_affinity
echo 00000400 > /proc/irq/59/smp_affinity
echo 00000400 > /proc/irq/58/smp_affinity
echo 00000008 > /proc/irq/52/smp_affinity
echo 00000008 > /proc/irq/50/smp_affinity
echo 00000800 > /proc/irq/78/smp_affinity
echo 00000800 > /proc/irq/60/smp_affinity
echo 00000010 > /proc/irq/54/smp_affinity
echo 00000010 > /proc/irq/75/smp_affinity
echo 00001000 > /proc/irq/77/smp_affinity
echo 00001000 > /proc/irq/49/smp_affinity
echo 00000020 > /proc/irq/47/smp_affinity
echo 00000020 > /proc/irq/61/smp_affinity
echo 00002000 > /proc/irq/51/smp_affinity
echo 00002000 > /proc/irq/71/smp_affinity
echo 00000040 > /proc/irq/62/smp_affinity
echo 00000040 > /proc/irq/56/smp_affinity
echo 00004000 > /proc/irq/57/smp_affinity
echo 00004000 > /proc/irq/64/smp_affinity
echo 00000080 > /proc/irq/63/smp_affinity
echo 00000080 > /proc/irq/74/smp_affinity
echo 00008000 > /proc/irq/67/smp_affinity
echo 00008000 > /proc/irq/68/smp_affinity
echo 0000ffff > /sys/class/net/eth0/queues/rx-13/rps_cpus
echo 0000ffff > /sys/class/net/eth0/queues/rx-9/rps_cpus
echo 0000ffff > /sys/class/net/eth0/queues/rx-11/rps_cpus
echo 0000ffff > /sys/class/net/eth0/queues/rx-7/rps_cpus
echo 0000ffff > /sys/class/net/eth0/queues/rx-5/rps_cpus
echo 0000ffff > /sys/class/net/eth0/queues/rx-3/rps_cpus
echo 0000ffff > /sys/class/net/eth0/queues/rx-1/rps_cpus
echo 0000ffff > /sys/class/net/eth0/queues/rx-14/rps_cpus
echo 0000ffff > /sys/class/net/eth0/queues/rx-12/rps_cpus
echo 0000ffff > /sys/class/net/eth0/queues/rx-8/rps_cpus
echo 0000ffff > /sys/class/net/eth0/queues/rx-10/rps_cpus
echo 0000ffff > /sys/class/net/eth0/queues/rx-6/rps_cpus
echo 0000ffff > /sys/class/net/eth0/queues/rx-4/rps_cpus
echo 0000ffff > /sys/class/net/eth0/queues/rx-2/rps_cpus
echo 0000ffff > /sys/class/net/eth0/queues/rx-15/rps_cpus
echo 0000ffff > /sys/class/net/eth0/queues/rx-0/rps_cpus
sysctl net.core.rps_sock_flow_entries
# Setting net.core.rps_sock_flow_entries to 32768
sysctl -w net.core.rps_sock_flow_entries=32768
echo 2048 > /sys/class/net/eth0/queues/rx-13/rps_flow_cnt
echo 2048 > /sys/class/net/eth0/queues/rx-9/rps_flow_cnt
echo 2048 > /sys/class/net/eth0/queues/rx-11/rps_flow_cnt
echo 2048 > /sys/class/net/eth0/queues/rx-7/rps_flow_cnt
echo 2048 > /sys/class/net/eth0/queues/rx-5/rps_flow_cnt
echo 2048 > /sys/class/net/eth0/queues/rx-3/rps_flow_cnt
echo 2048 > /sys/class/net/eth0/queues/rx-1/rps_flow_cnt
echo 2048 > /sys/class/net/eth0/queues/rx-14/rps_flow_cnt
echo 2048 > /sys/class/net/eth0/queues/rx-12/rps_flow_cnt
echo 2048 > /sys/class/net/eth0/queues/rx-8/rps_flow_cnt
echo 2048 > /sys/class/net/eth0/queues/rx-10/rps_flow_cnt
echo 2048 > /sys/class/net/eth0/queues/rx-6/rps_flow_cnt
echo 2048 > /sys/class/net/eth0/queues/rx-4/rps_flow_cnt
echo 2048 > /sys/class/net/eth0/queues/rx-2/rps_flow_cnt
echo 2048 > /sys/class/net/eth0/queues/rx-15/rps_flow_cnt
echo 2048 > /sys/class/net/eth0/queues/rx-0/rps_flow_cnt
# Enable ntuple filtering HW offload for eth0...
ethtool -K eth0 ntuple on
echo 00000001 > /sys/class/net/eth0/queues/tx-6/xps_cpus
echo 00000100 > /sys/class/net/eth0/queues/tx-12/xps_cpus
echo 00000002 > /sys/class/net/eth0/queues/tx-4/xps_cpus
echo 00000200 > /sys/class/net/eth0/queues/tx-10/xps_cpus
echo 00000004 > /sys/class/net/eth0/queues/tx-2/xps_cpus
echo 00000400 > /sys/class/net/eth0/queues/tx-0/xps_cpus
echo 00000008 > /sys/class/net/eth0/queues/tx-9/xps_cpus
echo 00000800 > /sys/class/net/eth0/queues/tx-15/xps_cpus
echo 00000010 > /sys/class/net/eth0/queues/tx-7/xps_cpus
echo 00001000 > /sys/class/net/eth0/queues/tx-13/xps_cpus
echo 00000020 > /sys/class/net/eth0/queues/tx-5/xps_cpus
echo 00002000 > /sys/class/net/eth0/queues/tx-11/xps_cpus
echo 00000040 > /sys/class/net/eth0/queues/tx-3/xps_cpus
echo 00004000 > /sys/class/net/eth0/queues/tx-1/xps_cpus
echo 00000080 > /sys/class/net/eth0/queues/tx-8/xps_cpus
echo 00008000 > /sys/class/net/eth0/queues/tx-14/xps_cpus
echo 4096 > /proc/sys/net/core/somaxconn
echo 4096 > /proc/sys/net/ipv4/tcp_max_syn_backlog
so we just lock to all cpus
ok, the best thing would be to check the status of the machine when the timeouts happen to see if above is good decision or not
tarzanek
on 6 Oct 2020
As wrong as the configuration might have been, @fruch, I don't think that's the root cause of timeouts.
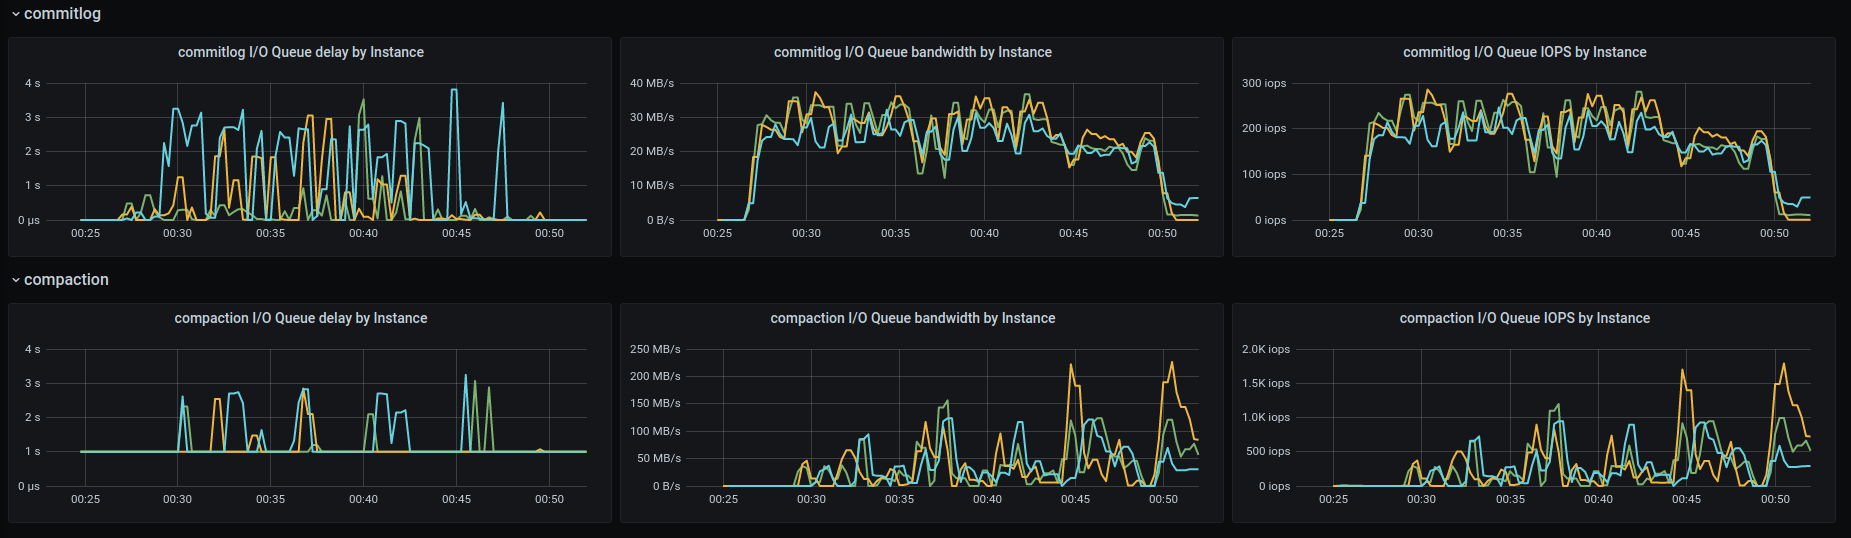
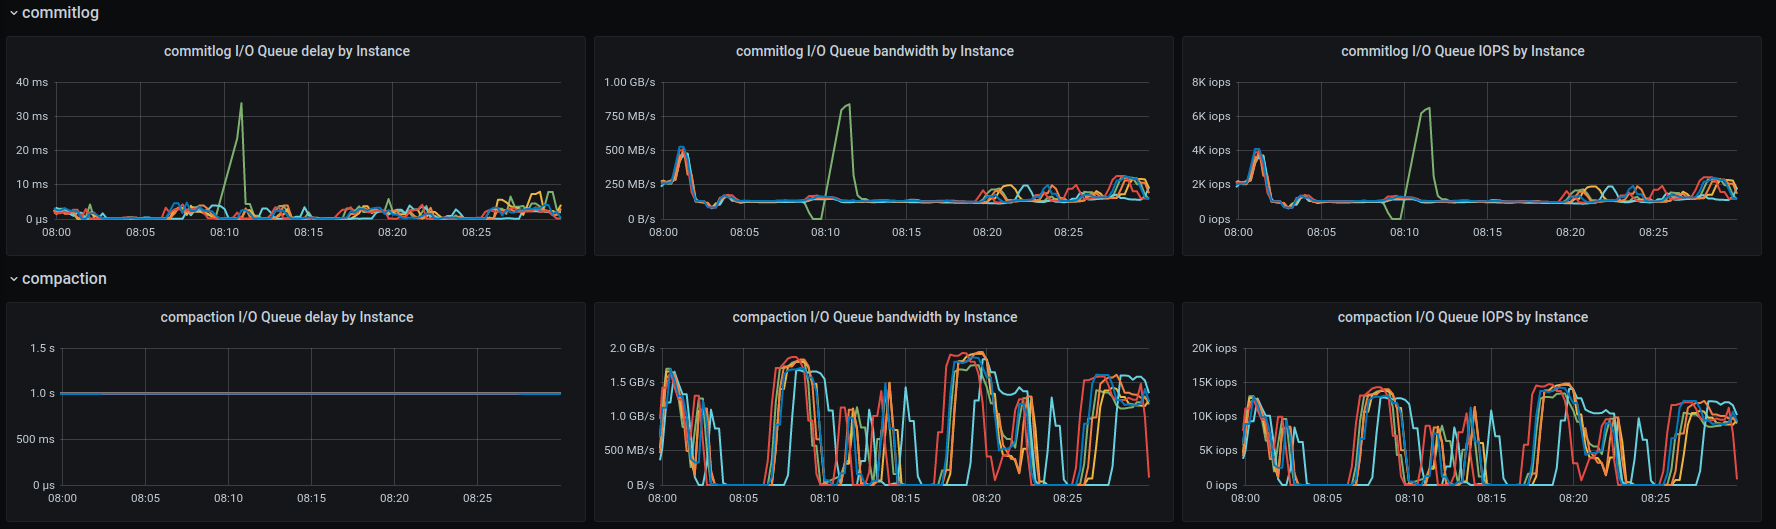
The reason is that you are pushing the rate to the maximum (since you don't set the rate target in the c-s command line) which gets the I/O to its limit pretty fast (see the amount of background writes).
On top of that LCS kicks in and starts consuming a lot of I/O budget (rates get as high as 1GB/sec in the compaction class):
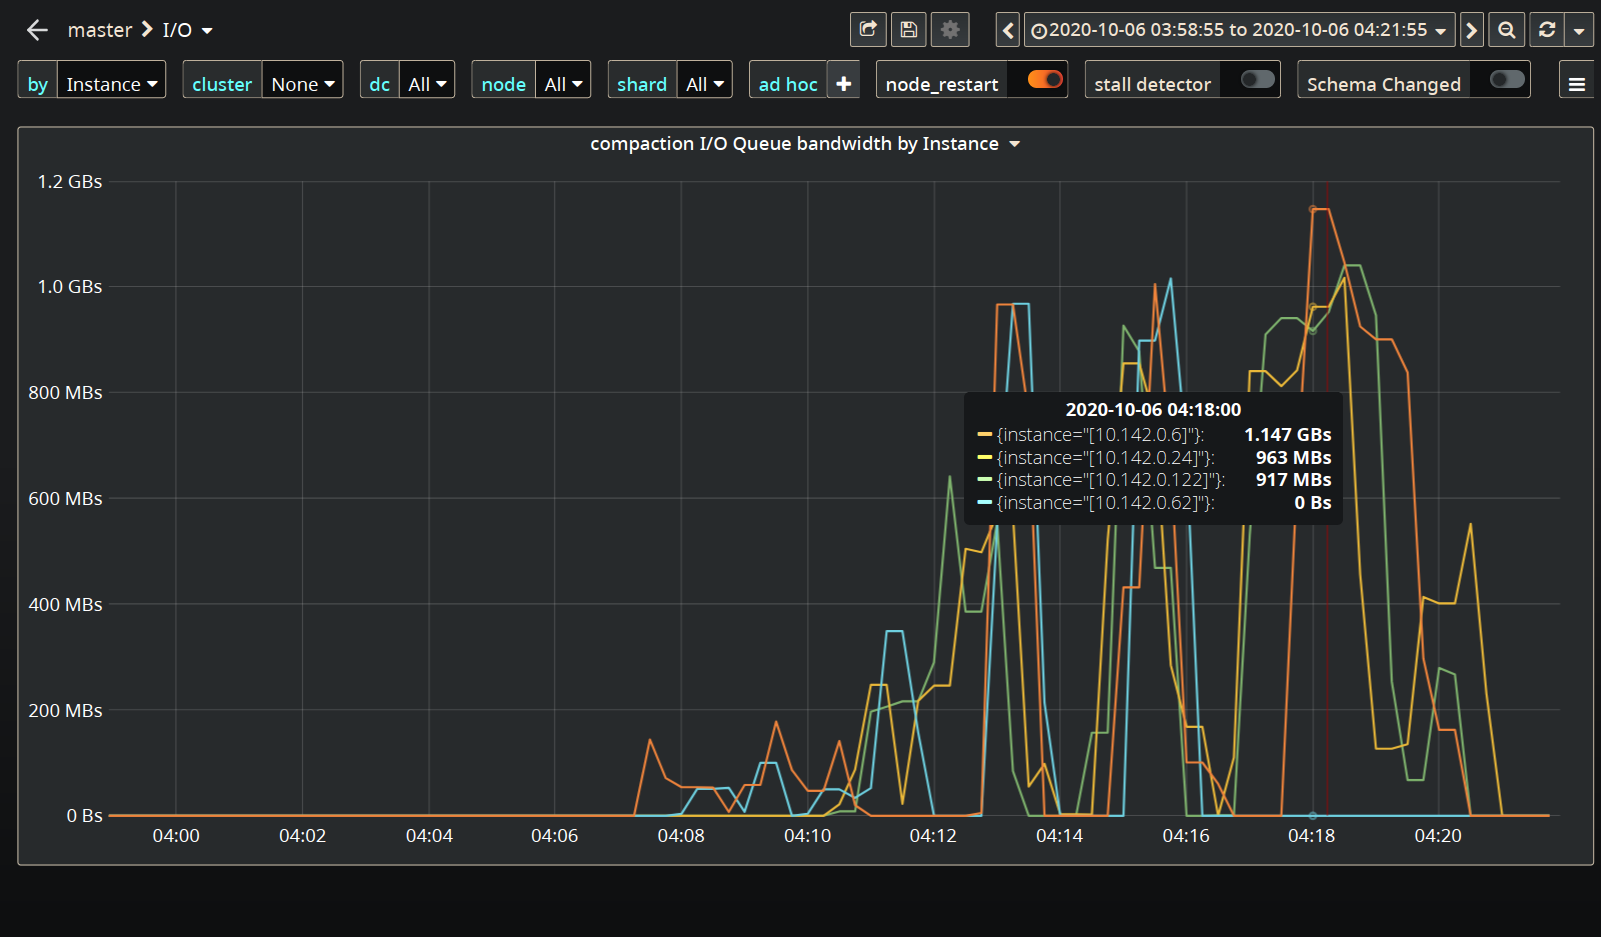
Which adds to the insult.
I think you need to pace the c-s down here or not get offended by a few timeouts:
 vladzcloudius
on 6 Oct 2020
vladzcloudius
on 6 Oct 2020
As wrong as the configuration might have been, @fruch, I don't think that's the root cause of timeouts.
The reason is that you are pushing the rate to the maximum (since you don't set the rate target in the c-s command line) which gets the I/O to its limit pretty fast (see the amount of background writes).
On top of that LCS kicks in and starts consuming a lot of I/O budget (rates get as high as 1GB/sec in the compaction class):
1.2Gbs is much better then before, we failed at ~600Mbs
@vladzcloudius I'm not sure I'm following the reasons, why we could throw at i3.4xlarge in AWS the same amount of data, and scylla throttle it quite nicely, and we don't need to throttle from c-s side.
the local disks are that slow in GCE ?
Also I don't know if I can call those a few timeouts
@tarzanek
this command isn't working, I think it's not using the corrects PATH and the relocatable python, from within the scylla_prepare I think it does work
/opt/scylladb/scripts/perftune.py --tune net --nic eth0 --get-cpu-mask
I opened https://github.com/scylladb/scylla/issues/7350 since running tools used to work, now it's not, scripts will break, automation scripts will too
tarzanek
on 6 Oct 2020
@tarzanek @vladzcloudius
I've playing around with it yesterday
I've change the command limit the load from c-s end,
cassandra-stress write cl=QUORUM n=1100200300 -schema keyspace=keyspace1 'replication(factor=3)' -port jmx=6868 -mode cql3 native -rate threads=64 throttle=40000/s -col 'size=FIXED(200) n=FIXED(5)' -pop seq=1..1100200300
One surge of timeouts have seen at the begining, but after that is stable for a while:
http://34.75.108.171:3000/d/eJdUlZ5Mk/scylla-per-server-metrics-nemesis-master?orgId=1&refresh=30s&from=now-1h&to=now
again compared to run on our AMIs in AWS, 40K is around half of what I remember we can get,
downloaded the monitor to take a peak from out runs of 4.1 with 1Tb
hydra investigate show-monitor 5db61478-f573-4aa4-99fe-dd5e2ec41b7
http://3.216.132.220:3000/d/manager-2-2/scylla-manager-metrics?orgId=1&refresh=30s
Latency is 15-40ms, but scylla seem to be throttling it quite fine, out of the box.
the bottle neck is just in a different place ? i.e. in AWS seem like it's the CPU, and in GCE it's the disk ?
fruch
on 7 Oct 2020
It was holding for ~3 hours, but reach ~360Gb on each node, and started failing.
fruch
on 7 Oct 2020
@Israel Fruchter fruch@scylladb.com which kernel are you using we know
that in the tobe gcp image we use a different kernel then whats shipped in
cenots7 / centos8
On Wed, Oct 7, 2020 at 2:09 PM Israel Fruchter notifications@github.com
wrote:
It was holding for ~3 hours, but reach ~360Gb on each node, and started
failing.—
You are receiving this because you are subscribed to this thread.
Reply to this email directly, view it on GitHub
https://github.com/scylladb/scylla/issues/7341#issuecomment-704863439,
or unsubscribe
https://github.com/notifications/unsubscribe-auth/AA2OCCGOEBPGNMIYDWGW2LLSJRD5HANCNFSM4SFUGCQQ
.
 slivne
on 7 Oct 2020
slivne
on 7 Oct 2020
SIs after using sq_split :
top - 18:31:27 up  1:42,  1 user,  load average: 6.95, 8.36, 8.79
Tasks: 576 total,   2 running, 574 sleeping,   0 stopped,   0 zombie
%Cpu0  :  0.0 us,  0.0 sy,  0.0 ni, 70.8 id,  0.0 wa,  4.6 hi, 24.6 si,  0.0 st
%Cpu1  : 30.9 us, 20.6 sy,  0.0 ni, 41.2 id,  0.0 wa,  1.5 hi,  5.9 si,  0.0 st
%Cpu2  : 29.2 us, 21.5 sy,  0.0 ni, 41.5 id,  0.0 wa,  1.5 hi,  6.2 si,  0.0 st
%Cpu3  : 28.4 us, 23.9 sy,  0.0 ni, 40.3 id,  0.0 wa,  1.5 hi,  6.0 si,  0.0 st
%Cpu4  : 28.1 us, 20.3 sy,  0.0 ni, 45.3 id,  0.0 wa,  1.6 hi,  4.7 si,  0.0 st
%Cpu5  : 29.2 us, 20.0 sy,  0.0 ni, 44.6 id,  0.0 wa,  1.5 hi,  4.6 si,  0.0 st
%Cpu6  : 27.9 us, 25.0 sy,  0.0 ni, 41.2 id,  0.0 wa,  1.5 hi,  4.4 si,  0.0 st
%Cpu7  : 31.8 us, 18.2 sy,  0.0 ni, 42.4 id,  0.0 wa,  1.5 hi,  6.1 si,  0.0 st
%Cpu8  :  1.5 us,  3.1 sy,  0.0 ni, 76.9 id,  0.0 wa,  3.1 hi, 15.4 si,  0.0 st
%Cpu9  : 29.7 us, 20.3 sy,  0.0 ni, 43.8 id,  0.0 wa,  1.6 hi,  4.7 si,  0.0 st
%Cpu10 : 30.2 us, 20.6 sy,  0.0 ni, 41.3 id,  0.0 wa,  1.6 hi,  6.3 si,  0.0 st
%Cpu11 : 26.6 us, 21.9 sy,  0.0 ni, 43.8 id,  0.0 wa,  1.6 hi,  6.2 si,  0.0 st
%Cpu12 : 30.3 us, 22.7 sy,  0.0 ni, 40.9 id,  0.0 wa,  1.5 hi,  4.5 si,  0.0 st
%Cpu13 : 29.2 us, 21.5 sy,  0.0 ni, 43.1 id,  0.0 wa,  1.5 hi,  4.6 si,  0.0 st
%Cpu14 : 29.2 us, 21.5 sy,  0.0 ni, 43.1 id,  0.0 wa,  1.5 hi,  4.6 si,  0.0 st
%Cpu15 : 30.8 us, 21.5 sy,  0.0 ni, 41.5 id,  0.0 wa,  1.5 hi,  4.6 si,  0.0 st
MiB Mem : 104478.7 total,   2688.7 free,  97823.3 used,   3966.6 buff/cache
MiB Swap:      0.0 total,      0.0 free,      0.0 used.   5675.7 avail Mem

    PID USER      PR  NI    VIRT    RES    SHR S  %CPU  %MEM     TIME+ COMMAND
  48534 scylla    20   0   16.0t  94.6g  58696 R 692.4  92.7 565:45.12 scylla
    622 root       0 -20       0      0      0 I   1.5   0.0   0:02.26 kworker/9:1H-kblockd
    832 root      20   0  109412  11196   8432 S   1.5   0.0   0:00.57 systemd-udevd
  74425 root      20   0   65080   5300   4080 R   1.5   0.0   0:00.05 top
      1 root      20   0  245168  14152   9220 S   0.0   0.0   0:11.84 systemd
      2 root      20   0       0      0      0 S   0.0   0.0   0:00.06 kthreadd
      3 root       0 -20       0      0      0 I   0.0   0.0   0:00.00 rcu_gp
so far most writes were retried, almost no time outs
throttled at 40k, most probably 50k, 60k or even 70k might work, threads might be decreased to 4 x 14 so 56 to get optimum usage
(and if you on loader also do cpu nic offloading in similar way(perftune can be used) and set affinity for c-s to leftover cpus the latencies on client will be even better)
tarzanek
on 7 Oct 2020
Update
http://35.231.33.180:3000/d/SfffwMcMk/scylla-per-server-metrics-nemesis-master?orgId=1&from=1602088311871&to=1602112341050
after patching the cpuset to: 1-7,9-15
A run throttled at 40K ops by c-s,
has lasted ~5.5 hours, and failed on timeout "storm"
filled up ~600Gb on each node in that time
for compering we had one run without throttling , it lasted ~1.5 hours, and did got to 60K-70K ops, as @tarzanek estimated
http://35.231.218.186:3000/d/ieTTV75Gz/scylla-per-server-metrics-nemesis-master?orgId=1&from=1602103316079&to=1602113512352
both case compaction was starting to raise when the "storm" starts.
a note c-s, is ignoring timeouts, and retry 10 times, it fails when a request is failing 10 times in a row. in our test we rarely ignore all errors in c-s.
fruch
on 8 Oct 2020
so next step is using just 56 threads, ev. try to increase limit to 50k
the only other optimization would be kernel
check and compare kernels in current Centos 8 which you use to some Google blessed kernels (Ubuntu 18 or Ubuntu 20)
that said in above the SIs weren't that high, so the spike was either created by # of threads or some spike with busy neighbours?
tarzanek
on 8 Oct 2020
@fruch which kernel version - we know that the gce image is not using the centos8 provided one - we had to change it to get a better support for the local drives
slivne
on 8 Oct 2020
@bentsi ^^
slivne
on 8 Oct 2020
@fruch which kernel version - we know that the gce image is not using the centos8 provided one - we had to change it to get a better support for the local drives
4.18.0-193.14.2.el8_2.x86_64
@bentsi you think we could build a gce image based on 4.1.7 (is the one you have is base on master ?)
fruch
on 8 Oct 2020
@fruch which kernel version - we know that the gce image is not using the centos8 provided one - we had to change it to get a better support for the local drives
4.18.0-193.14.2.el8_2.x86_64
@bentsi you think we could build a gce image based on 4.1.7 (is the one you have is base on master ?)
That kernel contains the google nvme fixes.
 avikivity
on 8 Oct 2020
avikivity
on 8 Oct 2020
@avi @slivne
Do you need anything form those clusters ? anything else to check on them ? or I can kill them ?
Should I try ubuntu18 or ubuntu20 ? or try out the GCE image with the ml-kernel ? (or both, or all 3 options :sob: )
One more question:
Should we skip for the backup part we actually were aiming to test,
1) use NullCompaction for the ingest of the data ? (or nodetool disablecompaction if available)
or
2) ignore all errors in c-s, and keep going. meaning we might have a bit less data than planned
fruch
on 8 Oct 2020
@fruch If you see timeouts - this means you are overloading the cluster.
In this case you should reduce the rate - not the concurrency which is already pretty low.
The system is able to pull out as much as it can. AWS and GCE are not the same.
You see timeout later in the process because of heavier compactions - you use LCS, which has a heavy write amplification.
Unless you try to estimate the performance of LCS on GCE you should take this into an account and apply lower rates.
vladzcloudius
on 8 Oct 2020
I've took the initial image we have for GCE (after we fixed a few SCT issues)
https://www.googleapis.com/compute/v1/projects/skilled-adapter-452/global/images/scylla-666-development-0-20200816-7e01ae089e1
it has kernel: 5.8.2-1.el8.elrepo.x86_64
but it seems to be much much worse
http://104.196.186.175:3000/d/CHwBAIcGz/scylla-per-server-metrics-nemesis-master?orgId=1&refresh=30s&from=now-1h&to=now
the new monitor (branch-3.5) is cooler, but we get only ~8K writes:
this one doesn't have the patches for the hard coded io_proprieties.yaml values, and not the patches we did to change the cpuset based on sq_split as suggested before.
fruch
on 8 Oct 2020
@fruch If you see timeouts - this means you are overloading the cluster.
In this case you should reduce the rate - not the concurrency which is already pretty low.The system is able to pull out as much as it can. AWS and GCE are not the same.
You see timeout later in the process because of heavier compactions - you use LCS, which has a heavy write amplification.
Unless you try to estimate the performance of LCS on GCE you should take this into an account and apply lower rates.
I've ditched LCS, it help a bit. but still compaction take a toll.
I guess I don't have to much to compare to, and we should compare to result we are having in AWS ? or at least not to expect to have something close ?
fruch
on 8 Oct 2020
Update:
@bentsi would build me a new GCE image, based on latest master, to try it again, since the one we had didn't had very good results. (we only got to 8K requests a sec)
Trying out Ubuntu 20.04, I've run into this small issue: https://github.com/scylladb/scylla/issues/7383
Trying now Ubuntu 18.04 (kernel 5.4.0-1025-gcp), with patch to use sq_split as suggest by @vladzcloudius and @tarzanek
fruch
on 11 Oct 2020
I tried one approach, of stopping compaction all together using NullCompaction, and it see like it's much more stable like that:
it's almost done writing the 1Tb:
http://34.73.252.148:3000/d/CGwxZ1cMz/scylla-per-server-metrics-nemesis-master?orgId=1&from=now-6h&to=now&refresh=30s
I'm writing from 2 loader at 80K rate-limit, and writes to disk are at 130-190 MB/s, (When compaction was on, we go to almost 1.2 GB/s writes to disk, each time timeouts started)

something in scylla limits/throttle of the disk isn't working as we expect... (and used to see in AWS)
or the write_bandwidth: 1468006400 we hardcode base on iotune runs done, is too high ?
fruch
on 12 Oct 2020
The hardcoded values you take from the patch I've sent should be what Google guarantees
(+ I verified with multiple iotune runs and lowered it to match Google)
so if THOSE values are too high, then this is Google SLA breach ...
tarzanek
on 12 Oct 2020
Its not the first time we have issues with google local drives / drivers.
Lets try to verify if the bandwidth shown holds for a long duration not io_tune duration and if there is a bug.
@roydahan / @avikivity which tool should we use to verify the local disks provide the guarantees on a long duration (a coupld of days).
slivne
on 15 Oct 2020
we can set the fio to run a longer period.
 roydahan
on 15 Oct 2020
roydahan
on 15 Oct 2020
@bentsi please add the additional info you have on the 4.3.rc1 GCE image we now have and we will take a look at this
slivne
on 23 Nov 2020
GCE Image: https://www.googleapis.com/compute/alpha/projects/skilled-adapter-452/global/images/9054034449340500842
Scylla version: 4.3.rc1
Instance type: n1-highmem-16
Num disks: 3
Test case scenario definition here
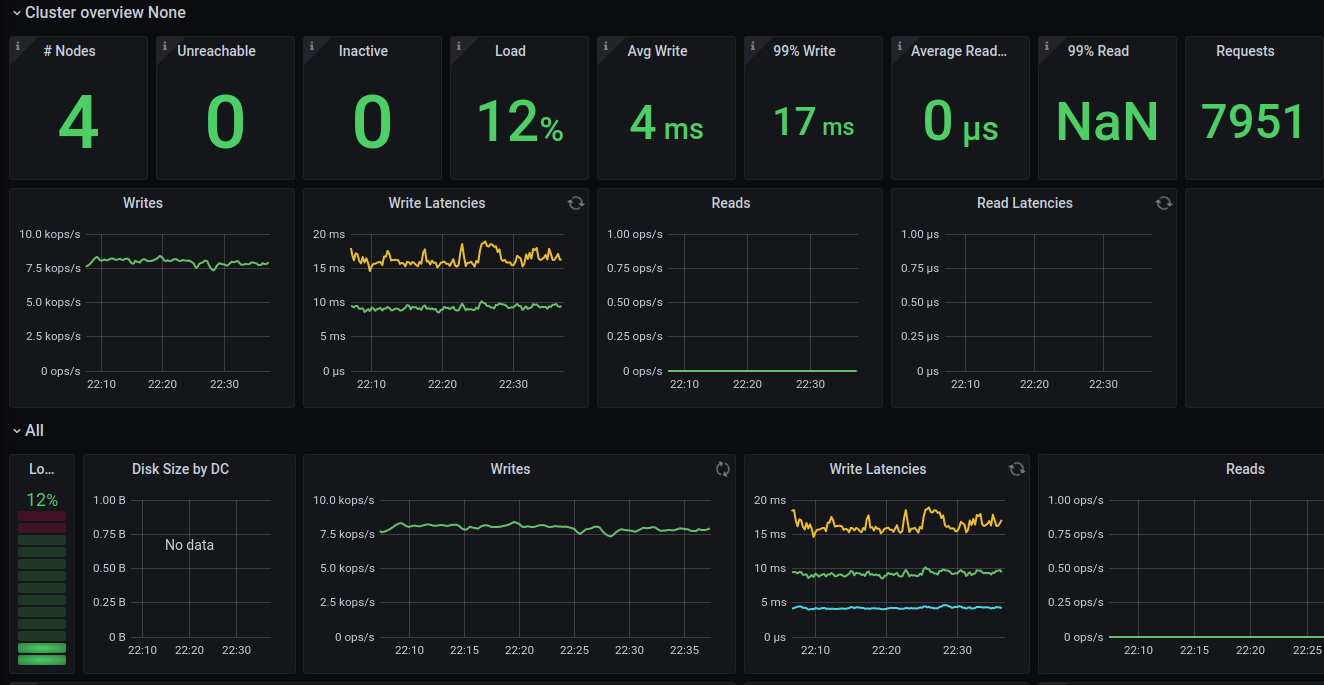
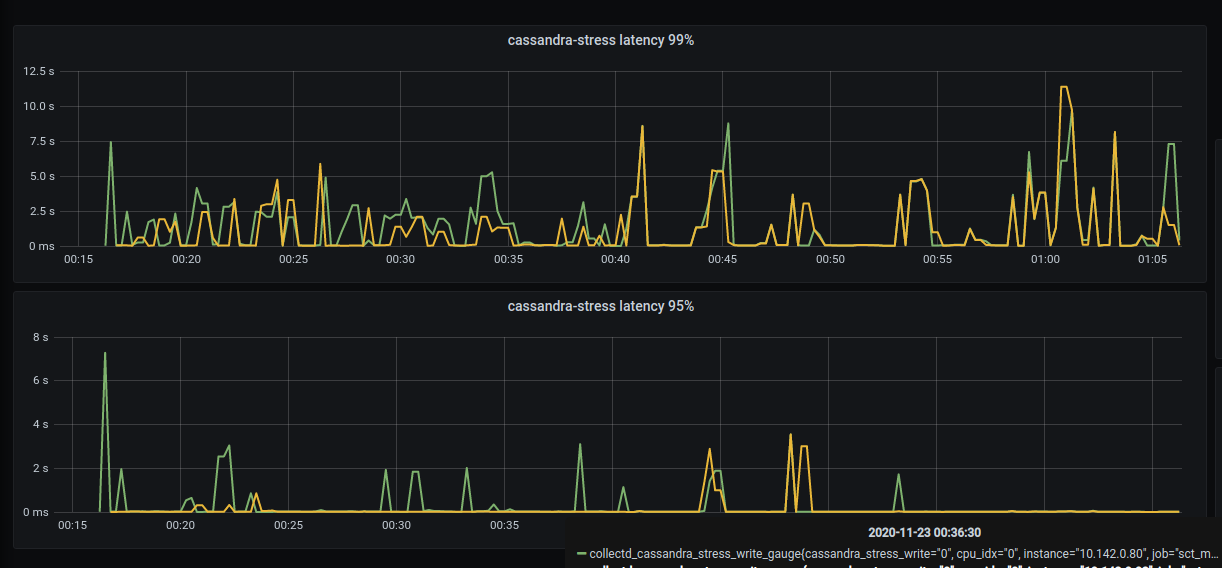
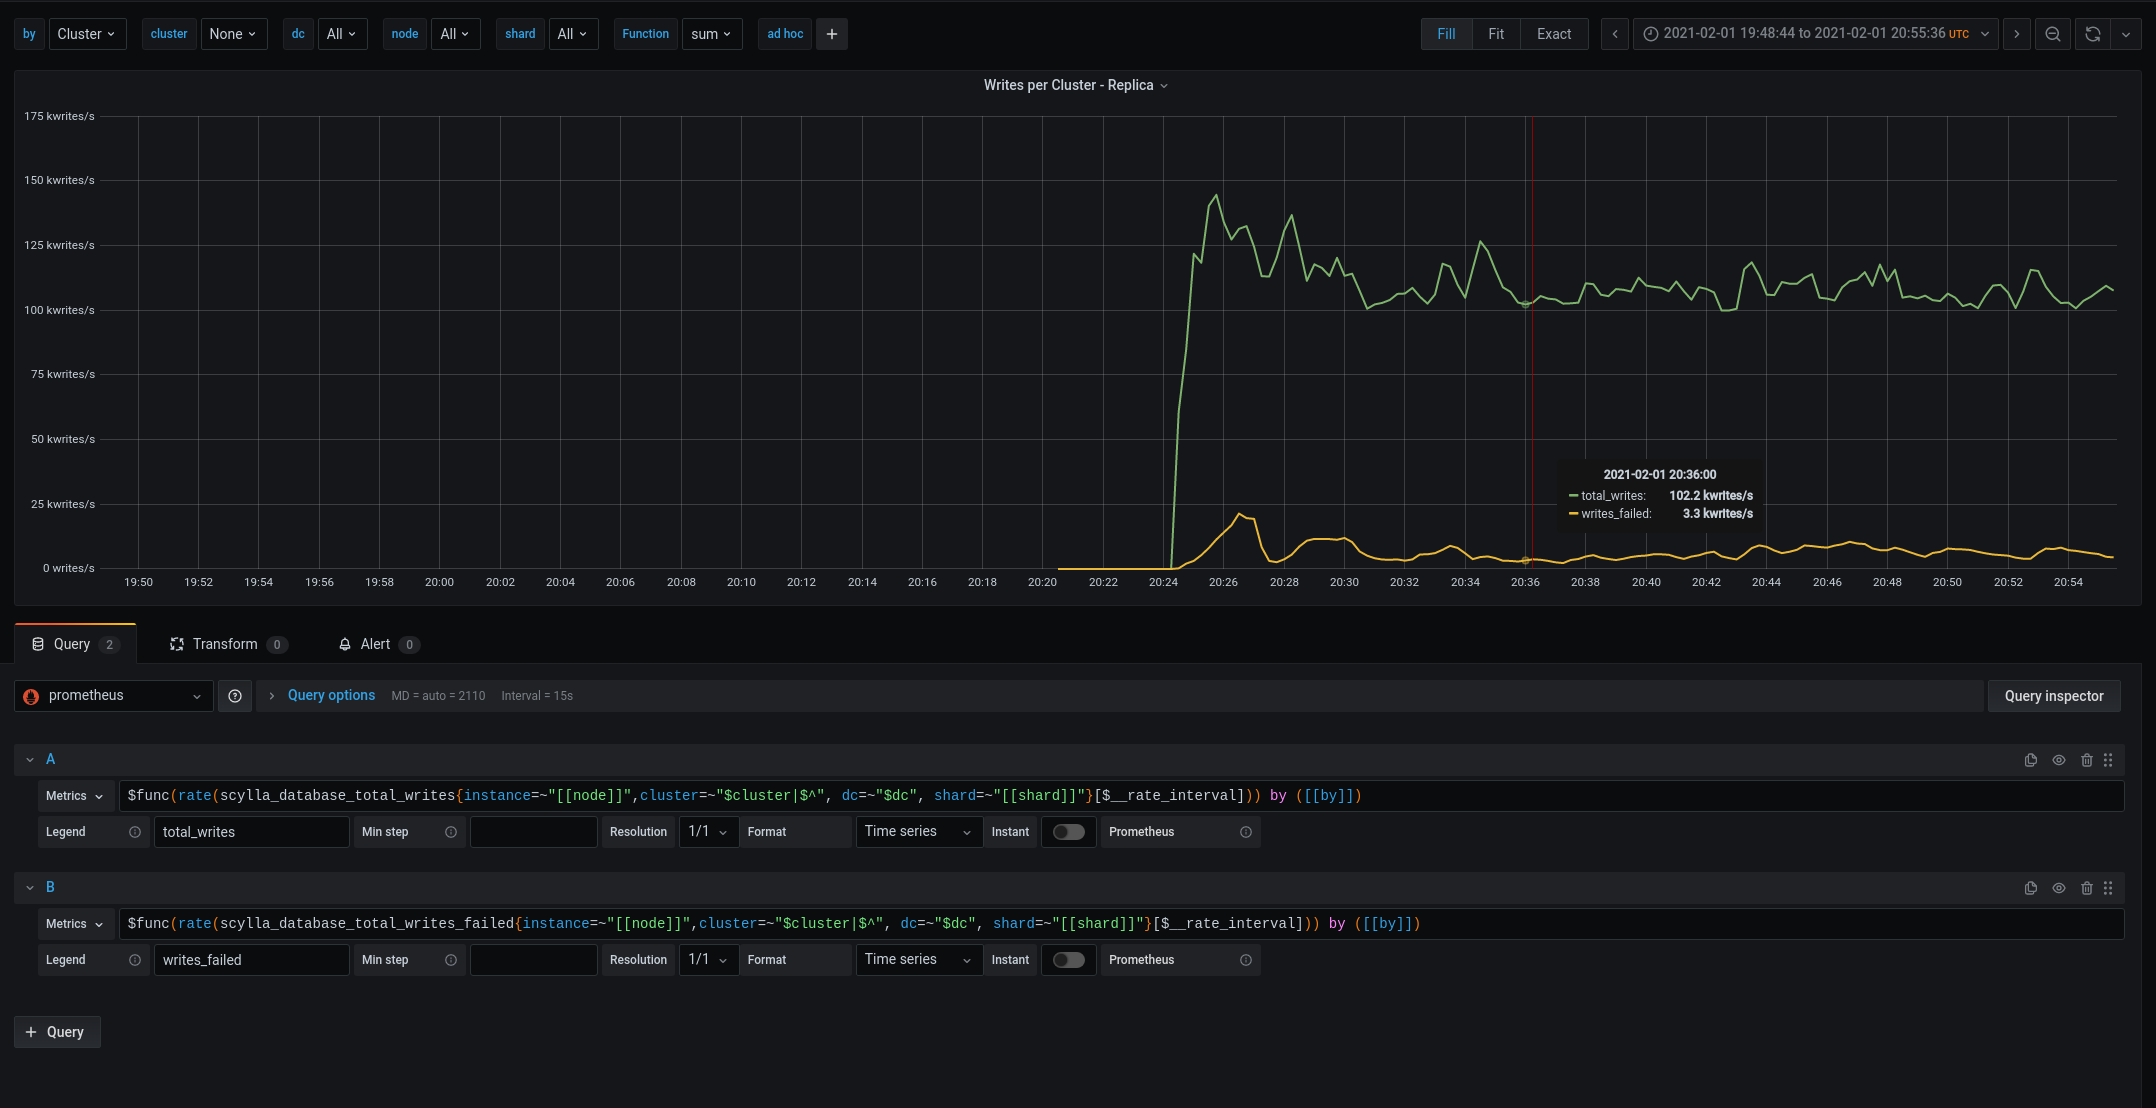
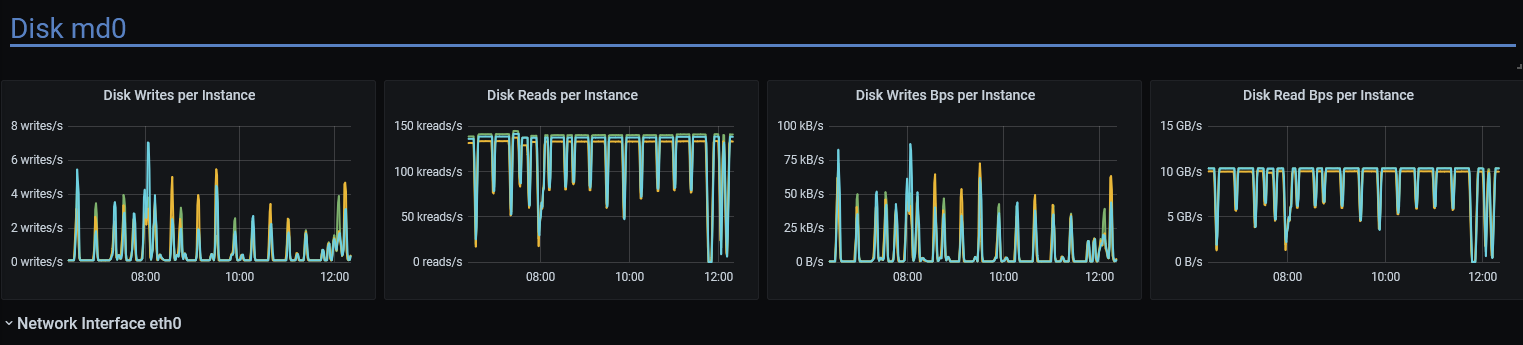
The failure(some of the stress commands failed) happened during prepare write at ~01:07 UTC.
Live monitor: http://18.197.66.195:3000/d/4kBxt3TMz/scylla-per-server-metrics-nemesis-master?orgId=1&from=1606090383537&to=1606093864853
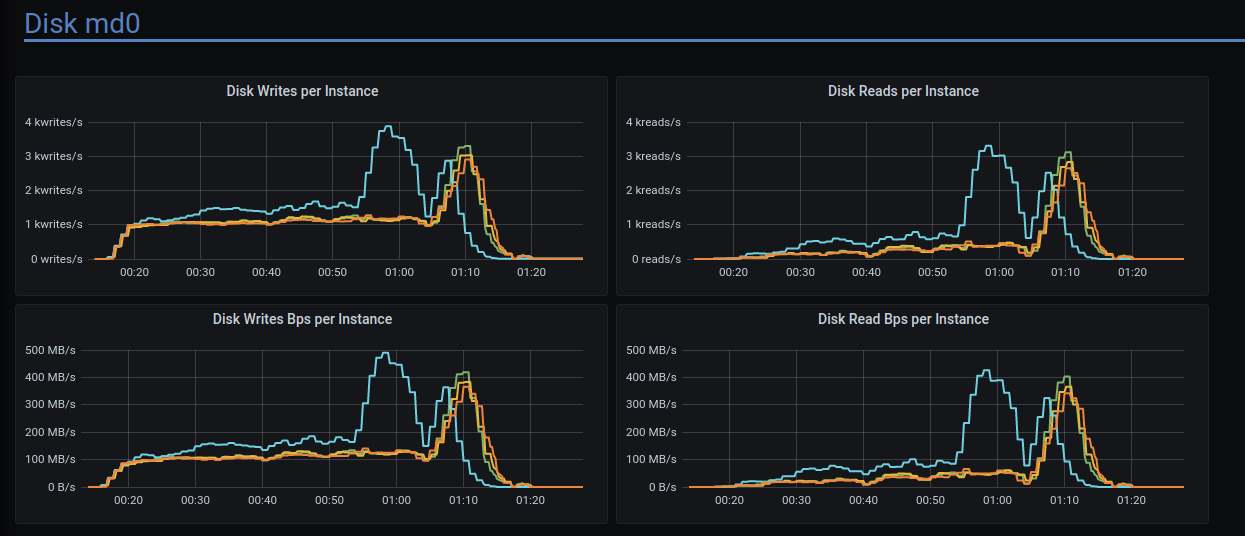
High C-S latency was observed:
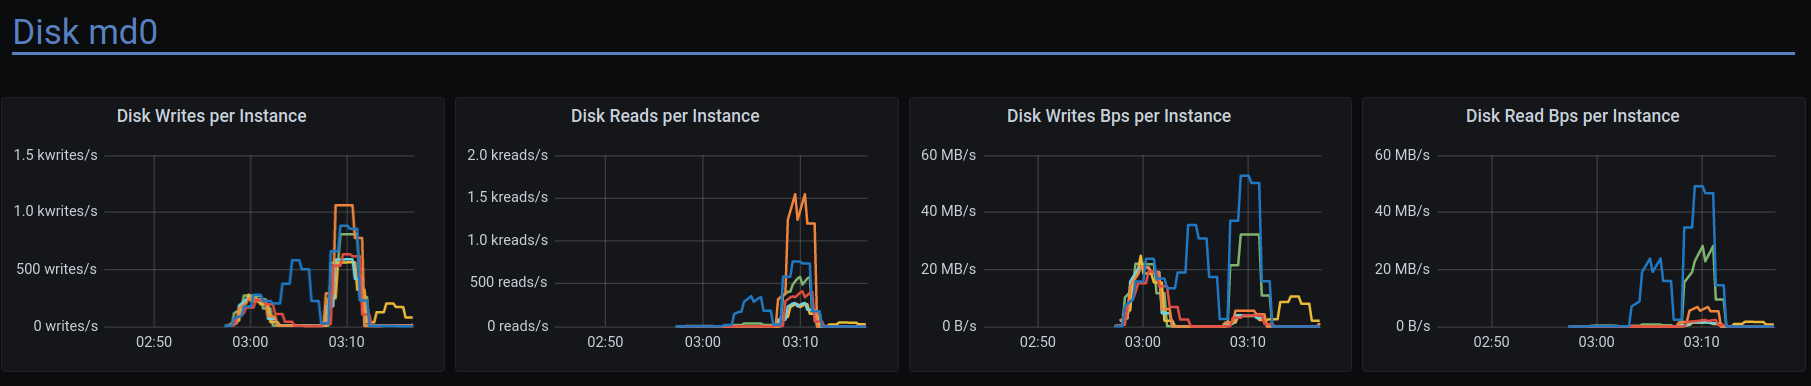
Disk writes have strange pattern:
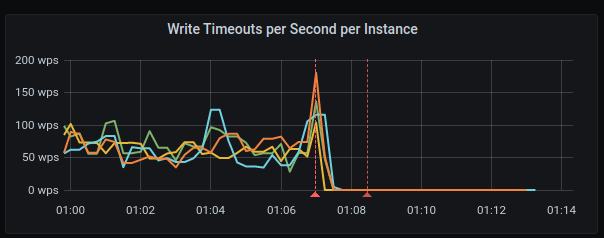
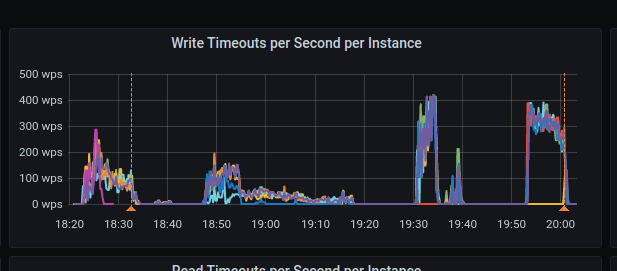
Many write timeouts during the run
 bentsi
on 24 Nov 2020
bentsi
on 24 Nov 2020
Similar behavior observed on GKE deployment (when scylla is running in docker containers on GCE instances managed by google kubernetes engine).
Here is info:
test id: 04398b18-cc08-4f3b-8a64-3330751c1f2e
c-s:
cassandra-stress write cl=QUORUM duration=180m -schema keyspace=keyspace1 'replication(factor=3) compaction(strategy=LeveledCompactionStrategy)' -port jmx=6868 -mode cql3 native -rate threads=100 -pop seq=1..10000000 -log interval=5 -node x.x.x.x -errors skip-unsupported-columns
- See c-s throws a lots of the following errors:
java.io.IOException: Operation x10 on key(s) [36314c32324f34303331]: Error executing: (WriteTimeoutException): Cassandra timeout during SIMPLE write query at consistency QUORUM (2 replica were required but only 1 acknowledged the write)
Logs
db logs:
- https://cloudius-jenkins-test.s3.amazonaws.com/04398b18-cc08-4f3b-8a64-3330751c1f2e/20201130_192731/db-cluster-04398b18.zip
monitor logs:
- https://cloudius-jenkins-test.s3.amazonaws.com/04398b18-cc08-4f3b-8a64-3330751c1f2e/20201130_192731/monitor-set-04398b18.zip
sct logs:
- https://cloudius-jenkins-test.s3.amazonaws.com/04398b18-cc08-4f3b-8a64-3330751c1f2e/20201130_192731/sct-runner-04398b18.zip
Environment:
- Platform: GKE
- Kubernetes version: 1.15.12-gke.20
- Scylla version: 4.2.0
- Scylla-operator version: nightly
- Kubernetes host(Docker host): Ubuntu 18.04.5 LTS
comparison against AWS run:
GKE - this run [test-id: 04398b18-cc08-4f3b-8a64-3330751c1f2e] that went wrong
AWS - run on AWS [test-id: 279c4eff-e823-462e-9b79-8c6806f8acbc]
Hosts:
GKE:
Type: n1-standard-8
CPU cores: 8
Disks: raid of 3 ssd
Disk Type: Local SSD Scratch Disk
AWS:
Type: i3.4xlarge
CPU cores: 16
Disks: raid of 2 nvme
Scylla options:
GKE:
/usr/bin/scylla --log-to-syslog 0 --log-to-stdout 1 --default-log-level info --network-stack posix --io-properties-file=/etc/scylla.d/io_properties.yaml --cpuset 0-7 --smp 6 --listen-address 10.142.0.53 --rpc-address 10.142.0.53 --seed-provider-parameters seeds=10.3.243.243,10.3.246.86 --broadcast-address 10.3.246.86 --broadcast-rpc-address 10.3.246.86 --blocked-reactor-notify-ms 999999999
AWS:
/usr/bin/scylla --blocked-reactor-notify-ms 500 --abort-on-lsa-bad-alloc 1 --abort-on-seastar-bad-alloc --abort-on-internal-error 1 --abort-on-ebadf 1 --enable-sstable-key-validation 1 --log-to-syslog 1 --log-to-stdout 0 --default-log-level info --network-stack posix --io-properties-file=/etc/scylla.d/io_properties.yaml --cpuset 1-7,9-15 --lock-memory=1
/etc/scylla.d/io_properties.yaml
GKE:
disks:
  - mountpoint: /var/lib/scylla
    read_bandwidth: 2 211 590 144
    read_iops: 498576
    write_bandwidth: 1 227 550 336
    write_iops: 299865
AWS:
disks:
- mountpoint: /var/lib/scylla
  read_bandwidth: 4 030 685 470
  read_iops: 822400
  write_bandwidth: 1 617 551 304
  write_iops: 363000
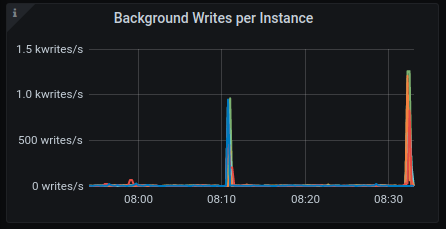
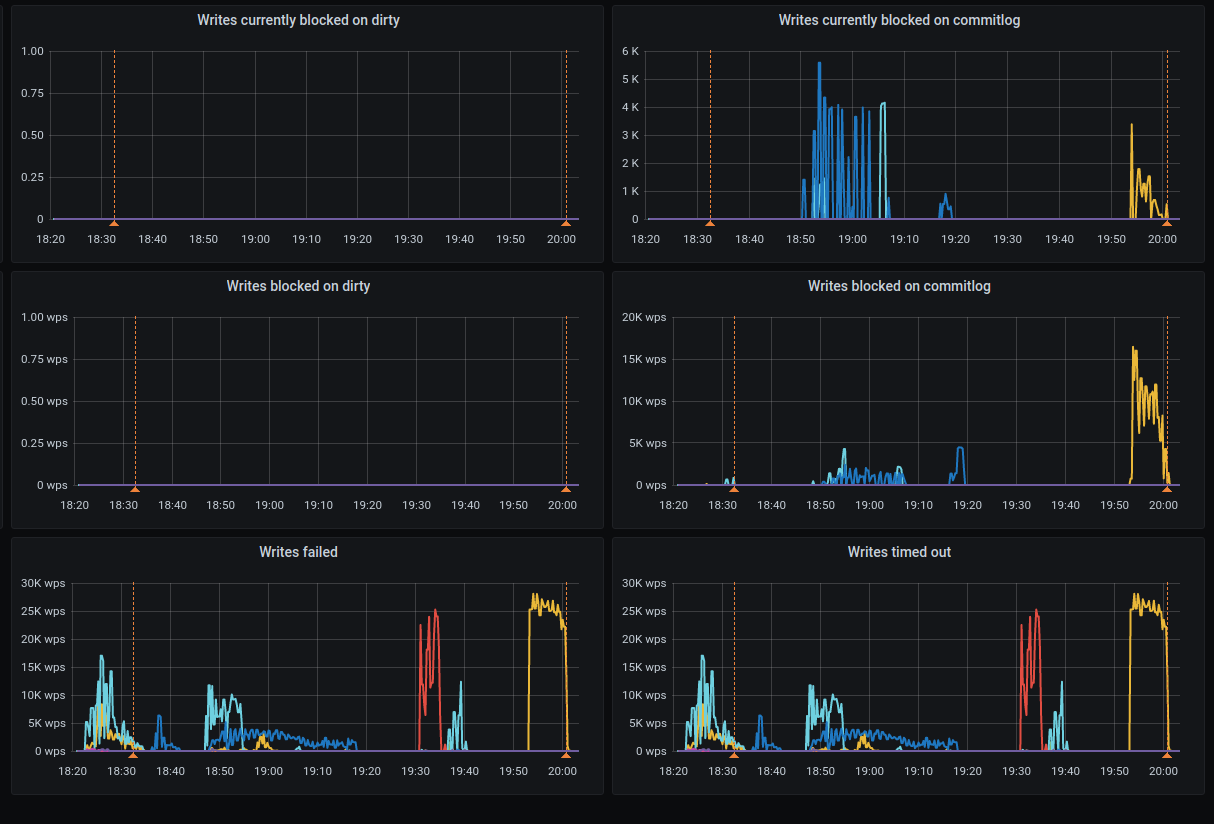
Background writes
GKE:
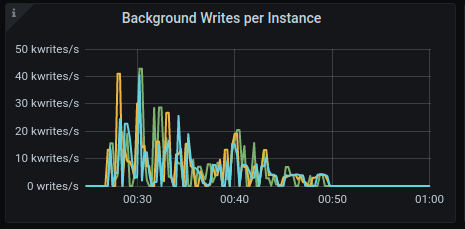
AWS:
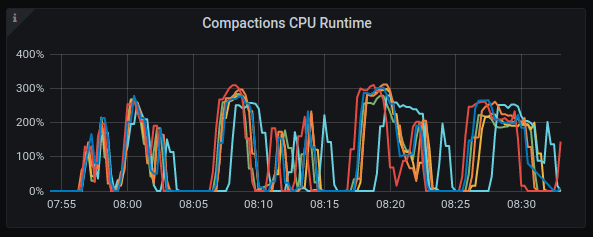
Compaction CPU
GKE:
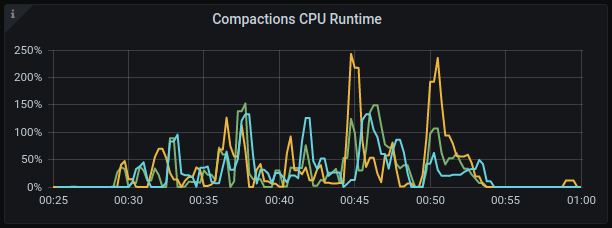
AWS:
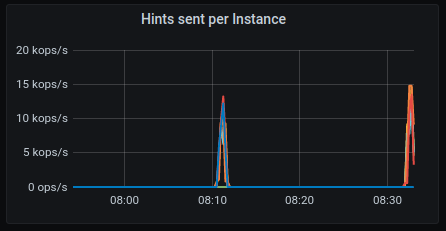
Hints sent
GKE:
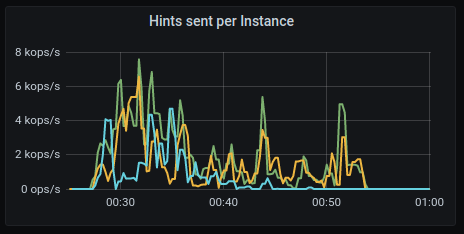
AWS:
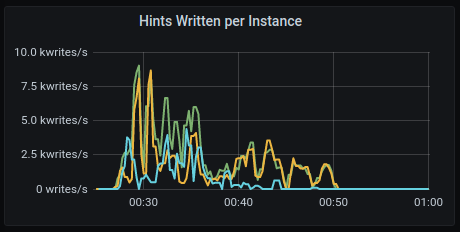
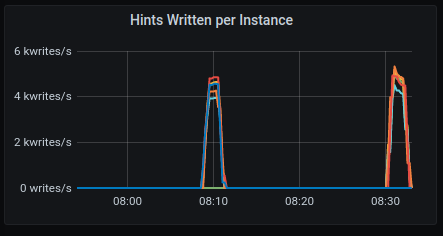
Hints Written
GKE:
AWS:
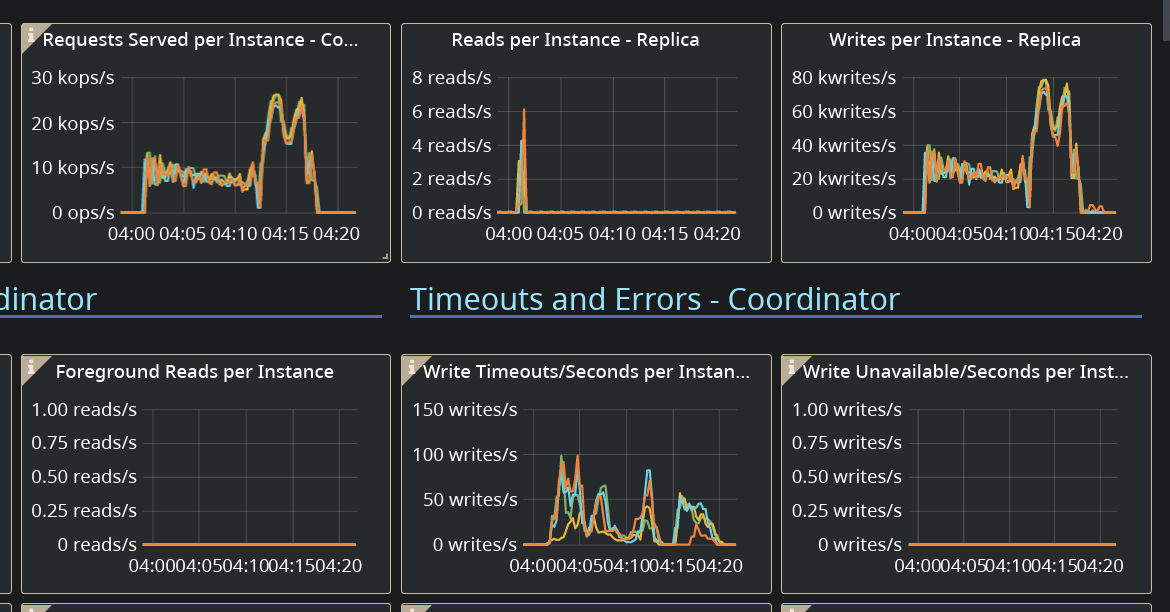
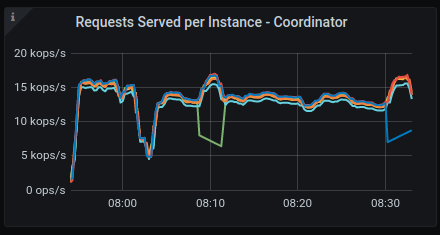
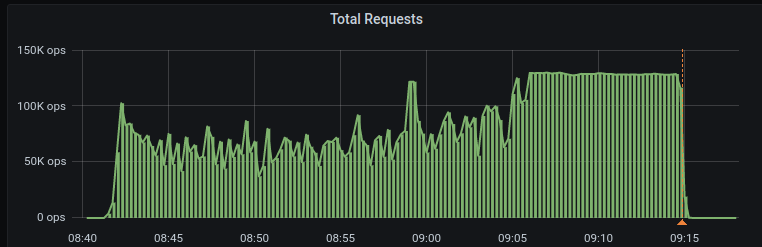
Requests served
GKE:
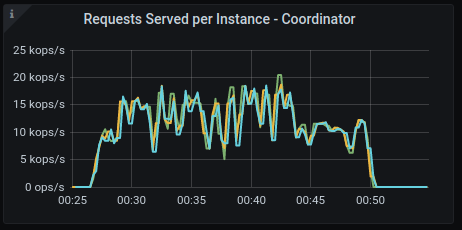
AWS:
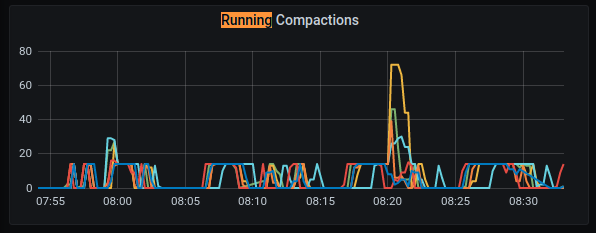
Running Compactions
GKE:
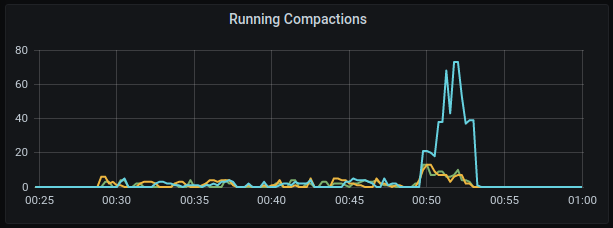
AWS:
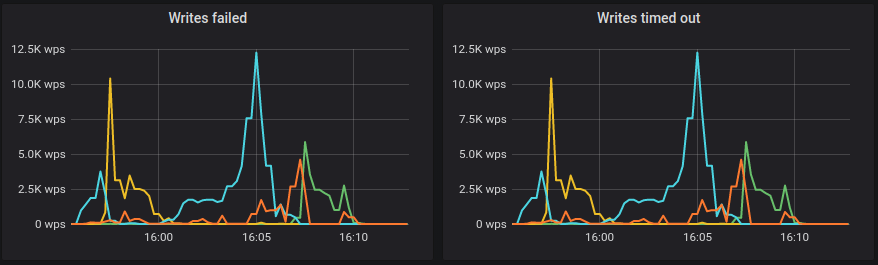
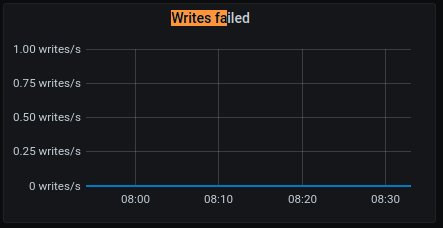
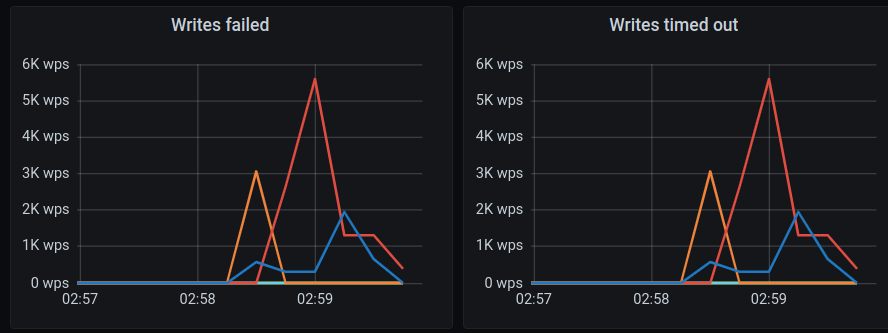
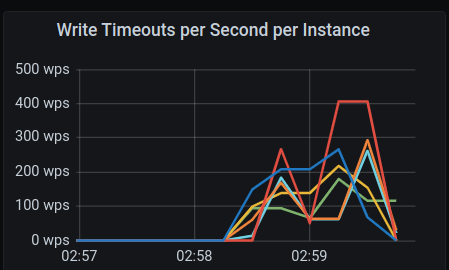
Write failed
GKE:
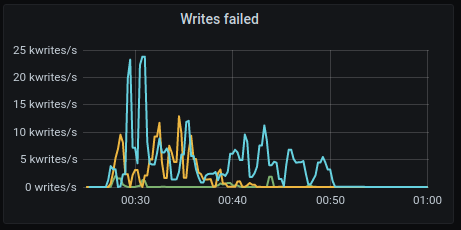
AWS:
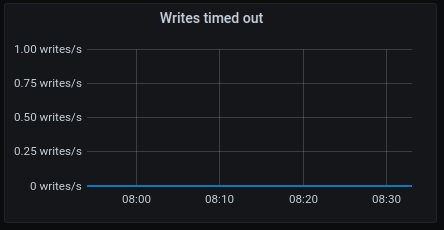
Writes timeouted
GKE:
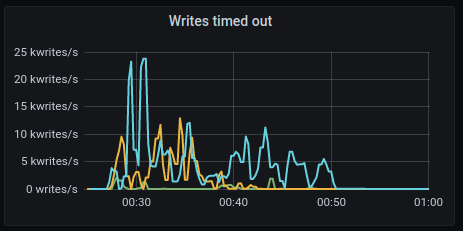
AWS:
IOPS
GKE:
AWS:
IOPS2
GKE:
AWS:
 dkropachev
on 1 Dec 2020
dkropachev
on 1 Dec 2020
@fruch / @bentsi
- In all the scenarios - I think that GCP instances are run with much fewer disk/ disk space and that leads to less bandwidth
- how can others run the scenario's you provided ? so I can get someone to check this out - its fine to provide a jenkins job to use to launch this.
slivne
on 28 Jan 2021
@roydahan help
slivne
on 31 Jan 2021
@bentsi to add the longevity-1TB test of GCE in 4.4
roydahan
on 31 Jan 2021
Added and ran 1TB for 4.4
Job: https://jenkins.scylladb.com/view/scylla-4.4/job/scylla-4.4/job/longevity/job/longevity-1tb-7days-GCE-test/3/console
The run failed. @slivne one can use this job to reproduce
bentsi
on 1 Feb 2021
running the test on 4.3.0 image (not to add the new scheduler into the mix of checking this out)
We are overloading the cluster from the start .... writes fail when the load starts not after 20 minutes
And again we are provisioning less disks then we should - if these are suppose to be paralle to i3.4x - lets prvision them in the same manner - with the sameamount of disk space - and make sure they get the same amount of iops/diskbandwidth.
Then the comparison can be fare.
slivne
on 1 Feb 2021
We have
[shlomi@longevity-tls-1tb-7d-4-4-db-node-ed5a6bb8-0-1 ~]$ cat /etc/scylla.d/io_properties.yaml
disks:
- mountpoint: /var/lib/scylla
  read_bandwidth: 4152360960
  read_iops: 1020000
  write_bandwidth: 2202009600
  write_iops: 540000
and on AWS we have based on what you wrote
[shlomi@longevity-tls-1tb-7d-4-4-db-node-ed5a6bb8-0-1 ~]$ cat /etc/scylla.d/io_properties.yaml
disks:
disks:
- mountpoint: /var/lib/scylla
  read_bandwidth: 4 030 685 470
  read_iops: 822400
  write_bandwidth: 1 617 551 304
  write_iops: 363000
So I am incorrect - and we have a problem ...
slivne
on 1 Feb 2021
iostat shows we have high w_await
Device            r/s     w/s     rkB/s     wkB/s   rrqm/s   wrqm/s  %rrqm  %wrqm r_await w_await aqu-sz rareq-sz wareq-sz  svctm  %util
nvme0n1         13.50  174.00   1484.00  14608.00     0.00     0.00   0.00   0.00    0.41    4.74   1.62   109.93    83.95   4.40  82.55
nvme0n2         24.00  212.50   2448.00  15118.00     0.00     0.00   0.00   0.00    0.40    4.26   1.77   102.00    71.14   3.69  87.20
nvme0n3         14.00  151.00   1564.00  11926.00     0.00     0.00   0.00   0.00    0.39    5.17   1.54   111.71    78.98   4.66  76.85
nvme0n4         19.50  155.50   2244.00  12388.00     0.00     0.00   0.00   0.00    0.44    5.44   1.66   115.08    79.67   4.76  83.35
nvme0n5         18.50  156.00   2176.00  12184.00     0.00     0.00   0.00   0.00    0.46    5.11   1.57   117.62    78.10   4.46  77.85
nvme0n6          9.50  156.50    988.00  12572.00     0.00     0.00   0.00   0.00    0.53    5.13   1.57   104.00    80.33   4.80  79.70
sda              3.50   12.50     42.00    862.00     0.00    27.00   0.00  68.35    1.00    3.52   0.05    12.00    68.96   1.09   1.75
md0             91.50  824.00  10904.00  78794.00     0.00     0.00   0.00   0.00    0.45    8.65   7.17   119.17    95.62   1.06  97.50

avg-cpu:  %user   %nice %system %iowait  %steal   %idle
          16.78    0.00   82.97    0.06    0.00    0.19

Device            r/s     w/s     rkB/s     wkB/s   rrqm/s   wrqm/s  %rrqm  %wrqm r_await w_await aqu-sz rareq-sz wareq-sz  svctm  %util
nvme0n1         15.50  133.00   1684.00   9118.00     0.00     0.00   0.00   0.00    0.45    5.76   1.52   108.65    68.56   5.39  80.00
nvme0n2         18.00  144.00   2010.00   9196.00     0.00     0.00   0.00   0.00    0.44    5.75   1.64   111.67    63.86   5.27  85.40
nvme0n3         19.00  167.00   2084.00   9966.00     0.00     0.00   0.00   0.00    0.45    5.16   1.70   109.68    59.68   4.75  88.35
nvme0n4         14.00  125.00   1324.00   7996.00     0.00     0.00   0.00   0.00    0.43    6.50   1.61    94.57    63.97   6.04  83.90
nvme0n5         18.50  136.50   1948.00   9434.00     0.00     0.00   0.00   0.00    0.46    6.12   1.65   105.30    69.11   5.52  85.60
nvme0n6         11.50  157.50   1102.00  11786.00     0.00     0.00   0.00   0.00    0.39    5.73   1.78    95.83    74.83   5.36  90.65
md0             83.50  677.50  10152.00  57502.00     0.00     0.00   0.00   0.00    0.48   10.53   7.17   121.58    84.87   1.32 100.35

avg-cpu:  %user   %nice %system %iowait  %steal   %idle
          16.59    0.00   83.41    0.00    0.00    0.00

Device            r/s     w/s     rkB/s     wkB/s   rrqm/s   wrqm/s  %rrqm  %wrqm r_await w_await aqu-sz rareq-sz wareq-sz  svctm  %util
nvme0n1         12.00  143.50   1430.00  10394.00     0.00     0.00   0.00   0.00    0.46    5.79   1.64   119.17    72.43   5.46  84.90
nvme0n2         22.50  149.50   2116.00  11246.00     0.00     0.00   0.00   0.00    0.53    5.51   1.63    94.04    75.22   4.90  84.30
nvme0n3         17.00  202.00   1976.00  13606.00     0.00     0.00   0.00   0.00    0.44    4.46   1.77   116.24    67.36   4.13  90.55
nvme0n4         15.50  152.50   1716.00  10632.00     0.00     0.00   0.00   0.00    0.52    5.63   1.70   110.71    69.72   5.17  86.90
nvme0n5         23.00  111.50   2792.00   6540.00     0.00     0.00   0.00   0.00    0.50    6.68   1.49   121.39    58.65   5.82  78.25
nvme0n6         12.50  116.50   1354.00   7120.00     0.00     0.00   0.00   0.00    0.52    6.85   1.58   108.32    61.12   6.40  82.50
md0             93.50  684.00  11384.00  59534.00     0.00     0.00   0.00   0.00    0.49   10.28   7.08   121.75    87.04   1.27  99.10
                     The average time (in milliseconds) for write
                     requests issued to the device to be served. This
                     includes the time spent by the requests in queue
                     and the time spent servicing them.
Looking at the limit the io-scheduler is not reaching the limits
So we have something off:
- are we sending to many requests to the disks and they are being queued ? - which means our tuning of the disk is off from the start.
- or something else is off ... trying to benchmark the disk - not using the pre-tuned settings
slivne
on 1 Feb 2021
running io_tune
[shlomi@longevity-tls-1tb-7d-4-4-db-node-ed5a6bb8-0-1 ~]$ sudo iotune --evaluation-directory /var//lib/scylla
INFO  2021-02-01 21:36:55,034 [shard 0] iotune - /var//lib/scylla passed sanity checks
Starting Evaluation. This may take a while...
Measuring sequential write bandwidth: 1061 MB/s
Measuring sequential read bandwidth: 2815 MB/s
Measuring random write IOPS: 400505 IOPS
Measuring random read IOPS: 720924 IOPS
[shlomi@longevity-tls-1tb-7d-4-4-db-node-ed5a6bb8-0-1 ~]$ sudo iotune --evaluation-directory /var//lib/scylla
INFO  2021-02-01 21:43:18,589 [shard 0] iotune - /var//lib/scylla passed sanity checks
Starting Evaluation. This may take a while...
Measuring sequential write bandwidth: 1042 MB/s
Measuring sequential read bandwidth: 2813 MB/s
Measuring random write IOPS: 384688 IOPS
Measuring random read IOPS: 716498 IOPS
[shlomi@longevity-tls-1tb-7d-4-4-db-node-ed5a6bb8-0-1 ~]$ sudo iotune --evaluation-directory /var//lib/scylla
INFO  2021-02-01 21:45:36,262 [shard 0] iotune - /var//lib/scylla passed sanity checks
Starting Evaluation. This may take a while...
Measuring sequential write bandwidth: 1068 MB/s
Measuring sequential read bandwidth: 2815 MB/s
Measuring random write IOPS: 400612 IOPS
Measuring random read IOPS: 708317 IOPS
[shlomi@longevity-tls-1tb-7d-4-4-db-node-ed5a6bb8-0-1 ~]$
(3 times just to make sure its consistent reporting)
and lets compare it to io_properties
[shlomi@longevity-tls-1tb-7d-4-4-db-node-ed5a6bb8-0-1 ~]$ cat /etc/scylla.d/io_properties.yaml
disks:
- mountpoint: /var/lib/scylla
  read_bandwidth: 4152360960
  read_iops: 1020000
  write_bandwidth: 2202009600
  write_iops: 540000
well - it seems io_tune doesn't agree with the numbers we preset
read/write bandwidth is 50% of what we provisioned and read_iops/write_iops are also lower then we preset
@tarzanek - @bentsi - I know you ran a lot of tests to measure this - any view on why its off by so much ?
slivne
on 1 Feb 2021
where is above /etc/scylla.d/io_properties.yaml coming from?
it doesn't match to https://github.com/scylladb/scylla/blob/master/dist/common/scripts/scylla_io_setup#L247
so I don't think it's preset
tarzanek
on 2 Feb 2021
Unfortunately even after fixing the io_properties
[shlomi@longevity-tls-1tb-7d-4-4-db-node-7d4e98f8-0-1 ~]$ cat /etc/scylla.d/io_properties.yaml
disks:
- mountpoint: /var/lib/scylla
  read_bandwidth: 2778726400
  read_iops: 680000
  write_bandwidth: 1468006400
  write_iops: 360000
[shlomi@longevity-tls-1t
still iostat shows w_await
avg-cpu:  %user   %nice %system %iowait  %steal   %idle
          14.90    0.00   85.10    0.00    0.00    0.00

Device            r/s     w/s     rkB/s     wkB/s   rrqm/s   wrqm/s  %rrqm  %wrqm r_await w_await aqu-sz rareq-sz wareq-sz  svctm  %util
nvme0n1          0.00  242.50      0.00  14762.00     0.00     0.00   0.00   0.00    0.00    3.33   1.58     0.00    60.87   3.48  84.40
nvme0n2          0.00  210.00      0.00  14856.00     0.00     0.00   0.00   0.00    0.00    3.67   1.51     0.00    70.74   3.82  80.20
nvme0n3          0.00  181.50      0.00  12466.00     0.00     0.00   0.00   0.00    0.00    4.10   1.46     0.00    68.68   4.30  78.10
nvme0n4          0.00  171.50      0.00  11138.00     0.00     0.00   0.00   0.00    0.00    4.34   1.47     0.00    64.94   4.57  78.45
nvme0n5          0.00  165.00      0.00  10526.00     0.00     0.00   0.00   0.00    0.00    4.19   1.36     0.00    63.79   4.48  74.00
nvme0n6          0.00  178.00      0.00  12036.00     0.00     0.00   0.00   0.00    0.00    4.28   1.50     0.00    67.62   4.48  79.70
sda              0.00    0.50      0.00      2.00     0.00     0.00   0.00   0.00    0.00    1.00   0.00     0.00     4.00   1.00   0.05
md0              0.00  887.00      0.00  75786.00     0.00     0.00   0.00   0.00    0.00    7.73   6.86     0.00    85.44   1.13 100.40
something is still off - compared to our settings
slivne
on 2 Feb 2021
@slivne check kernel version
slivne
on 7 Feb 2021
@slivne is that change enough to close this one ?
fruch
on 11 Feb 2021
AFAIK: no its not it will make it better but doesn't solve it
slivne
on 11 Feb 2021
I tried one approach, of stopping compaction all together using
NullCompaction, and it see like it's much more stable like that:it's almost done writing the 1Tb:
http://34.73.252.148:3000/d/CGwxZ1cMz/scylla-per-server-metrics-nemesis-master?orgId=1&from=now-6h&to=now&refresh=30sI'm writing from 2 loader at 80K rate-limit, and writes to disk are at 130-190 MB/s, (When compaction was on, we go to almost 1.2 GB/s writes to disk, each time timeouts started)
something in scylla limits/throttle of the disk isn't working as we expect... (and used to see in AWS)
or thewrite_bandwidth: 1468006400we hardcode base on iotune runs done, is too high ?
@fruch A small comment/question: what would you expect to see as "throttling" from scylla other than timeouts (which you do see)?
vladzcloudius
on 11 Feb 2021
I tested with Ubuntu20.04 on GCE with the same setup and same number of nodes and same number of disks its not any better
for the record this is the Ubuntu20.04 kernel I tested with
Linux sl-scylla-node1 5.4.0-1036-gcp #39-Ubuntu SMP Thu Jan 14 18:41:17 UTC 2021 x86_64 x86_64 x86_64 GNU/Linux
iostat numbers
avg-cpu:  %user   %nice %system %iowait  %steal   %idle
          60.83    0.00   30.60    0.00    0.00    8.57

Device            r/s     rkB/s   rrqm/s  %rrqm r_await rareq-sz     w/s     wkB/s   wrqm/s  %wrqm w_await wareq-sz     d/s     dkB/s   drqm/s  %drqm d_await dareq-sz  aqu-sz  %util
md1           1027.50 120962.00     0.00   0.00    0.00   117.72 2022.00 237000.00     0.00   0.00    0.00   117.21    0.00      0.00     0.00   0.00    0.00     0.00    0.00   0.00
nvme0n1        174.00  19586.00     0.00   0.00    0.30   112.56  367.00  38510.00     0.00   0.00    1.87   104.93    0.00      0.00     0.00   0.00    0.00     0.00    0.56  84.00
nvme0n2        176.00  19898.00     0.00   0.00    0.29   113.06  360.50  37280.00     0.00   0.00    1.97   103.41    0.00      0.00     0.00   0.00    0.00     0.00    0.58  85.20
nvme0n3        165.50  18674.00     0.00   0.00    0.35   112.83  363.50  38188.00     0.00   0.00    2.46   105.06    0.00      0.00     0.00   0.00    0.00     0.00    0.74  84.00
nvme0n4        167.50  18756.00     0.00   0.00    0.35   111.98  378.00  39662.00     0.00   0.00    2.36   104.93    0.00      0.00     0.00   0.00    0.00     0.00    0.74  85.40
nvme0n5        174.00  19188.00     0.00   0.00    0.35   110.28  379.00  39242.00     0.00   0.00    2.36   103.54    0.00      0.00     0.00   0.00    0.00     0.00    0.74  85.00
nvme0n6        171.00  18946.00     0.00   0.00    0.34   110.80  386.00  38508.00     0.00   0.00    2.30    99.76    0.00      0.00     0.00   0.00    0.00     0.00    0.73  84.80
(and yes its after setting the numbers correctly - using the fix above)
Since the load does work on AWS and in theory if io_tune measures the same bandwidth (or more) we should be able todo the same we have an issue.
Options are:
- tuning numbers we place by io_tune are off.
- something is off in the settings and thats why w_await is higher.
slivne
on 11 Feb 2021
Backported to 4.3, 4.4. GCP support was not there in 4.2.
avikivity
on 14 Feb 2021
@xemul when you start looking at this ping me and I'll try to get you up to speed with what I know and what you presetup by QA to reproduce this.
slivne
on 17 Feb 2021
Same issue happens at the beginning of the test run:
Installation details
Scylla version (or git commit hash): 4.4.rc1-0.20210210.5b6c28428
Cluster size: 6 nodes (n1-highmem-16)
OS (RHEL/CentOS/Ubuntu/AWS AMI): - (gce: eu-west-1)
Test: longevity-10gb-3h-GCE-test
Test name: longevity_test.LongevityTest.test_custom_time
Test config file(s):
- [longevity-10gb-3h.yaml] (https://github.com/scylladb/scylla-cluster-tests/blob/fbdb9b807f3dd592124b00f788f51ccd233df6c6/test-cases/longevity/longevity-10gb-3h.yaml)
Restore Monitor Stack command: $ hydra investigate show-monitor 2621b33e-90f3-4bd7-8c57-7842e3457452
Show all stored logs command: $ hydra investigate show-logs 2621b33e-90f3-4bd7-8c57-7842e3457452
Test id: 2621b33e-90f3-4bd7-8c57-7842e3457452
Logs:
db-cluster - https://cloudius-jenkins-test.s3.amazonaws.com/2621b33e-90f3-4bd7-8c57-7842e3457452/20210212_065650/db-cluster-2621b33e.zip
loader-set - https://cloudius-jenkins-test.s3.amazonaws.com/2621b33e-90f3-4bd7-8c57-7842e3457452/20210212_065650/loader-set-2621b33e.zip
monitor-set - https://cloudius-jenkins-test.s3.amazonaws.com/2621b33e-90f3-4bd7-8c57-7842e3457452/20210212_065650/monitor-set-2621b33e.zip
sct-runner - https://cloudius-jenkins-test.s3.amazonaws.com/2621b33e-90f3-4bd7-8c57-7842e3457452/20210212_065650/sct-runner-2621b33e.zip
bentsi
on 28 Feb 2021
@bentsi what is the alignment of timeouts in client versus server?
scylla is by default 10s reads, 5s writes (and 10s range reads)
what are the client side timeouts ? (also defaults? or you give there some time to accommodate network time)
also as Vlad suggested, if this is an overload of cluster due to parallelism (we know disks are slower and also for certain number of disks you need certain number of cpus - https://cloud.google.com/compute/docs/disks/local-ssd#performance - 24 cpus for n2 if you want more than 8 nvmes and 32 cpus for n1) , it could just be a retry storm (hence my timeout Q)
the other thing I saw in current GCP cloud customers was the cluster when overloaded wasn't able to keep up with hints, disabling hints also got above spikes under control
can you ping me next time when you will have the monitoring with above test up so I can check above theories?
(I will try above hydra command, too)
tarzanek
on 2 Mar 2021
@fruch , regarding the
Disks: (SSD/HDD, count) Nvme 8/6 disks
were they just joined into a linear raid?
 xemul
on 11 Mar 2021
xemul
on 11 Mar 2021
@fruch , regarding the
Disks: (SSD/HDD, count) Nvme 8/6 disks
were they just joined into a linear raid?
I believe that's what scylla_setup is doing automatically (@bentsi correct me if i'm wrong)
fruch
on 11 Mar 2021
Inside GCP writing to a file slows down 2 to 4 times starting at some file size and restores back to expected throughput after file grows to some another "threshold". It depends on the number of disks in array and the raid chunk size (1k is set by scylla_io_setup, 512 is default for mdadm). I observed steady throughput only in 3 cases:
- no raid, just 1 plain disk
- 4 disks raid with 4k chunk size
- SUDDENLY ext4 (any size raid with 512 chunk)
xemul
on 11 Mar 2021
On Thu, Mar 11, 2021 at 7:33 PM Pavel Emelyanov @.*>
wrote:
Inside GCP writing to a file slows down 2 to 4 times starting at some file
size and restores back to expected throughput after file grows to some
another "threshold". It depends on the number of disks in array and the
raid chunk size (1k is set by scylla_io_setup, 512 is default for mdadm). I
observed steady throughput only in 2 cases:WOW ... nice detective work.
>
- 4 disks raid with 4k chunk size
I think we currently format to 4K ... but wanted to move to 1K
https://github.com/scylladb/scylla/issues/8156
@Avi Kivity @.*> any known issue with xfs on raid-0 non ^2
setups ?
On awsI think we always have a ^2 setups 1,2,4,8,16 ... and I don;t recall
hitting this at all.
- SUDDENLY ext4 (any size raid with 512 chunk)
—
You are receiving this because you modified the open/close state.
Reply to this email directly, view it on GitHub
https://github.com/scylladb/scylla/issues/7341#issuecomment-796911207,
or unsubscribe
https://github.com/notifications/unsubscribe-auth/AA2OCCAW7QYJ756KMY7R5FDTDD5FDANCNFSM4SFUGCQQ
.
slivne
on 11 Mar 2021
@avikivity ping - need help on this issue - we are seeing bad performance from XFS on raids with 6 disks (https://github.com/scylladb/scylla/issues/7341#issuecomment-796911207) any input can help.
@roydahan / @fruch / @bentsi - please change the tests and run with 8 disks for now and lets see if this passes - while we try to figure out what todo in the general case
slivne
on 14 Mar 2021
Note: @slivne says we saw stalls, so the below assumes the root cause are stalls.
It's possible that XFS has a conflict between attempting to align on a stripe boundary and the extent size hint. Our stripes are 1MB, so if it tries to align a 32MB extent on a 6MB boundary (although, it should rather align on a 1MB boundary) it may have trouble.
It's also possible that my RWF_NOWAIT patch[1] will fix it.
[1] https://groups.google.com/g/seastar-dev/c/6wdlhuLBSCs/m/9TtO348GAgAJ
avikivity
on 14 Mar 2021
On Sun, Mar 14, 2021 at 2:18 PM Avi Kivity @.*> wrote:
Note: @slivne https://github.com/slivne says we saw stalls, so the
below assumes the root cause are stalls.
My bad not scylla stalls
we saw iostatt with w_await
It's possible that XFS has a conflict between attempting to align on a
stripe boundary and the extent size hint. Our stripes are 1MB, so if it
tries to align a 32MB extent on a 6MB boundary (although, it should rather
align on a 1MB boundary) it may have trouble.It's also possible that my RWF_NOWAIT patch[1] will fix it.
[1] https://groups.google.com/g/seastar-dev/c/6wdlhuLBSCs/m/9TtO348GAgAJ
—
You are receiving this because you were mentioned.
Reply to this email directly, view it on GitHub
https://github.com/scylladb/scylla/issues/7341#issuecomment-798897334,
or unsubscribe
https://github.com/notifications/unsubscribe-auth/AA2OCCGXYKOVCITG3N2COFLTDSSSJANCNFSM4SFUGCQQ
.
slivne
on 14 Mar 2021
@slivne
Ran the test with the 8 disks. The issue still exists
There are a lot of failed writes and timeouts
Installation details
Scylla version (or git commit hash): 4.4.rc4-0.20210311.ec20ff098
Cluster size: 6 nodes (i3.4xlarge)
OS (RHEL/CentOS/Ubuntu/AWS AMI): - (gce: eu-west-1)
Test: bentsi-longevity-10gb-3h-GCE-test
Test name: longevity_test.LongevityTest.test_custom_time
Test config file(s):
Restore Monitor Stack command: $ hydra investigate show-monitor 815a03b7-d24f-4c2b-8faa-fd93f14a5ea5
Show all stored logs command: $ hydra investigate show-logs 815a03b7-d24f-4c2b-8faa-fd93f14a5ea5
Test id: 815a03b7-d24f-4c2b-8faa-fd93f14a5ea5
Logs:
grafana - https://cloudius-jenkins-test.s3.amazonaws.com/815a03b7-d24f-4c2b-8faa-fd93f14a5ea5/20210314_210709/grafana-screenshot-bentsi-longevity-10gb-3h-gce-test-scylla-per-server-metrics-nemesis-20210314_211526-longevity-10gb-3h-gce-long-monitor-node-815a03b7-0-1.png
grafana - https://cloudius-jenkins-test.s3.amazonaws.com/815a03b7-d24f-4c2b-8faa-fd93f14a5ea5/20210314_210709/grafana-screenshot-overview-20210314_210709-longevity-10gb-3h-gce-long-monitor-node-815a03b7-0-1.png
db-cluster - https://cloudius-jenkins-test.s3.amazonaws.com/815a03b7-d24f-4c2b-8faa-fd93f14a5ea5/20210314_223239/db-cluster-815a03b7.zip
loader-set - https://cloudius-jenkins-test.s3.amazonaws.com/815a03b7-d24f-4c2b-8faa-fd93f14a5ea5/20210314_223239/loader-set-815a03b7.zip
monitor-set - https://cloudius-jenkins-test.s3.amazonaws.com/815a03b7-d24f-4c2b-8faa-fd93f14a5ea5/20210314_223239/monitor-set-815a03b7.zip
sct-runner - https://cloudius-jenkins-test.s3.amazonaws.com/815a03b7-d24f-4c2b-8faa-fd93f14a5ea5/20210314_223239/sct-runner-815a03b7.zip
bentsi
on 15 Mar 2021
@slivne , are you comparing i3.4xlarge vs n1-highmem-16? They have RAM 122 GB vs 102 GB respectively, it's far from apple-to-apple.
xemul
on 15 Mar 2021
The latest scylla checked here (ec20ff098) has seastar version 2c884a74 which, in turn, is missing two important fixes for fair-groups: 98366fd5 (fair_queue: Improve requests preemption while in pending state) and 52d41277 (fair_queue: Preempted requests got re-queued too far)
Also I've noticed that the tested version still has #3247 which sometimes causes stalls on memory pressure.
xemul
on 15 Mar 2021
@avikivity - @xemul refers here two patches in seastar that are not part of 4.4 - my translation from his comment is that we need them :)
@bentsi - ok lets play along with @xemul request - please change the test to be n2-highmem-16 - that has 16 cores and 128 GB of memory.
I expect the memory is not the factor - causing us issues - but lets double check that.
slivne
on 15 Mar 2021
@slivne , @bentsi , I'd prefer if 4k raid chink size was checked (until I find out how to setup the test myself), I don't think memory is the key factor either.
xemul
on 15 Mar 2021
I observed steady throughput only in 3 cases:
- no raid, just 1 plain disk
- 4 disks raid with 4k chunk size
- SUDDENLY ext4 (any size raid with 512 chunk)
In 4 cases -- when the file is file::allocate()ed explicitly by its known future size (iotune and io_tester both know it).
xemul
on 15 Mar 2021
Checked on centos-8-stream (4.18.0-277.el8.x86_64 kernel, which's quite old, but still) with 8 nvmes raid0, 512 chunk.
Appending write throughput with extent size hint is 800MB/s , but if fallocateing the file in advance -- 1300MB/s and it's stable, without the gap around 80G seen before.
@avikivity , please suggest which one is better: find the kernel with xfs that works, stick to the configuration that works (4k chunk size seems to, but it may change after #8156), try to find a way in scylla/seastar to fallocate the space in advance.
xemul
on 16 Mar 2021
fwiw we use for the GCP customers Centos 8 + 5.11 kernel (latest elrepo) and it sustains few GB speeds for read
the tests I did for io_setup used Ubuntu (the scripts I used should have exact kernel number - they say the image was ubuntu-1804-bionic-v20200529 so I expect some 4.x kernel)
tarzanek
on 16 Mar 2021
@bentsi @fruch how do you guys count how many threads to use for cassandra-stress commands?
tarzanek
on 16 Mar 2021
On ELRepo's kernel (5.11.6-1.el8.elrepo.x86_64) the situation is a bit worse. On default 8-disks raid the steady write throughput is 1.3GB/s (versus 1.4GB/s expected and configured by scylla_io_setup), and "after a while" it drops down to ~280MBs (4.5 times drop) (and then goes back up again).
xemul
on 16 Mar 2021
On ELRepo's kernel (5.11.6-1.el8.elrepo.x86_64) the situation is a bit worse. On default 8-disks raid the steady write throughput is 1.3GB/s (versus 1.4GB/s expected and configured by
scylla_io_setup), and "after a while" it drops down to ~280MBs (4.5 times drop) (and then goes back up again).
Hmmm... That's rather disturbing.
vladzcloudius
on 16 Mar 2021
We need to support 4.18, but if we know for a fact that a newer kernel works better, we can recommend that users use this newer kernel.
avikivity
on 17 Mar 2021
On ELRepo's kernel (5.11.6-1.el8.elrepo.x86_64) the situation is a bit worse. On default 8-disks raid the steady write throughput is 1.3GB/s (versus 1.4GB/s expected and configured by
scylla_io_setup), and "after a while" it drops down to ~280MBs (4.5 times drop) (and then goes back up again).
Well, we need to understand what's going on. Maybe there is a huge write-back cache, and the 1.3GB/s is write-to-cache speed, then the kernel issues a cache flush and our writes compete with the cache writing to disk.
We can try disabling the write cache (echo 'write through' > /sys/block/blah/queue/write_cache`). Many disks don't support it, but I know GCP does.
avikivity
on 17 Mar 2021
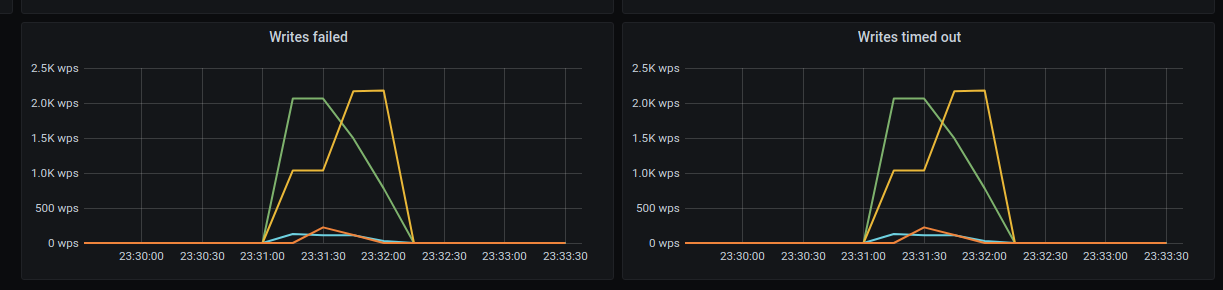
Ran Scylla 4.4.rc4 on GCE image 766759920189183437 with 8 disks on n2-highmem-16 and the issue still exists
Write timeouts
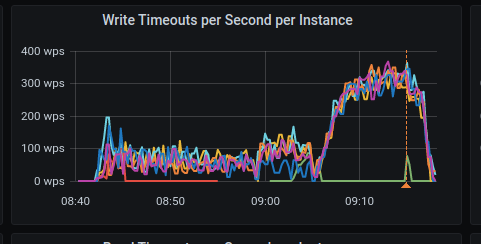
Writes failed
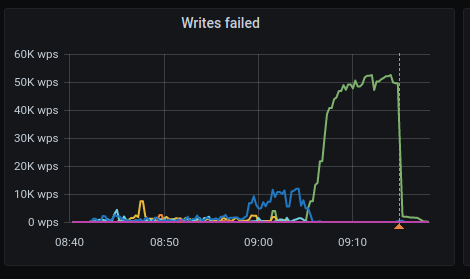
Monitor: hydra investigate show-monitor 36169f91-5b9e-4435-8fe9-8b714195d863
bentsi
on 17 Mar 2021
I get
Going to run './sct.py investigate show-monitor 36169f91-5b9e-4435-8fe9-8b714195d863'...
Error: mkdir `secrets`: Permission denied: OCI permission denied
I use podman instead of docker.
avikivity
on 18 Mar 2021
Switching nvme write_cache to write-through made the write bandwidth stable at ~1.6GB/s all the time.
xemul
on 18 Mar 2021
I get
Going to run './sct.py investigate show-monitor 36169f91-5b9e-4435-8fe9-8b714195d863'...
Error: mkdir `secrets`: Permission denied: OCI permission denied
I use podman instead of docker.
You should definitely ask for podman support in SCT to be on the roadmap.
fruch
on 18 Mar 2021
Switching nvme write_cache to write-through made the write bandwidth stable at ~1.6GB/s all the time.
That's interesting. 5.11 kernel, right, @xemul?
I'll prepare a perftune.py option to disable write_cache.
@tarzanek I'll ping you when it's ready.
vladzcloudius
on 18 Mar 2021
@vladzcloudius , no this time it was ubuntu 20.04 default one.
xemul
on 18 Mar 2021
@vladzcloudius , no this time it was ubuntu 20.04 default one.
And do we have a "rate hole" with write_cache with this kernel, @xemul ?
vladzcloudius
on 18 Mar 2021
Switching nvme write_cache to write-through made the write bandwidth stable at ~1.6GB/s all the time.
That's interesting. 5.11 kernel, right, @xemul?
I'll prepare a perftune.py option to disablewrite_cache.
@tarzanek I'll ping you when it's ready.
https://github.com/scylladb/seastar/pull/881
@xemul @avikivity @fruch @tarzanek FYI ^
vladzcloudius
on 18 Mar 2021
And do we have a "rate hole" with write_cache with this kernel, @xemul ?
@vladzcloudius , yes. I've seen it on pretty much every kernel except for some ancient one, where the performance was just bad (this "hole" spaned all the time).
xemul
on 19 Mar 2021
I get
Going to run './sct.py investigate show-monitor 36169f91-5b9e-4435-8fe9-8b714195d863'...
Error: mkdir `secrets`: Permission denied: OCI permission denied
I use podman instead of docker.
You should definitely ask for podman support in SCT to be on the roadmap.
Please add podman support in SCT to the roadmap.
avikivity
on 21 Mar 2021
Asked to share this from Scylla Slack. Chiming in due to running into similar timeout issues that were experienced in this thread that may have causally been solved by the write through config change.
Scylla version: 4.2.3 (due to #8032)
Kernel: 5.4.0-1030-gke #32~18.04.1-Ubuntu SMP Tue Nov 17 16:43:22 UTC 2020 x86_64 x86_64 x86_64 GNU/Linux
Previous setup
Instance: 6x n2-custom-10-24576 on GKE with 2 local SCSI SSDs with default cache config
After pushing ~30k write op/s over extended period I would see severe timeouts and latency spikes at high frequency like so:
New setup
Instance: 6x n2-highmem-8 on GKE with 8 local SCSI SSDs with write through cache
After 12+ hours of constant writes pushing 60k write op/s I captured not a single timeout or spike in average write latency.
The n2-highmem-8 GKE instance wasn't detected and was tuned to following.
read_iops: 720319
    read_bandwidth: 2568414720
    write_iops: 400339
    write_bandwidth: 1639328512
Did not manage to save the tuning from the custom instance.
While there were multiple variables changed between the setups (cpu, memory, # disks) such that it's not exactly apples to apples, it's worth further investigating the write cache as having potentially made the major difference.
Also note that cassandra-stress wasn't used here in favor of our own custom workload, so this benchmark is purely anecdotal. The workload was effectively the same between runs with 30-45 distributed workers pushing small 1kb writes.
 ChrisHampu
on 24 Mar 2021
ChrisHampu
on 24 Mar 2021
seastar patch was merged - so there is a way to disable write_back cache but we need now to add the setting when creating the devices in GCE image
slivne
on 14 Apr 2021
I am trying to understand the scope of what's still needed. We need to pass --write-back-cache=false to perftune.py on GCE, right? Which instances? Where's the right place to wire up this? @syuu1228 @fruch @tarzanek
 penberg
on 14 Apr 2021
penberg
on 14 Apr 2021
I am trying to understand the scope of what's still needed. We need to pass
--write-back-cache=falsetoperftune.pyon GCE, right?
Correct, @penberg
vladzcloudius
on 14 Apr 2021
@penberg ping
slivne
on 19 Apr 2021
just on the testing side of this (since I see the graphs of patched and unpatched systems in front of me)
customer runs janusgraph spark job every X minutes and the drop of disk read speed (10G/s) with disabled writeback cache is just visible when they write, picture attached (I think we even go higher than max speed 9 360 MB/s - so wondering if io_properties are even getting obeyed ;-) )
without the patch the reads maximum seem to be stuck around 7.5G , so this was very good sleuthing Pavel, thank you!
tarzanek
on 22 Apr 2021
Last run on master looks much better.
https://snapshot.raintank.io/dashboard/snapshot/Yyepci6dFyB1XPxbwWad6GbH4uNBHgS7
However, some stress runs still failing, investigating why.
roydahan
on 20 May 2021
The failing stress commands are not related.
I think we can close this issue.
@slivne FYI
roydahan
on 20 May 2021
Related issues
 tgrabiec
·
6Comments
tgrabiec
·
6Comments
 amoskong
·
6Comments
amoskong
·
6Comments
 LouayKamel
·
6Comments
LouayKamel
·
6Comments
 Ritaja
·
3Comments
Ritaja
·
3Comments
 pdziepak
·
6Comments
pdziepak
·
6Comments