Scylla: nodetool repair failed on target node and another node goes to status DN
Installation details
Scylla version (or git commit hash): Scylla version 4.2.rc2-0.20200810.0ce3799187c with build-id fa7b6ed9379c15526c5f6507e7ca4dff217427c9
Cluster size: 6
OS (RHEL/CentOS/Ubuntu/AWS AMI): ami-00ff43fdf830abda7
Job with longevity-cdc-100gb-4h-test was failed, after node2 was detected with status DN.
Cluster consists of 6 nodes.
First on node2 was running the nemesis RebuildStreamingErr. the nemesis logic is: Stop scylla, corrupt some files, start scylla. wait while repair process is started and do hard reboot the instance. after instance will be booted and scylla up, run nodetool rebuild command.
This process was failed with issue #6645.
In 30 minutes on node6 another nemesis RestartThenRepairNode. The instances is restarted and after it is up and scylla is running run nodetool repair.
before nemesis is started:
 Datacenter: eu-north
 ====================
 Status=Up/Down
 |/ State=Normal/Leaving/Joining/Moving
 --  Address     Load       Tokens       Owns    Host ID                               Rack
 UN  10.0.1.128  5.72 GB    256          ?       5139d240-de22-49ed-b52d-d4a52d4d43a9  1a < ---- node 2
 UN  10.0.0.209  3.43 GB    256          ?       52270b7a-7e56-4523-926c-0962ec57ec27  1a
 UN  10.0.3.130  3.07 GB    256          ?       0709d2e4-ef49-48cf-89b7-e86c18326772  1a
 UN  10.0.3.25   3.38 GB    256          ?       2a8144e1-0e26-4097-addb-b59b2f9e10b1  1a
 UN  10.0.1.233  3.44 GB    256          ?       657af1ab-420b-47ec-b0d5-636afe6a13ad  1a
 UN  10.0.2.222  3.16 GB    256          ?       b54f0477-6207-46cb-807f-1d1442cb72ca  1a
the command on node6 failed with error:
Command: 'nodetool  repair '

Exit code: 2

Stdout:

[2020-08-11 13:34:01,238] Starting repair command #1, repairing 1 ranges for keyspace system_traces (parallelism=SEQUENTIAL, full=true)
[2020-08-11 13:37:15,388] Repair session 1
[2020-08-11 13:37:15,395] Repair session 1 finished
[2020-08-11 13:37:15,435] Starting repair command #2, repairing 1 ranges for keyspace cdc_test (parallelism=SEQUENTIAL, full=true)
[2020-08-11 14:11:14,119] Repair session 2 failed
[2020-08-11 14:11:14,121] Repair session 2 finished

Stderr:

error: Repair job has failed with the error message: [2020-08-11 14:11:14,119] Repair session 2 failed
-- StackTrace --
java.lang.RuntimeException: Repair job has failed with the error message: [2020-08-11 14:11:14,119] Repair session 2 failed
    at org.apache.cassandra.tools.RepairRunner.progress(RepairRunner.java:124)
    at org.apache.cassandra.utils.progress.jmx.JMXNotificationProgressListener.handleNotification(JMXNotificationProgressListener.java:77)
    at com.sun.jmx.remote.internal.ClientNotifForwarder$NotifFetcher.dispatchNotification(ClientNotifForwarder.java:583)
    at com.sun.jmx.remote.internal.ClientNotifForwarder$NotifFetcher.doRun(ClientNotifForwarder.java:533)
    at com.sun.jmx.remote.internal.ClientNotifForwarder$NotifFetcher.run(ClientNotifForwarder.java:452)
    at com.sun.jmx.remote.internal.ClientNotifForwarder$LinearExecutor$1.run(ClientNotifForwarder.java:108)
Also nodetool status was run on all nodes shows that node has DN status:
  Datacenter: eu-north
  ====================
  Status=Up/Down
|/ State=Normal/Leaving/Joining/Moving
--  Address     Load       Tokens       Owns    Host ID                               Rack
DN  10.0.1.128  6.16 GB    256          ?       5139d240-de22-49ed-b52d-d4a52d4d43a9  1a <---- node2
UN  10.0.0.209  3.51 GB    256          ?       52270b7a-7e56-4523-926c-0962ec57ec27  1a
UN  10.0.3.130  3.25 GB    256          ?       0709d2e4-ef49-48cf-89b7-e86c18326772  1a
UN  10.0.3.25   3.34 GB    256          ?       2a8144e1-0e26-4097-addb-b59b2f9e10b1  1a
UN  10.0.1.233  3.4 GB     256          ?       657af1ab-420b-47ec-b0d5-636afe6a13ad  1a
UN  10.0.2.222  3.18 GB    256          ?       b54f0477-6207-46cb-807f-1d1442cb72ca
In log of node2 there is only next warning and errors:
mp_service_group#2 7->10 semaphore)
2020-08-11T14:17:51+00:00  longevity-cdc-100gb-4h-master-db-node-a16fad0b-2 !WARNING | scylla: [shard 10] storage_proxy - Failed to apply mutation from 10.0.3.25#10: seastar::named_semaphore_timed_out (Semaphore timed out: smp_service_group#2 7->10 semaphore)
2020-08-11T14:17:51+00:00  longevity-cdc-100gb-4h-master-db-node-a16fad0b-2 !WARNING | scylla: [shard 10] storage_proxy - Failed to apply mutation from 10.0.3.25#10: seastar::named_semaphore_timed_out (Semaphore timed out: smp_service_group#2 7->10 semaphore)
2020-08-11T14:17:51+00:00  longevity-cdc-100gb-4h-master-db-node-a16fad0b-2 !WARNING | scylla: [shard 10] storage_proxy - Failed to apply mutation from 10.0.3.25#10: seastar::named_semaphore_timed_out (Semaphore timed out: smp_service_group#2 11->10 semaphore)
2020-08-11T14:17:51+00:00  longevity-cdc-100gb-4h-master-db-node-a16fad0b-2 !WARNING | scylla: [shard 10] storage_proxy - Failed to apply mutation from 10.0.3.25#10: seastar::named_semaphore_timed_out (Semaphore timed out: smp_service_group#2 11->10 semaphore)
2020-08-11T14:17:51+00:00  longevity-cdc-100gb-4h-master-db-node-a16fad0b-2 !WARNING | scylla: [shard 10] storage_proxy - Failed to apply mutation from 10.0.3.25#10: seastar::named_semaphore_timed_out (Semaphore timed out: smp_service_group#2 7->10 semaphore)
2020-08-11T14:17:51+00:00  longevity-cdc-100gb-4h-master-db-node-a16fad0b-2 !WARNING | scylla: [shard 10] storage_proxy - Failed to apply mutation from 10.0.3.25#10: seastar::named_semaphore_timed_out (Semaphore timed out: smp_service_group#2 7->10 semaphore)
2020-08-11T14:17:51+00:00  longevity-cdc-100gb-4h-master-db-node-a16fad0b-2 !WARNING | scylla: [shard 10] storage_proxy - Failed to apply mutation from 10.0.3.25#10: seastar::named_semaphore_timed_out (Semaphore timed out: smp_service_group#2 11->10 semaphore)
Logs of node2 and node6:
system.log.tar.gz
system.log.tar.gz
 aleksbykov
All 95 comments
@aleksbykov if the second rebuild during RebuildStreamingErr on node2 failed, this nemesis may have left the node with missing data.
I don’t know if this is the cause of the failed repair (doesn’t look like) but just to be aware of it.
 roydahan
on 16 Aug 2020
roydahan
on 16 Aug 2020
@asias this a case of repair without MVs that is failing - we need to understand the source.
 slivne
on 17 Aug 2020
slivne
on 17 Aug 2020
I am not sure what is the problem here.
Node6 ran repair. The repair failed because one of the repair followers, node6, is down. The repair kept going to do a partial repair (ignoring the node that is down) and reported the repair failed. There was no hang.
`
Aug 11 13:36:27 longevity-cdc-100gb-4h-master-db-node-a16fad0b-6 scylla[6406]:  [shard 5] repair - repair id 1 on shard 5 stats: ranges_nr=522, sub_ranges_nr=2610, round_nr=2610, round_nr_fast_path_already_synced=2610, round_nr_fas
t_path_same_combined_hashes=0, round_nr_slow_path=0, rpc_call_nr=13050, tx_hashes_nr=0, rx_hashes_nr=0, duration=145.811 seconds, tx_row_nr=0, rx_row_nr=0, tx_row_bytes=0, rx_row_bytes=0, row_from_disk_bytes={{10.0.0.209, 0}, {10.0
.1.128, 0}, {10.0.1.233, 0}, {10.0.2.222, 0}, {10.0.3.130, 0}, {10.0.3.25, 0}}, row_from_disk_nr={{10.0.0.209, 0}, {10.0.1.128, 0}, {10.0.1.233, 0}, {10.0.2.222, 0}, {10.0.3.130, 0}, {10.0.3.25, 0}}, row_from_disk_bytes_per_sec={{1
0.0.0.209, 0}, {10.0.1.128, 0}, {10.0.1.233, 0}, {10.0.2.222, 0}, {10.0.3.130, 0}, {10.0.3.25, 0}} MiB/s, row_from_disk_rows_per_sec={{10.0.0.209, 0}, {10.0.1.128, 0}, {10.0.1.233, 0}, {10.0.2.222, 0}, {10.0.3.130, 0}, {10.0.3.25,
0}} Rows/s, tx_row_nr_peer={}, rx_row_nr_peer={}
Aug 11 13:37:14 longevity-cdc-100gb-4h-master-db-node-a16fad0b-6 scylla[6406]:  [shard 4] repair - repair id 1 on shard 4 stats: ranges_nr=522, sub_ranges_nr=2610, round_nr=2610, round_nr_fast_path_already_synced=2610, round_nr_fas
t_path_same_combined_hashes=0, round_nr_slow_path=0, rpc_call_nr=13050, tx_hashes_nr=0, rx_hashes_nr=0, duration=193.214 seconds, tx_row_nr=0, rx_row_nr=0, tx_row_bytes=0, rx_row_bytes=0, row_from_disk_bytes={{10.0.0.209, 0}, {10.0
.1.128, 0}, {10.0.1.233, 0}, {10.0.2.222, 0}, {10.0.3.130, 0}, {10.0.3.25, 0}}, row_from_disk_nr={{10.0.0.209, 0}, {10.0.1.128, 0}, {10.0.1.233, 0}, {10.0.2.222, 0}, {10.0.3.130, 0}, {10.0.3.25, 0}}, row_from_disk_bytes_per_sec={{1
0.0.0.209, 0}, {10.0.1.128, 0}, {10.0.1.233, 0}, {10.0.2.222, 0}, {10.0.3.130, 0}, {10.0.3.25, 0}} MiB/s, row_from_disk_rows_per_sec={{10.0.0.209, 0}, {10.0.1.128, 0}, {10.0.1.233, 0}, {10.0.2.222, 0}, {10.0.3.130, 0}, {10.0.3.25,
0}} Rows/s, tx_row_nr_peer={}, rx_row_nr_peer={}
Aug 11 13:56:21 longevity-cdc-100gb-4h-master-db-node-a16fad0b-6 scylla[6406]:  [shard 0] gossip - InetAddress 10.0.1.128 is now DOWN, status = NORMAL
Aug 11 13:56:21 longevity-cdc-100gb-4h-master-db-node-a16fad0b-6 scylla[6406]:  [shard 2] repair - Repair 658 out of 788 ranges, id=2, shard=2, keyspace=cdc_test, table={test_table_scylla_cdc_log, test_table_preimage_scylla_cdc_log
, test_table_preimage_postimage, test_table, test_table_preimage, test_table_preimage_postimage_scylla_cdc_log, test_table_postimage_scylla_cdc_log, test_table_postimage}, range=(6476723795618337253, 6477041610652894888], peers={10
.0.1.233, 10.0.1.128}, live_peers={10.0.1.233}, status=partial
Aug 11 13:56:21 longevity-cdc-100gb-4h-master-db-node-a16fad0b-6 scylla[6406]:  [shard 2] repair - Repair 659 out of 788 ranges, id=2, shard=2, keyspace=cdc_test, table={test_table_scylla_cdc_log, test_table_preimage_scylla_cdc_log
, test_table_preimage_postimage, test_table, test_table_preimage, test_table_preimage_postimage_scylla_cdc_log, test_table_postimage_scylla_cdc_log, test_table_postimage}, range=(6477041610652894888, 6480864625319568020], peers={10
.0.1.128, 10.0.1.233}, live_peers={10.0.1.233}, status=partial
Aug 11 13:56:21 longevity-cdc-100gb-4h-master-db-node-a16fad0b-6 scylla[6406]:  [shard 2] repair - Repair 660 out of 788 ranges, id=2, shard=2, keyspace=cdc_test, table={test_table_scylla_cdc_log, test_table_preimage_scylla_cdc_log
, test_table_preimage_postimage, test_table, test_table_preimage, test_table_preimage_postimage_scylla_cdc_log, test_table_postimage_scylla_cdc_log, test_table_postimage}, range=(6480864625319568020, 6481617732253464202], peers={10
.0.1.128, 10.0.1.233}, live_peers={10.0.1.233}, status=partial
Aug 11 13:56:21 longevity-cdc-100gb-4h-master-db-node-a16fad0b-6 scylla[6406]:  [shard 8] repair - Repair 296 out of 788 ranges, id=2, shard=8, keyspace=cdc_test, table={test_table_scylla_cdc_log, test_table_preimage_scylla_cdc_log
, test_table_preimage_postimage, test_table, test_table_preimage, test_table_preimage_postimage_scylla_cdc_log, test_table_postimage_scylla_cdc_log, test_table_postimage}, range=(-2157857570789305305, -2149763444011402449], peers={
10.0.1.233, 10.0.1.128}, live_peers={10.0.1.233}, status=partial
Aug 11 13:56:21 longevity-cdc-100gb-4h-master-db-node-a16fad0b-6 scylla[6406]:  [shard 8] repair - Repair 297 out of 788 ranges, id=2, shard=8, keyspace=cdc_test, table={test_table_scylla_cdc_log, test_table_preimage_scylla_cdc_log
, test_table_preimage_postimage, test_table, test_table_preimage, test_table_preimage_postimage_scylla_cdc_log, test_table_postimage_scylla_cdc_log, test_table_postimage}, range=(-2149763444011402449, -2142943403482343087], peers={
10.0.1.233, 10.0.1.128}, live_peers={10.0.1.233}, status=partial
Aug 11 13:56:21 longevity-cdc-100gb-4h-master-db-node-a16fad0b-6 scylla[6406]:  [shard 8] repair - Repair 298 out of 788 ranges, id=2, shard=8, keyspace=cdc_test, table={test_table_scylla_cdc_log, test_table_preimage_scylla_cdc_log
, test_table_preimage_postimage, test_table, test_table_preimage, test_table_preimage_postimage_scylla_cdc_log, test_table_postimage_scylla_cdc_log, test_table_postimage}, range=(-2142943403482343087, -2129062656343457559], peers={10.0.1.128, 10.0.2.222}, live_peers={10.0.2.222}, status=partial
Aug 11 13:56:22 longevity-cdc-100gb-4h-master-db-node-a16fad0b-6 scylla[6406]:  [shard 1] rpc - client 10.0.1.128:7000: client stream connection dropped: connection is closed
Aug 11 13:56:22 longevity-cdc-100gb-4h-master-db-node-a16fad0b-6 scylla[6406]:  [shard 1] rpc - client 10.0.1.128:7000: client stream connection dropped: connection is closed
Aug 11 13:56:22 longevity-cdc-100gb-4h-master-db-node-a16fad0b-6 scylla[6406]:  [shard 1] rpc - client 10.0.1.128:7000: client stream connection dropped: connection is closed
Aug 11 13:56:22 longevity-cdc-100gb-4h-master-db-node-a16fad0b-6 scylla[6406]:  [shard 12] rpc - client 10.0.1.128:7000: client stream connection dropped: connection is closed
Aug 11 13:56:22 longevity-cdc-100gb-4h-master-db-node-a16fad0b-6 scylla[6406]:  [shard 12] rpc - client 10.0.1.128:7000: client stream connection dropped: connection is closed
Aug 11 13:56:22 longevity-cdc-100gb-4h-master-db-node-a16fad0b-6 scylla[6406]:  [shard 12] rpc - client 10.0.1.128:7000: client stream connection dropped: connection is closed
Aug 11 13:56:22 longevity-cdc-100gb-4h-master-db-node-a16fad0b-6 scylla[6406]:  [shard 1] rpc - client 10.0.1.128:7000: client stream connection dropped: connection is closed
Aug 11 13:56:22 longevity-cdc-100gb-4h-master-db-node-a16fad0b-6 scylla[6406]:  [shard 6] rpc - client 10.0.1.128:7000: client stream connection dropped: connection is closed
Aug 11 13:56:22 longevity-cdc-100gb-4h-master-db-node-a16fad0b-6 scylla[6406]:  [shard 1] rpc - client 10.0.1.128:7000: client stream connection dropped: connection is closed
Aug 11 13:56:22 longevity-cdc-100gb-4h-master-db-node-a16fad0b-6 scylla[6406]:  [shard 7] rpc - client 10.0.1.128:7000: client stream connection dropped: connection is closed
Aug 11 13:56:22 longevity-cdc-100gb-4h-master-db-node-a16fad0b-6 scylla[6406]:  [shard 6] rpc - client 10.0.1.128:7000: client stream connection dropped: connection is closed
 asias
on 19 Aug 2020
asias
on 19 Aug 2020
So we need to understand why node6 went down - lets check if there is a core / check the logs in noe6
slivne
on 19 Aug 2020
I guess you meant why node2 went down.
Before node6 (repair master) marked node2 (repair follower) as down, node2 was overwhelmed with "storage_proxy: Failed to apply mutation from ... " errors.
There was 436K of such messages.
$ cat node2.txt |grep 'Failed to apply'|wc -l
436202
394663 Aug 11 13:54:27 longevity-cdc-100gb-4h-master-db-node-a16fad0b-2 scylla[1456]:  [shard 13] storage_proxy - Failed to apply mutation from 10.0.0.209#13: seastar::named_semaphore_timed_out (Semaphore timed out: smp_service_group#2 12->13 semaphore)
394664 Aug 11 13:54:27 longevity-cdc-100gb-4h-master-db-node-a16fad0b-2 scylla[1456]:  [shard 7] storage_proxy - Failed to apply mutation from 10.0.0.209#7: seastar::named_semaphore_timed_out (Semaphore timed out: smp_service_group#2 4->7 semaphore)
@eliransin it is smp_service_group, ideas?
asias
on 20 Aug 2020
@asias I have encountered it in other circumstances. I am pretty sure that it means that this is caused due to the write requests not being sent to the correct shard.
@gleb-cloudius implemented a semaphore to limit the amount of cross shard operations, this is because cross shard operations are very bad for performance.
The best lead I can give you for this is that somehow the hash functions that are used to dispatch the requests to shards mismatches the actual sharding function used to distribute the tokes.
The timeout is because we accumulate a huge queue of cross shard operations so the request are timing out while in the queue.
I am not an expert in this code but I can have a look, can you give me some general pointers of where to look for the repair code (I will look for a potential sharding mismatch of the kind mentioned above.
 eliransin
on 20 Aug 2020
eliransin
on 20 Aug 2020
@asias I have encountered it in other circumstances. I am pretty sure that it means that this is caused due to the write requests not being sent to the correct shard.
@gleb-cloudius implemented a semaphore to limit the amount of cross shard operations, this is because cross shard operations are very bad for performance.
The best lead I can give you for this is that somehow the hash functions that are used to dispatch the requests to shards mismatches the actual sharding function used to distribute the tokes.
The timeout is because we accumulate a huge queue of cross shard operations so the request are timing out while in the queue.
I am not an expert in this code but I can have a look, can you give me some general pointers of where to look for the repair code (I will look for a potential sharding mismatch of the kind mentioned above.
Check for smp::submit_to in repair/row_level.cc, and make_multishard_streaming_reader and multishard_writer. However since the shard config in the test are the same, so the multishard reader and writer would be a normal local reader / writer.
Please note, the log complained timeout in storage_proxy. Do you suspect repair used a lot of cross shard operation, the storage_proxy was the victim?
asias
on 20 Aug 2020
@asias / @gleb-cloudius ping
slivne
on 24 Aug 2020
@asias / @gleb-cloudius ping
slivne
on 25 Aug 2020
I am not sure what we can do in repair level. The system is loaded storage_proxy complains semaphore_timed_out. The scheduler is supposed to either slow down the queries or repair job.
asias
on 26 Aug 2020
Some more things to notice about the semaphore timeout:
the timeout only happen in group 2 (which i am almost 100% sure is the write smp service group).
Monitor can be investigated using the following command from the scylla-cluster-tests main source directory:
docker/env/hydra.sh investigate show-monitor a16fad0b-864d-4aef-af5c-21abfe3afe1b
Looking at the monitoring shows an increasing in cross_shard operations in two scheduling groups:
"streaming" which does a total 1M ops per shard over ~2h of test
"statement" which does a total 35M ops per shard over ~2h of test
I offer 2 theories (or hypotheses) for how could this have happened:
- Since this is a full node write (rebuild) maybe the writes are too slow, in addition we have a lot (~0.5M) writes serialized
through the cross shard operation. - Maybe in addition to the repair we have too much stress writes (which end up on the wrong shart) going on (hopefully
overload protection can mitigate it), or even worse maybe some of the row level repair operations are performed under the
statement scheduling group.
@aleksbykov:
1. are there stress writes going on during the repair? Does our stress commands using shard aware drivers?
2. Do we have a minimal reproducer for this?
eliransin
on 26 Aug 2020
@eliransin
- yes, the stress command continue to run during the repair processes. It is use the cassandra-stress tool. Not sure about share aware drive.
- I can create the reproduce job and to reproduce the issue. But during this job very often nodetool repair or node rebuild failed.
aleksbykov
on 26 Aug 2020
@aleksbykov did we have a "Resharding nemesis" before this?
roydahan
on 26 Aug 2020
@aleksbykov - repair failing is this only in CDC jobs ?
slivne
on 26 Aug 2020
@aleksbykov did we have a "Resharding nemesis" before this?
@roy, we didn't have Resharding nemesis before this.
aleksbykov
on 26 Aug 2020
@aleksbykov - repair failing is this only in CDC jobs ?
@slivne , the job with cdc detects such issue more often. Other Jobs triggered it very rare.
aleksbykov
on 26 Aug 2020
Some more information, the driver seams shard aware, revisiting the monitoring data shows that the connections are evenly distributed across all shards.
eliransin
on 30 Aug 2020
@asias I have a question regarding the rebuild operation:
1.When doing the rebuild, does the node that rebuilds is considered as a token owner or does this happen only at the end of the rebuild?
eliransin
on 30 Aug 2020
@asias ping :point_up: ,
I also couldn't reproduce manually - there were no cross shard operations.
I think we should investigate why in this case there are cross shard operations in streaming.
I looked again in the monitoring data and saw that cross shard operations are increasing in the streaming scheduling group,
I find it strange since scylla is shard aware (right?) :slightly_smiling_face: , @asias is it normal? if not, can it be due to the fact
that cdc tables use a different partitioner and as a result somehow the shards are different too (@haaawk ) ?
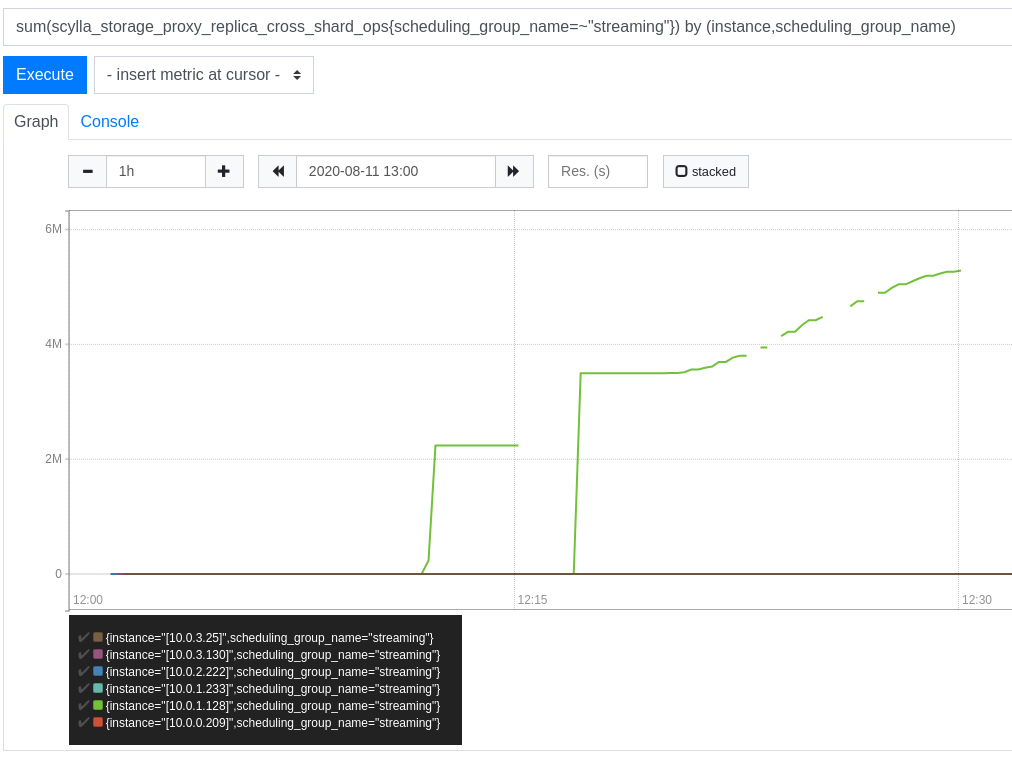
Here is a prometheus image of this phenomena:
eliransin
on 1 Sep 2020
BTW the only instance that has cross shard ops is "node2" - as expected since it is the only node that is streamed to.
eliransin
on 1 Sep 2020
@aleksbykov I know you are running a CDC enabled version of this test vs a CDC disabled one.
It will be interesting to compare those graphs between the tests. If only the CDC enabled contains those cross shard ops then
we have a lead, if not we will need to find the origin of those cross shard operations.
Pasting here the query that produced the image above just so we remember it and anyone can review it, maybe I got something
wrong:
sum(scylla_storage_proxy_replica_cross_shard_ops{scheduling_group_name=~"streaming"}) by (instance,scheduling_group_name)
eliransin
on 1 Sep 2020
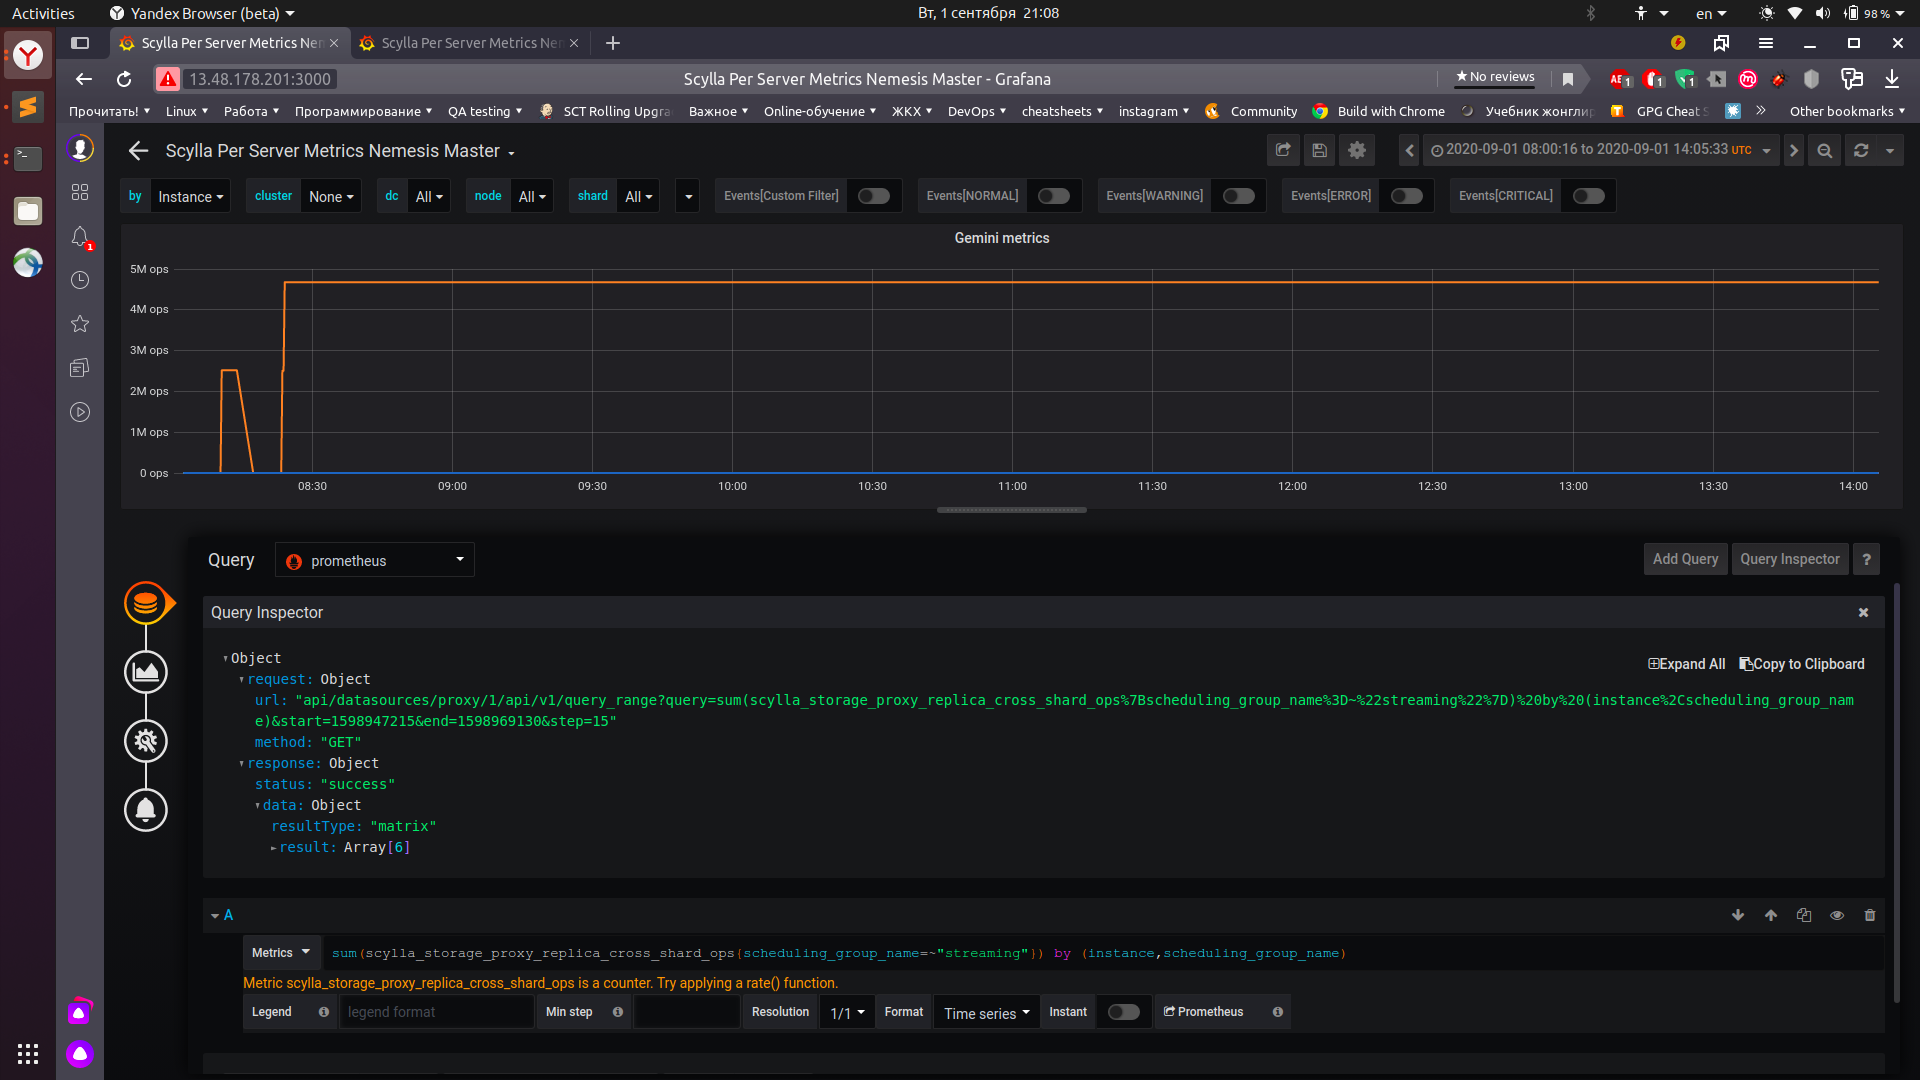
@eliransin
this result of query for cdc enabled. I have to mention that this job failed after the first sct actions. So it may not be valid.
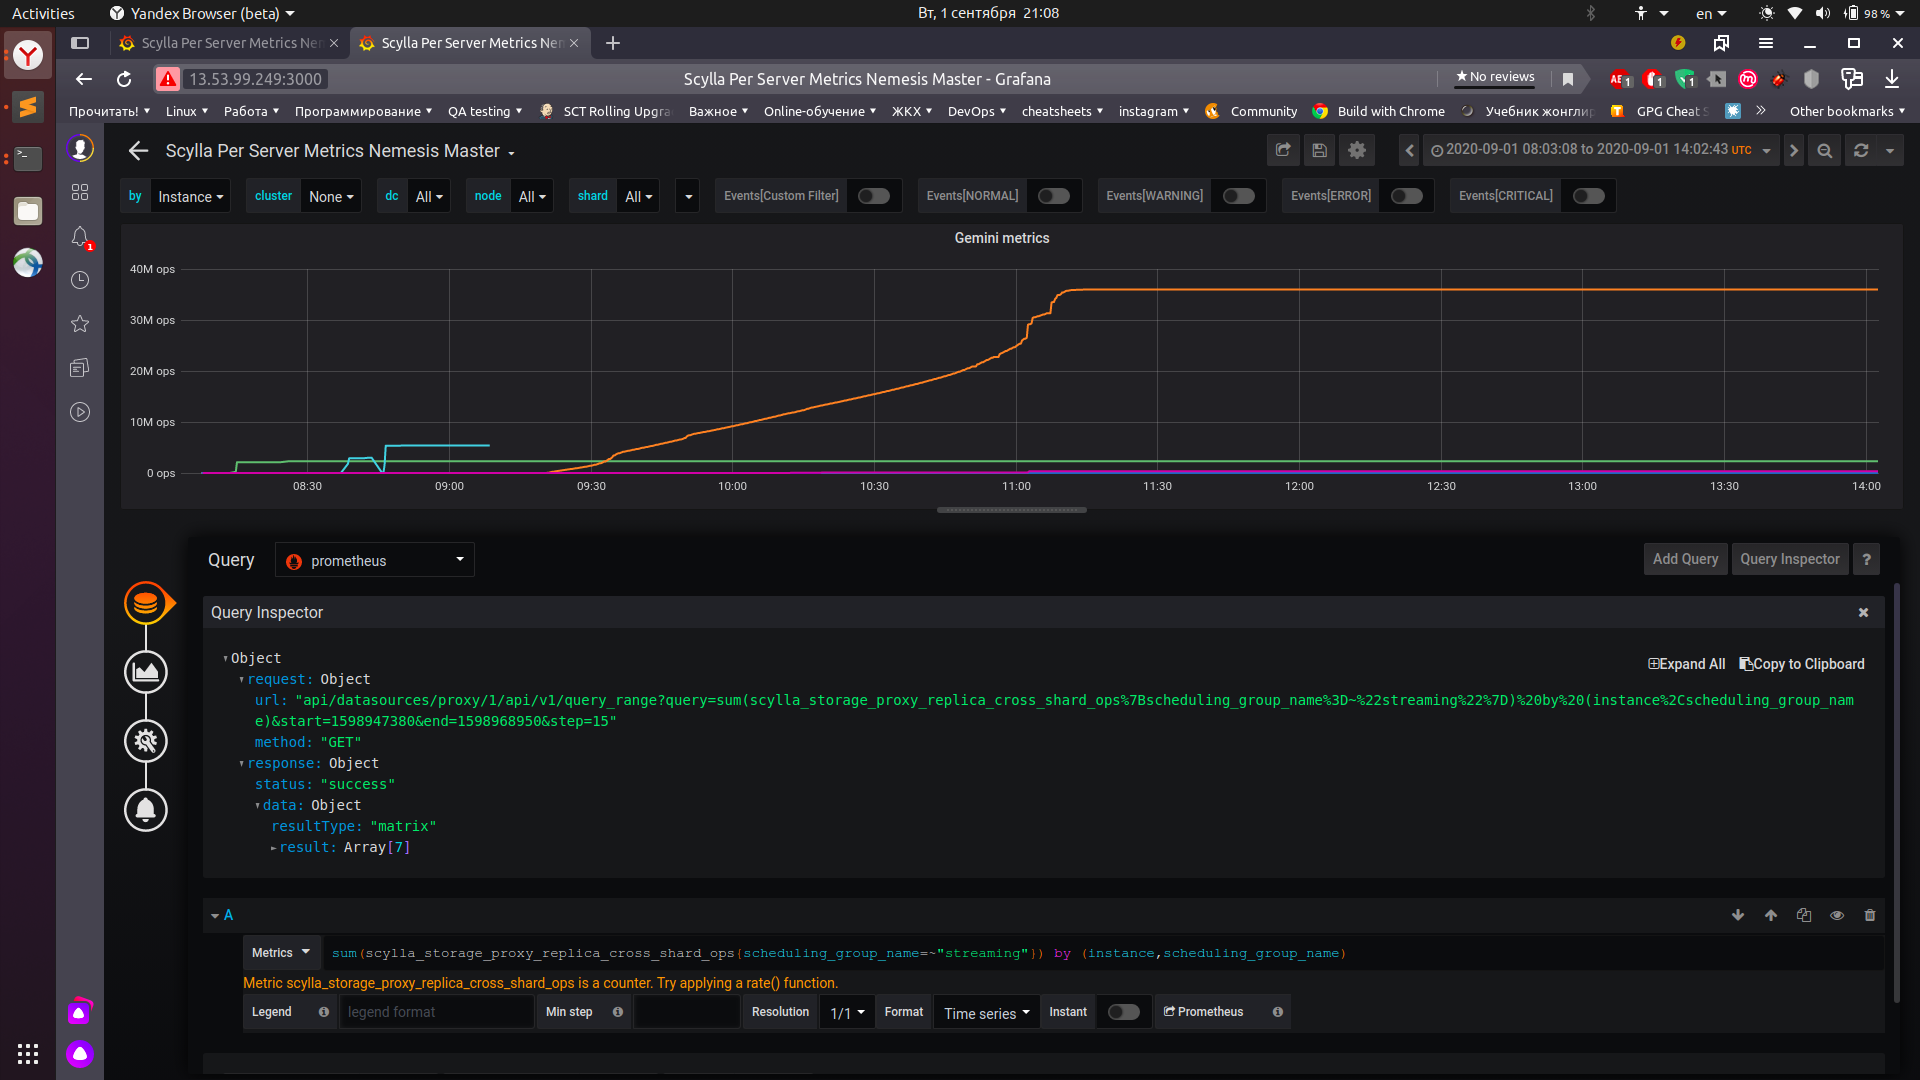
this result of query for cdc disabled. This job running for 3 hours. mostly without errors
Jobs are running with small fixes, so they both should run for 3hours
aleksbykov
on 1 Sep 2020
also both monitoring stacks are available:
with cdc:
http://13.48.178.201:3000
without cdc:
http://13.53.99.249:3000
aleksbykov
on 1 Sep 2020
Thanks @aleksbykov, can you also mention the nodes that are rebuilding?
From the metrics it looks like:
10.0.3.27 - in the cdc version
10.0.3.118 - in the non cdc version
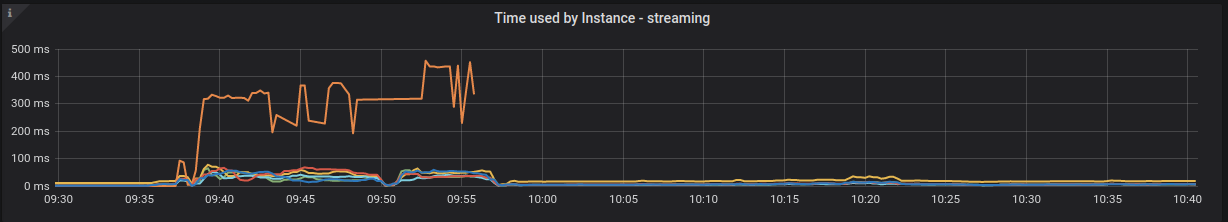
In both I see cross shard activity in streaming, @asias do you have a guess what is the origin of this cross shard activity?:
It looks like streaming generates ~5.5K cross shards ops/sec even without CDC (/cc @asias)
Maybe it is just a red hering or maybe it is only a problem with the increased load caused by the need to also stream
the cdc tables.
CDC
-

Without CDC
-

eliransin
on 1 Sep 2020
@asias I have a question regarding the rebuild operation:
1.When doing the rebuild, does the node that rebuilds is considered as a token owner or does this happen only at the end of the rebuild?
Rebuild does not change the tokens ownership at all. So, the node running the rebuild always own the tokens before, during, after the operations.
asias
on 2 Sep 2020
After talking to @asias we think cross shard operations under streaming shouldn't happen, or at least are not intended to
happen, We will create a debug rpm where an cross shard operation withing the streaming scheduling groups aborts so we can
investigate the flow that lead to this.
@aleksbykov we will need your help once we have the RPM. We will need to run it (w/o cdc seams to be more stable) just to get
the core and find the origin of the shard mixup.
eliransin
on 2 Sep 2020
@eliransin i will glad to help. Once you have rpm, could you put somewhere here, like @denesb did: https://github.com/scylladb/scylla/issues/7117#issuecomment-684440461
aleksbykov
on 2 Sep 2020
Will do, thanks.
eliransin
on 2 Sep 2020
@aleksbykov - here it is:
gsutil cp gs://scratch.scylladb.com/eliransin/7025/scylla-server-4.2.rc3-0.20200902.ba18a5bf3.x86_64.rpm .
In parallel I am running all repair dtest locally (with smp = 4) to see if I can trigger the core locally.
eliransin
on 2 Sep 2020
@eliransin job with reproduce is running. Once got result, i will update the issue with findings
aleksbykov
on 2 Sep 2020
@eliransin got next coredumps with your core:
2020-09-02 14:50:46.000: (CoreDumpEvent Severity.ERROR): node=Node repr-longevity-cdc-dis-100gb-4h-rep-db-node-d989098e-5 [13.53.128.12 | 10.0.3.224] (seed: False)
corefile_url=
https://storage.cloud.google.com/upload.scylladb.com/core.scylla.996.2a8b53148b1348d38c19059e718b9f71.21709.1599058246000000/core.scylla.996.2a8b53148b1348d38c19059e718b9f71.21709.1599058246000000.gz
backtrace=           PID: 21709 (scylla)
           UID: 996 (scylla)
           GID: 1001 (scylla)
        Signal: 6 (ABRT)
     Timestamp: Wed 2020-09-02 14:50:46 UTC (2min 55s ago)
  Command Line: /usr/bin/scylla --blocked-reactor-notify-ms 500 --abort-on-lsa-bad-alloc 1 --abort-on-seastar-bad-alloc --abort-on-internal-error 1 --abort-on-ebadf 1 --experimental-features cdc --log-to-syslog 1 --log-to-stdout 0 --default-log-level info --network-stack posix --io-properties-file=/etc/scylla.d/io_properties.yaml --cpuset 1-7,9-15 --lock-memory=1
    Executable: /opt/scylladb/libexec/scylla
 Control Group: /scylla.slice/scylla-server.slice/scylla-server.service
          Unit: scylla-server.service
         Slice: scylla-server.slice
       Boot ID: 2a8b53148b1348d38c19059e718b9f71
    Machine ID: df877a200226bc47d06f26dae0736ec9
      Hostname: repr-longevity-cdc-dis-100gb-4h-rep-db-node-d989098e-5
      Coredump: /var/lib/systemd/coredump/core.scylla.996.2a8b53148b1348d38c19059e718b9f71.21709.1599058246000000
       Message: Process 21709 (scylla) of user 996 dumped core.

                Stack trace of thread 21709:
                #0  0x00007f5d79cc09e5 raise (libc.so.6)
                #1  0x00007f5d79ca994d abort (libc.so.6)
                #2  0x0000000001a082f0 _ZN7service13storage_proxy14mutate_locallyERKN7seastar13lw_shared_ptrIK6schemaEERK15frozen_mutationN7tracing15trace_state_ptrENS1_10bool_classI14force_sync_tagEENSt6chrono10time_pointINS1_12lowres_clockENSG_8durationIlSt5ratioILl1ELl1000EEEEEE.cold (scylla)
                #3  0x00000000019aa3ae _ZN7seastar8internal12do_with_implI15frozen_mutationNS_10shared_ptrIN7service13storage_proxyEEEJmZZNS5_22init_messaging_serviceEvENKUlN4netw8msg_addrENS_3rpc14opt_time_pointEN5utils4UUIDET_St6vectorIN3gms12inet_addressESaISG_EESG_jmSt8optionalIN7tracing10trace_infoEEOT0_OT1_E0_clIS2_ZZNS5_22init_messaging_serviceEvENKUlRKNS9_11client_infoESA_S2_SI_SG_jmNS9_8optionalISM_EEE1_clESV_SA_S2_SI_SG_jmSX_EUlRS6_NSK_15trace_state_ptrENS_13lw_shared_ptrIK6schemaEERKS2_NSt6chrono10time_pointINS_12lowres_clockENS17_8durationIlSt5ratioILl1ELl1000EEEEEEE_ZZNS5_22init_messaging_serviceEvENKSY_clESV_SA_S2_SI_SG_jmSX_EUlS8_S1E_S16_SG_jmSM_E0_EEDaS8_SA_SC_SD_SI_SG_jmSM_SO_SQ_EUlRKSD_SZ_RmE_EEEDaOSD_SO_DpOT1_ (scylla)
                #4  0x00000000019abffe _ZNSt17_Function_handlerIFN7seastar6futureIJNS0_3rpc12no_wait_typeEEEERKNS2_11client_infoENS2_14opt_time_pointE15frozen_mutationSt6vectorIN3gms12inet_addressESaISC_EESC_jmNS2_8optionalISt8optionalIN7tracing10trace_infoEEEEEZN7service13storage_proxy22init_messaging_serviceEvEUlS7_S8_S9_SE_SC_jmSK_E1_E9_M_invokeERKSt9_Any_dataS7_OS8_OS9_OSE_OSC_OjOmOSK_ (scylla)
                #5  0x00000000021a0d3b _ZZZZN7seastar3rpc11recv_helperIN4netw10serializerESt8functionIFNS_6futureIJNS0_12no_wait_typeEEEERKNS0_11client_infoENS0_14opt_time_pointE15frozen_mutationSt6vectorIN3gms12inet_addressESaISF_EESF_jmNS0_8optionalISt8optionalIN7tracing10trace_infoEEEEEES7_JSC_SH_SF_jmSN_ENS0_19do_want_client_infoENS0_18do_want_time_pointEEEDaNS0_9signatureIFT1_DpT2_EEEOT0_T3_T4_ENUlNS_10shared_ptrINS0_6server10connectionEEESJ_INSt6chrono10time_pointINS_12lowres_clockENS16_8durationIlSt5ratioILl1ELl1000EEEEEEElNS0_7rcv_bufEE_clES15_S1E_lS1F_ENUlT_E1_clINS_15semaphore_unitsINS_35semaphore_default_exception_factoryES18_EEEEDaS1H_ENUlvE_clEv (scylla)
                #6  0x00000000021a31b2 _ZZZN7seastar3rpc11recv_helperIN4netw10serializerESt8functionIFNS_6futureIJNS0_12no_wait_typeEEEERKNS0_11client_infoENS0_14opt_time_pointE15frozen_mutationSt6vectorIN3gms12inet_addressESaISF_EESF_jmNS0_8optionalISt8optionalIN7tracing10trace_infoEEEEEES7_JSC_SH_SF_jmSN_ENS0_19do_want_client_infoENS0_18do_want_time_pointEEEDaNS0_9signatureIFT1_DpT2_EEEOT0_T3_T4_ENUlNS_10shared_ptrINS0_6server10connectionEEESJ_INSt6chrono10time_pointINS_12lowres_clockENS16_8durationIlSt5ratioILl1ELl1000EEEEEEElNS0_7rcv_bufEE_clES15_S1E_lS1F_ENUlT_E1_clINS_15semaphore_unitsINS_35semaphore_default_exception_factoryES18_EEEEDaS1H_ (scylla)
                #7  0x000000000224caac _ZZN7seastar3rpc11recv_helperIN4netw10serializerESt8functionIFNS_6futureIJNS0_12no_wait_typeEEEERKNS0_11client_infoENS0_14opt_time_pointE15frozen_mutationSt6vectorIN3gms12inet_addressESaISF_EESF_jmNS0_8optionalISt8optionalIN7tracing10trace_infoEEEEEES7_JSC_SH_SF_jmSN_ENS0_19do_want_client_infoENS0_18do_want_time_pointEEEDaNS0_9signatureIFT1_DpT2_EEEOT0_T3_T4_ENUlNS_10shared_ptrINS0_6server10connectionEEESJ_INSt6chrono10time_pointINS_12lowres_clockENS16_8durationIlSt5ratioILl1ELl1000EEEEEEElNS0_7rcv_bufEE_clES15_S1E_lS1F_ (scylla)
                #8  0x000000000224e13e _ZNSt17_Function_handlerIFN7seastar6futureIJEEENS0_10shared_ptrINS0_3rpc6server10connectionEEESt8optionalINSt6chrono10time_pointINS0_12lowres_clockENS9_8durationIlSt5ratioILl1ELl1000EEEEEEElNS4_7rcv_bufEEZNS4_11recv_helperIN4netw10serializerESt8functionIFNS1_IJNS4_12no_wait_typeEEEERKNS4_11client_infoENS4_14opt_time_pointE15frozen_mutationSt6vectorIN3gms12inet_addressESaISX_EESX_jmNS4_8optionalIS8_IN7tracing10trace_infoEEEEEESP_JSU_SZ_SX_jmS14_ENS4_19do_want_client_infoENS4_18do_want_time_pointEEEDaNS4_9signatureIFT1_DpT2_EEEOT0_T3_T4_EUlS7_SH_lSI_E_E9_M_invokeERKSt9_Any_dataOS7_OSH_OlOSI_ (scylla)
                #9  0x0000000003294ff6 _ZN7seasta

download_instructions=
gsutil cp gs://upload.scylladb.com/core.scylla.996.2a8b53148b1348d38c19059e718b9f71.21709.1599058246000000/core.scylla.996.2a8b53148b1348d38c19059e718b9f71.21709.1599058246000000.gz .
gunzip /var/lib/systemd/coredump/core.scylla.996.2a8b53148b1348d38c19059e718b9f71.21709.1599058246000000.gz
2020-09-02 14:53:45.000: (CoreDumpEvent Severity.ERROR): node=Node repr-longevity-cdc-dis-100gb-4h-rep-db-node-d989098e-5 [13.53.128.12 | 10.0.3.224] (seed: False)
corefile_url=
https://storage.cloud.google.com/upload.scylladb.com/core.scylla.996.2a8b53148b1348d38c19059e718b9f71.22982.1599058425000000/core.scylla.996.2a8b53148b1348d38c19059e718b9f71.22982.1599058425000000.gz
backtrace=           PID: 22982 (scylla)
           UID: 996 (scylla)
           GID: 1001 (scylla)
        Signal: 6 (ABRT)
     Timestamp: Wed 2020-09-02 14:53:45 UTC (3min 18s ago)
  Command Line: /usr/bin/scylla --blocked-reactor-notify-ms 500 --abort-on-lsa-bad-alloc 1 --abort-on-seastar-bad-alloc --abort-on-internal-error 1 --abort-on-ebadf 1 --experimental-features cdc --log-to-syslog 1 --log-to-stdout 0 --default-log-level info --network-stack posix --io-properties-file=/etc/scylla.d/io_properties.yaml --cpuset 1-7,9-15 --lock-memory=1
    Executable: /opt/scylladb/libexec/scylla
 Control Group: /scylla.slice/scylla-server.slice/scylla-server.service
          Unit: scylla-server.service
         Slice: scylla-server.slice
       Boot ID: 2a8b53148b1348d38c19059e718b9f71
    Machine ID: df877a200226bc47d06f26dae0736ec9
      Hostname: repr-longevity-cdc-dis-100gb-4h-rep-db-node-d989098e-5
      Coredump: /var/lib/systemd/coredump/core.scylla.996.2a8b53148b1348d38c19059e718b9f71.22982.1599058425000000
       Message: Process 22982 (scylla) of user 996 dumped core.

                Stack trace of thread 22982:
                #0  0x00007f32af72e9e5 raise (libc.so.6)
                #1  0x00007f32af71794d abort (libc.so.6)
                #2  0x0000000001a082f0 _ZN7service13storage_proxy14mutate_locallyERKN7seastar13lw_shared_ptrIK6schemaEERK15frozen_mutationN7tracing15trace_state_ptrENS1_10bool_classI14force_sync_tagEENSt6chrono10time_pointINS1_12lowres_clockENSG_8durationIlSt5ratioILl1ELl1000EEEEEE.cold (scylla)
                #3  0x00000000019aa3ae _ZN7seastar8internal12do_with_implI15frozen_mutationNS_10shared_ptrIN7service13storage_proxyEEEJmZZNS5_22init_messaging_serviceEvENKUlN4netw8msg_addrENS_3rpc14opt_time_pointEN5utils4UUIDET_St6vectorIN3gms12inet_addressESaISG_EESG_jmSt8optionalIN7tracing10trace_infoEEOT0_OT1_E0_clIS2_ZZNS5_22init_messaging_serviceEvENKUlRKNS9_11client_infoESA_S2_SI_SG_jmNS9_8optionalISM_EEE1_clESV_SA_S2_SI_SG_jmSX_EUlRS6_NSK_15trace_state_ptrENS_13lw_shared_ptrIK6schemaEERKS2_NSt6chrono10time_pointINS_12lowres_clockENS17_8durationIlSt5ratioILl1ELl1000EEEEEEE_ZZNS5_22init_messaging_serviceEvENKSY_clESV_SA_S2_SI_SG_jmSX_EUlS8_S1E_S16_SG_jmSM_E0_EEDaS8_SA_SC_SD_SI_SG_jmSM_SO_SQ_EUlRKSD_SZ_RmE_EEEDaOSD_SO_DpOT1_ (scylla)
                #4  0x00000000019abffe _ZNSt17_Function_handlerIFN7seastar6futureIJNS0_3rpc12no_wait_typeEEEERKNS2_11client_infoENS2_14opt_time_pointE15frozen_mutationSt6vectorIN3gms12inet_addressESaISC_EESC_jmNS2_8optionalISt8optionalIN7tracing10trace_infoEEEEEZN7service13storage_proxy22init_messaging_serviceEvEUlS7_S8_S9_SE_SC_jmSK_E1_E9_M_invokeERKSt9_Any_dataS7_OS8_OS9_OSE_OSC_OjOmOSK_ (scylla)
                #5  0x00000000021a0d3b _ZZZZN7seastar3rpc11recv_helperIN4netw10serializerESt8functionIFNS_6futureIJNS0_12no_wait_typeEEEERKNS0_11client_infoENS0_14opt_time_pointE15frozen_mutationSt6vectorIN3gms12inet_addressESaISF_EESF_jmNS0_8optionalISt8optionalIN7tracing10trace_infoEEEEEES7_JSC_SH_SF_jmSN_ENS0_19do_want_client_infoENS0_18do_want_time_pointEEEDaNS0_9signatureIFT1_DpT2_EEEOT0_T3_T4_ENUlNS_10shared_ptrINS0_6server10connectionEEESJ_INSt6chrono10time_pointINS_12lowres_clockENS16_8durationIlSt5ratioILl1ELl1000EEEEEEElNS0_7rcv_bufEE_clES15_S1E_lS1F_ENUlT_E1_clINS_15semaphore_unitsINS_35semaphore_default_exception_factoryES18_EEEEDaS1H_ENUlvE_clEv (scylla)
                #6  0x00000000021a31b2 _ZZZN7seastar3rpc11recv_helperIN4netw10serializerESt8functionIFNS_6futureIJNS0_12no_wait_typeEEEERKNS0_11client_infoENS0_14opt_time_pointE15frozen_mutationSt6vectorIN3gms12inet_addressESaISF_EESF_jmNS0_8optionalISt8optionalIN7tracing10trace_infoEEEEEES7_JSC_SH_SF_jmSN_ENS0_19do_want_client_infoENS0_18do_want_time_pointEEEDaNS0_9signatureIFT1_DpT2_EEEOT0_T3_T4_ENUlNS_10shared_ptrINS0_6server10connectionEEESJ_INSt6chrono10time_pointINS_12lowres_clockENS16_8durationIlSt5ratioILl1ELl1000EEEEEEElNS0_7rcv_bufEE_clES15_S1E_lS1F_ENUlT_E1_clINS_15semaphore_unitsINS_35semaphore_default_exception_factoryES18_EEEEDaS1H_ (scylla)
                #7  0x000000000224caac _ZZN7seastar3rpc11recv_helperIN4netw10serializerESt8functionIFNS_6futureIJNS0_12no_wait_typeEEEERKNS0_11client_infoENS0_14opt_time_pointE15frozen_mutationSt6vectorIN3gms12inet_addressESaISF_EESF_jmNS0_8optionalISt8optionalIN7tracing10trace_infoEEEEEES7_JSC_SH_SF_jmSN_ENS0_19do_want_client_infoENS0_18do_want_time_pointEEEDaNS0_9signatureIFT1_DpT2_EEEOT0_T3_T4_ENUlNS_10shared_ptrINS0_6server10connectionEEESJ_INSt6chrono10time_pointINS_12lowres_clockENS16_8durationIlSt5ratioILl1ELl1000EEEEEEElNS0_7rcv_bufEE_clES15_S1E_lS1F_ (scylla)
                #8  0x000000000224e13e _ZNSt17_Function_handlerIFN7seastar6futureIJEEENS0_10shared_ptrINS0_3rpc6server10connectionEEESt8optionalINSt6chrono10time_pointINS0_12lowres_clockENS9_8durationIlSt5ratioILl1ELl1000EEEEEEElNS4_7rcv_bufEEZNS4_11recv_helperIN4netw10serializerESt8functionIFNS1_IJNS4_12no_wait_typeEEEERKNS4_11client_infoENS4_14opt_time_pointE15frozen_mutationSt6vectorIN3gms12inet_addressESaISX_EESX_jmNS4_8optionalIS8_IN7tracing10trace_infoEEEEEESP_JSU_SZ_SX_jmS14_ENS4_19do_want_client_infoENS4_18do_want_time_pointEEEDaNS4_9signatureIFT1_DpT2_EEEOT0_T3_T4_EUlS7_SH_lSI_E_E9_M_invokeERKSt9_Any_dataOS7_OSH_OlOSI_ (scylla)
                #9  0x0000000003294ff6 _ZN7seasta

download_instructions=
gsutil cp gs://upload.scylladb.com/core.scylla.996.2a8b53148b1348d38c19059e718b9f71.22982.1599058425000000/core.scylla.996.2a8b53148b1348d38c19059e718b9f71.22982.1599058425000000.gz .
gunzip /var/lib/systemd/coredump/core.scylla.996.2a8b53148b1348d38c19059e718b9f71.22982.1599058425000000.gz
Thanks @aleksbykov I will get right on it :+1:
eliransin
on 3 Sep 2020
@aleksbykov what is the linux distro in this ami? (in case I am having trouble to open the core on my system) or even better,
does this cluster still running by any cance?
eliransin
on 3 Sep 2020
Managed to open the core, after analyzing it, it seams that the cross shard work comes from:
messaging_verb::HINT_MUTATION , invoke on source_shard%smp or invoke on shard_of(m)
So probably the problem is that we accumulate too many hints to be handled in the context of cross shard mutex (?)
eliransin
on 3 Sep 2020
@eliransin got next coredumps with your core:
@aleksbykov could you please give a short description what the test did, e.g., when we shutdown a node, for how long, when we ran the rebuild, any other node operations?
asias
on 3 Sep 2020
used AMAZON2 linux distrib, unfortunately cluster was terminated
aleksbykov
on 3 Sep 2020
@eliransin got next coredumps with your core:
@aleksbykov could you please give a short description what the test did, e.g., when we shutdown a node, for how long, when we ran the rebuild, any other node operations?
It run next c-s stress commands:
2020-09-02 14:29:15.741: (CassandraStressEvent Severity.NORMAL): type=start node=Node repr-longevity-cdc-dis-100gb-4h-rep-loader-node-d989098e-1 [13.48.1.48 | 10.0.2.87] (seed: False)
stress_cmd=cassandra-stress user no-warmup profile=/tmp/cdc_disabled_profile.yaml ops'(insert=2,read1=1,update_number=1,update_name=1,delete1=1)' cl=QUORUM duration=240m -port jmx=6868 -mode cql3 native -rate threads=100 -node 10.0.2.241 -errors skip-unsupported-columns
2020-09-02 14:29:44.870: (CassandraStressEvent Severity.NORMAL): type=start node=Node repr-longevity-cdc-dis-100gb-4h-rep-loader-node-d989098e-2 [13.48.29.180 | 10.0.3.64] (seed: False)
stress_cmd=cassandra-stress user no-warmup profile=/tmp/cdc_disabled_profile.yaml ops'(insert=2,read1=1,update_number=1,update_name=1,delete1=1)' cl=QUORUM duration=240m -port jmx=6868 -mode cql3 native -rate threads=100 -node 10.0.2.241 -errors skip-unsupported-columns
2020-09-02 14:29:56.963: (CassandraStressEvent Severity.NORMAL): type=start node=Node repr-longevity-cdc-dis-100gb-4h-rep-loader-node-d989098e-1 [13.48.1.48 | 10.0.2.87] (seed: False)
stress_cmd=cassandra-stress user no-warmup profile=/tmp/cdc_disabled_profile_preimage.yaml ops'(insert=2,read1=1,update_number=1,update_name=1,delete1=1)' cl=QUORUM duration=240m -port jmx=6868 -mode cql3 native -rate threads=100 -node 10.0.2.241 -errors skip-unsupported-columns
2020-09-02 14:30:26.532: (CassandraStressEvent Severity.NORMAL): type=start node=Node repr-longevity-cdc-dis-100gb-4h-rep-loader-node-d989098e-2 [13.48.29.180 | 10.0.3.64] (seed: False)
stress_cmd=cassandra-stress user no-warmup profile=/tmp/cdc_disabled_profile_preimage.yaml ops'(insert=2,read1=1,update_number=1,update_name=1,delete1=1)' cl=QUORUM duration=240m -port jmx=6868 -mode cql3 native -rate threads=100 -node 10.0.2.241 -errors skip-unsupported-columns
2020-09-02 14:30:45.395: (CassandraStressEvent Severity.NORMAL): type=start node=Node repr-longevity-cdc-dis-100gb-4h-rep-loader-node-d989098e-1 [13.48.1.48 | 10.0.2.87] (seed: False)
stress_cmd=cassandra-stress user no-warmup profile=/tmp/cdc_disabled_profile_postimage.yaml ops'(insert=2,read1=1,update_number=1,update_name=1,delete1=1)' cl=QUORUM duration=240m -port jmx=6868 -mode cql3 native -rate threads=100 -node 10.0.2.241 -errors skip-unsupported-columns
2020-09-02 14:31:12.938: (CassandraStressEvent Severity.NORMAL): type=start node=Node repr-longevity-cdc-dis-100gb-4h-rep-loader-node-d989098e-2 [13.48.29.180 | 10.0.3.64] (seed: False)
stress_cmd=cassandra-stress user no-warmup profile=/tmp/cdc_disabled_profile_postimage.yaml ops'(insert=2,read1=1,update_number=1,update_name=1,delete1=1)' cl=QUORUM duration=240m -port jmx=6868 -mode cql3 native -rate threads=100 -node 10.0.2.241 -errors skip-unsupported-columns
2020-09-02 14:31:26.925: (CassandraStressEvent Severity.NORMAL): type=start node=Node repr-longevity-cdc-dis-100gb-4h-rep-loader-node-d989098e-1 [13.48.1.48 | 10.0.2.87] (seed: False)
stress_cmd=cassandra-stress user no-warmup profile=/tmp/cdc_disabled_profile_preimage_postimage.yaml ops'(insert=2,read1=1,update_number=1,update_name=1,delete1=1)' cl=QUORUM duration=240m -port jmx=6868 -mode cql3 native -rate threads=100 -node 10.0.2.241 -errors skip-unsupported-columns
2020-09-02 14:32:00.723: (CassandraStressEvent Severity.NORMAL): type=start node=Node repr-longevity-cdc-dis-100gb-4h-rep-loader-node-d989098e-2 [13.48.29.180 | 10.0.3.64] (seed: False)
stress_cmd=cassandra-stress user no-warmup profile=/tmp/cdc_disabled_profile_preimage_postimage.yaml ops'(insert=2,read1=1,update_number=1,update_name=1,delete1=1)' cl=QUORUM duration=240m -port jmx=6868 -mode cql3 native -rate threads=100 -node 10.0.2.241 -errors skip-unsupported-columns
Then test choose one node and run next steps:
stop scylla, choose several sstables and remove it, and start scylla again and after scylla is up it execute command nodetool rebuild
aleksbykov
on 3 Sep 2020
OK, suggested theory:
- There is a write stress which is running throughout the test.
- one of the nodes is being brought down, then the stress mutations are being registered as hints
- once the node gets back up it is being "bombed" with those hints and since a lot of them are being registered
as a cross shard operation either, hints are not registered (or sent) per shard or the RPC destination shard can't be
controlled.
The only difference I can see between cdc and w/o cdc test is that the cdc probably amplify the writes by a lot, especially if preimage and postimage are enabled.
eliransin
on 3 Sep 2020
@aleksbykov any chance to run the reproducer with the official 4.2.rc3 with hinted handoff off ?
If this will pass, we will probably need to fix the cross shard mixup, either by sending the hint from the correct shard or by
running it on the correct shard as soon as it gets to the handle (maybe both :smiley: )
eliransin
on 3 Sep 2020
@eliransin got next coredumps with your core:
@aleksbykov could you please give a short description what the test did, e.g., when we shutdown a node, for how long, when we ran the rebuild, any other node operations?
It run next c-s stress commands:
2020-09-02 14:29:15.741: (CassandraStressEvent Severity.NORMAL): type=start node=Node repr-longevity-cdc-dis-100gb-4h-rep-loader-node-d989098e-1 [13.48.1.48 | 10.0.2.87] (seed: False)
stress_cmd=cassandra-stress user no-warmup profile=/tmp/cdc_disabled_profile.yaml ops'(insert=2,read1=1,update_number=1,update_name=1,delete1=1)' cl=QUORUM duration=240m -port jmx=6868 -mode cql3 native -rate threads=100 -node 10.0.2.241 -errors skip-unsupported-columns
2020-09-02 14:29:44.870: (CassandraStressEvent Severity.NORMAL): type=start node=Node repr-longevity-cdc-dis-100gb-4h-rep-loader-node-d989098e-2 [13.48.29.180 | 10.0.3.64] (seed: False)
stress_cmd=cassandra-stress user no-warmup profile=/tmp/cdc_disabled_profile.yaml ops'(insert=2,read1=1,update_number=1,update_name=1,delete1=1)' cl=QUORUM duration=240m -port jmx=6868 -mode cql3 native -rate threads=100 -node 10.0.2.241 -errors skip-unsupported-columns
2020-09-02 14:29:56.963: (CassandraStressEvent Severity.NORMAL): type=start node=Node repr-longevity-cdc-dis-100gb-4h-rep-loader-node-d989098e-1 [13.48.1.48 | 10.0.2.87] (seed: False)
stress_cmd=cassandra-stress user no-warmup profile=/tmp/cdc_disabled_profile_preimage.yaml ops'(insert=2,read1=1,update_number=1,update_name=1,delete1=1)' cl=QUORUM duration=240m -port jmx=6868 -mode cql3 native -rate threads=100 -node 10.0.2.241 -errors skip-unsupported-columns
2020-09-02 14:30:26.532: (CassandraStressEvent Severity.NORMAL): type=start node=Node repr-longevity-cdc-dis-100gb-4h-rep-loader-node-d989098e-2 [13.48.29.180 | 10.0.3.64] (seed: False)
stress_cmd=cassandra-stress user no-warmup profile=/tmp/cdc_disabled_profile_preimage.yaml ops'(insert=2,read1=1,update_number=1,update_name=1,delete1=1)' cl=QUORUM duration=240m -port jmx=6868 -mode cql3 native -rate threads=100 -node 10.0.2.241 -errors skip-unsupported-columns
2020-09-02 14:30:45.395: (CassandraStressEvent Severity.NORMAL): type=start node=Node repr-longevity-cdc-dis-100gb-4h-rep-loader-node-d989098e-1 [13.48.1.48 | 10.0.2.87] (seed: False)
stress_cmd=cassandra-stress user no-warmup profile=/tmp/cdc_disabled_profile_postimage.yaml ops'(insert=2,read1=1,update_number=1,update_name=1,delete1=1)' cl=QUORUM duration=240m -port jmx=6868 -mode cql3 native -rate threads=100 -node 10.0.2.241 -errors skip-unsupported-columns
2020-09-02 14:31:12.938: (CassandraStressEvent Severity.NORMAL): type=start node=Node repr-longevity-cdc-dis-100gb-4h-rep-loader-node-d989098e-2 [13.48.29.180 | 10.0.3.64] (seed: False)
stress_cmd=cassandra-stress user no-warmup profile=/tmp/cdc_disabled_profile_postimage.yaml ops'(insert=2,read1=1,update_number=1,update_name=1,delete1=1)' cl=QUORUM duration=240m -port jmx=6868 -mode cql3 native -rate threads=100 -node 10.0.2.241 -errors skip-unsupported-columns
2020-09-02 14:31:26.925: (CassandraStressEvent Severity.NORMAL): type=start node=Node repr-longevity-cdc-dis-100gb-4h-rep-loader-node-d989098e-1 [13.48.1.48 | 10.0.2.87] (seed: False)
stress_cmd=cassandra-stress user no-warmup profile=/tmp/cdc_disabled_profile_preimage_postimage.yaml ops'(insert=2,read1=1,update_number=1,update_name=1,delete1=1)' cl=QUORUM duration=240m -port jmx=6868 -mode cql3 native -rate threads=100 -node 10.0.2.241 -errors skip-unsupported-columns
2020-09-02 14:32:00.723: (CassandraStressEvent Severity.NORMAL): type=start node=Node repr-longevity-cdc-dis-100gb-4h-rep-loader-node-d989098e-2 [13.48.29.180 | 10.0.3.64] (seed: False)
stress_cmd=cassandra-stress user no-warmup profile=/tmp/cdc_disabled_profile_preimage_postimage.yaml ops'(insert=2,read1=1,update_number=1,update_name=1,delete1=1)' cl=QUORUM duration=240m -port jmx=6868 -mode cql3 native -rate threads=100 -node 10.0.2.241 -errors skip-unsupported-columns
Then test choose one node and run next steps:
stop scylla, choose several sstables and remove it, and start scylla again and after scylla is up it execute command nodetool rebuild
(In the future issue report, if would be best if you could describe something like below)
- run c-s in the background
- stop scylla on nodeX
- choose several sstables and remove it on nodeX
- start scylla on nodeX
- run nodetool rebuild on nodeX
The semphore timeout was observed only after step 5? How long did step 3 take?
asias
on 3 Sep 2020
@aleksbykov any chance to run the reproducer with the official 4.2.rc3 with hinted handoff off ?
If this will pass, we will probably need to fix the cross shard mixup, either by sending the hint from the correct shard or by
running it on the correct shard as soon as it gets to the handle (maybe both )
Yes, i can start it. Will update with results
aleksbykov
on 3 Sep 2020
@asias , i will do.
aleksbykov
on 3 Sep 2020
@piodul / @haaawk need your confirmation are hints recorded on the correct shard and sent from the correct shard ?
slivne
on 3 Sep 2020
according to avi - hints need to use a dedicated smp service group (and check that workload prioritization is not damaged)
slivne
on 3 Sep 2020
@aleksbykov which client are you using - why isn't it shard aware ?
slivne
on 3 Sep 2020
@haaawk / @piodul please split apart issues from this for HH items - this issue is to large as it is
slivne
on 3 Sep 2020
@aleksbykov which client are you using - why isn't it shard aware ?
cassandra stress tool is used with -mode cql3 native options.
aleksbykov
on 3 Sep 2020
@slivne Hints are stored on disk by the same shard which handled the write operation the hints originated from. They are read from disk and sent by that shard, too.
So, if a write request was sent to the wrong shard, the hint will be sent to the wrong shard, too.
 piodul
on 3 Sep 2020
piodul
on 3 Sep 2020
@aleksbykov You can easily verify if cassandra-stress uses a shard-aware driver by looking at the standard output. Look for the following line (it should be printed along with information about c-s configuration):
===== Using optimized driver!!! =====
If it's present, then it uses the shard-aware driver.
This message comes from the Java driver. Older versions of the driver print it only to stdout, newer print it both to stdout and to logs. I don't see this message in logs from cassandra-stress, so I cannot tell if the driver is shard-aware or not because I don't know which version is used.
Do you know the exact version of cassandra-stress used in the test? Could you run it and see if the line appears?
EDIT: To see this message, you need to run c-s with parameters as if you intended to run a test. I don't know if this message appears if you run cassandra-stress -version or something similar.
piodul
on 3 Sep 2020
@piodul i didn't find this messages in c-s tool output logged to file.
In which log it should appear also, scylla logs?
aleksbykov
on 3 Sep 2020
@piodoul
c-s: Version: 3.11.3-SNAPSHOT
aleksbykov
on 3 Sep 2020
@aleksbykov If cassandra-stress uses a shard-aware driver, it will print this message to the standard output.
Cassandra-stress has also an option to print logs to a file, e.g. cassandra-stress -log file=/tmp/c-s.log. Newer versions of the driver also put this message in this file, but older do not. The only way to be certain is to look at the stdout, not the file generated by -log file=....
I wasn't sure if test artifacts contained captured stdout, or the output generated by -log file=....
Looking at sct.log, I see this:
2020-08-11 12:02:22,698 f:stress_thread.py l:173 c:sdcm.stress_thread p:INFO > cassandra-stress user no-warmup profile=/tmp/cdc_profile.yaml ops'(insert=2,read1=1,update_number=1,update_name=1,delete1=1)' cl=QUORUM duration=240m -port jmx=6868 -mode cql3 native -rate threads=100 -node 10.0.2.222 -errors skip-unsupported-columns
There is no -log file=... option, so I suspect that the logs from artifacts contain stdout of c-s. I can't see a Using optimized driver line there, so I'd say that this test used cassandra-stress __without__ shard-awareness.
piodul
on 3 Sep 2020
@aleksbykov any news on the run w/o hinted handoff?
eliransin
on 6 Sep 2020
according to avi - hints need to use a dedicated smp service group (and check that workload prioritization is not damaged)
I opened a separate issue for the dedicated smp group #7177
eliransin
on 6 Sep 2020
@eliransin sorry with delay. The latest jobs failed with spot termination. WIll rerun it again. But before instances were terminated. 3 times repair passed without any errors
aleksbykov
on 7 Sep 2020
@aleksbykov don't be sorry you delivered some good news already :wink:
Now we just need to wait for all of the results.
BTW if the spot instances terminate again can we just use on_demand?
We get those terminations a lot :slightly_frowning_face:
Regardless, thanks a lot for your help so far :+1:
eliransin
on 7 Sep 2020
@eliransin i reran the job with on_demand instances. Waiting the results
aleksbykov
on 7 Sep 2020
@eliransin job finished for one of latest 4.2.rc3. All nemesises with repair based operations finsihed without errors. Also issue was not reproduced. Only once was detected Large latency for write operation for one of 4 c-s commands during refresh operation.
If you need metrics, you can restore the monitor stack with command
hydra investigate show-monitor c58d4a4c-f4fc-4fa8-ab97-e7609fefa116
aleksbykov
on 8 Sep 2020
Thanks @aleksbykov , is there a byo jenkins job where I can test a proper fix for this (without hinted handoff disabled) ?
eliransin
on 8 Sep 2020
Thanks @aleksbykov , is there a byo jenkins job where I can test a proper fix for this (without hinted handoff disabled) ?
@eliransin Are you fixing the hinted handoff part? Do you need anything from me?
asias
on 9 Sep 2020
@aleksbykov I have a fix in that area but it is not certain that it will fix this failure. I basically need to run a 4.2.rc3 + my fix with this test but with hinted handoff on and see if it also fixes this error.
I thought to just run it myself instead of having you hit the start button every time I have a private test version :slightly_smiling_face:
eliransin
on 9 Sep 2020
@eliransin sorry with delay. Do you still need help with checking the fix?
aleksbykov
on 16 Sep 2020
@aleksbykov based on a previous issue, please check that non of the nodes hit “enospc”.
Check it both in monitor and log.
roydahan
on 16 Sep 2020
@aleksbykov what is the stall detector configuration in the sct test?
asias
on 16 Sep 2020
@aleksbykov what is the stall detector configuration in the sct test?
the test 1st reported (the same as the default in SCT) is 500 ms, as in the following arguments set for the test:
--blocked-reactor-notify-ms 500 --abort-on-lsa-bad-alloc 1 --abort-on-seastar-bad-alloc --abort-on-internal-error 1 --abort-on-ebadf 1 --experimental-features cdc
 fgelcer
on 16 Sep 2020
fgelcer
on 16 Sep 2020
And we do not see stalls in the test, right?
asias
on 16 Sep 2020
@asias
And we do not see stalls in the test, right?
Yes, no any reactor stalled reported
aleksbykov
on 16 Sep 2020
@eliransin has a fix for the hint priority inversion which might help. @eliransin did you manage to run the test with you fix using byo? Do you want QA to run another test with your fix below?
`
commit 933b44f6767e6a5ab6262b56c50558b623693894
Author: Eliran Sinvani <[email protected]>
Date:   Mon Sep 7 15:45:15 2020 +0300    Storage proxy: use hints smp group in mutate locally    We are using mutate_locally to handle hint mutations that arrived
    through RPC. The current implementation makes no distinction whether
    the mutation came through hint verb or a mutation verb resulting in
    using the same smp group for both. This commit adds the ability to
    reference different smp group in mutate_locally private calls and
    makes the handlers pass the correct smp group to mutate_locally.commit 342fc07bd69f12b8d02e263afae240b266a11601
Author: Eliran Sinvani <[email protected]>
Date:   Mon Sep 7 15:43:41 2020 +0300    Storage proxy: add a dedicated smp group for hints    Hints and regular writes currently uses the same cross shard
    operation semaphore, which can lead to priority inversion, making
    cross shard writes wait for cross shard hints. This commit adds
    an smp_service_group for hints and adds it usage in the mutate_hint
    function.
asias
on 23 Sep 2020
@eliransin sorry with delay. Do you still need help with checking the fix?
@aleksbykov Yes, I want to run it with the fix so I can validate it solves it (which might not be the case).
Do we have some kind of byo for this reproducer? (wih HH on)
/cc @asias
eliransin
on 23 Sep 2020
@eliransin you could prepare the rpm file and upload it somewhere on scratch.scylladb.com and i will prepare the byo reproproducer to run job with your fix
aleksbykov
on 23 Sep 2020
Thanks for your help @aleksbykov , this fix is going to be in 4.2.rc5 so I'll just ping you when it is out.
eliransin
on 24 Sep 2020
During this job https://jenkins.scylladb.com/job/scylla-4.2/job/longevity/job/longevity-cdc-100gb-4h-test/56/
for scylla version 4.2.rc5-0.20201001.5fcc1f205c command nodetool repair again failed with next error:
Command: 'nodetool  repair '

Exit code: 2

Stdout:

 Starting repair command #1, repairing 1 ranges for keyspace system_traces (parallelism=SEQUENTIAL, full=true)
 Repair session 1
 Repair session 1 finished
 Starting repair command #2, repairing 1 ranges for keyspace cdc_test (parallelism=SEQUENTIAL, full=true)
 Repair session 2 failed
 Repair session 2 finished

Stderr:

error: Repair job has failed with the error message: [2020-10-01 10:34:58,896] Repair session 2 failed
-- StackTrace --
java.lang.RuntimeException: Repair job has failed with the error message: [2020-10-01 10:34:58,896] Repair session 2 failed
   at org.apache.cassandra.tools.RepairRunner.progress(RepairRunner.java:124)
   at org.apache.cassandra.utils.progress.jmx.JMXNotificationProgressListener.handleNotification(JMXNotificationProgressListener.java:77)
   at com.sun.jmx.remote.internal.ClientNotifForwarder$NotifFetcher.dispatchNotification(ClientNotifForwarder.java:583)
   at com.sun.jmx.remote.internal.ClientNotifForwarder$NotifFetcher.doRun(ClientNotifForwarder.java:533)
   at com.sun.jmx.remote.internal.ClientNotifForwarder$NotifFetcher.run(ClientNotifForwarder.java:452)
   at com.sun.jmx.remote.internal.ClientNotifForwarder$LinearExecutor$1.run(ClientNotifForwarder.java:108)
i have to mention that this happened only with cdc enabled( on another job where there is not cdc this nemesis passed) and the rbo is disabled
This happened during nemesis CorruptThenRepair. This nemesis stops the scylla, remove several sstables, starts scylla and run nodetool repair
Here is a lof from node where it runs:
system.log.tar.gz
All logs avialable: https://cloudius-jenkins-test.s3.amazonaws.com/9acee2d1-06a2-4778-bc92-f063299147c7/20201001_142003/db-cluster-9acee2d1.zip
During the repair a lot of such messages in log:
2020-10-01T09:41:12+00:00  longevity-cdc-100gb-4h-4-2-db-node-9acee2d1-3 !ERR     | scylla: [shard 2] storage_proxy - exception during mutation write to 10.0.1.225: seastar::named_semaphore_timed_out (Semaphore timed out: smp_service_group#2 10->2 semaphore)
2020-10-01T09:41:12+00:00  longevity-cdc-100gb-4h-4-2-db-node-9acee2d1-3 !ERR     | scylla: [shard 2] storage_proxy - exception during mutation write to 10.0.1.225: seastar::named_semaphore_timed_out (Semaphore timed out: smp_service_group#2 10->2 semaphore)
2020-10-01T09:41:12+00:00  longevity-cdc-100gb-4h-4-2-db-node-9acee2d1-3 !ERR     | scylla: [shard 2] storage_proxy - exception during mutation write to 10.0.1.225: seastar::named_semaphore_timed_out (Semaphore timed out: smp_service_group#2 10->2 semaphore)
2020-10-01T09:41:12+00:00  longevity-cdc-100gb-4h-4-2-db-node-9acee2d1-3 !ERR     | scylla: [shard 2] storage_proxy - exception during mutation write to 10.0.1.225: seastar::named_semaphore_timed_out (Semaphore timed out: smp_service_group#2 10->2 semaphore)
2020-10-01T09:41:12+00:00  longevity-cdc-100gb-4h-4-2-db-node-9acee2d1-3 !ERR     | scylla: [shard 2] storage_proxy - exception during mutation write to 10.0.1.225: seastar::named_semaphore_timed_out (Semaphore timed out: smp_service_group#2 10->2 semaphore)
2020-10-01T09:41:12+00:00  longevity-cdc-100gb-4h-4-2-db-node-9acee2d1-3 !ERR     | scylla: [shard 2] storage_proxy - exception during mutation write to 10.0.1.225: seastar::named_semaphore_timed_out (Semaphore timed out: smp_service_group#2 10->2 semaphore)
Here is a live snapshot: https://snapshot.raintank.io/dashboard/snapshot/m9Vn7OPpyjSBS6uebe7U2k4dNpE9uAfE?orgId=2
aleksbykov
on 2 Oct 2020
During this job https://jenkins.scylladb.com/job/scylla-4.2/job/longevity/job/longevity-cdc-100gb-4h-test/56/
for scylla version 4.2.rc5-0.20201001.5fcc1f205c command nodetool repair again failed with next error:
I confirm that the Scylla version used in the test has Eliran's fix. So, group #2 is regular writes, and #3 is hints:
storage_proxy_smp_service_group_config.max_nonlocal_requests = 5000;
spcfg.read_smp_service_group = create_smp_service_group(storage_proxy_smp_service_group_config).get0();
spcfg.write_smp_service_group = create_smp_service_group(storage_proxy_smp_service_group_config).get0();
spcfg.hints_write_smp_service_group = create_smp_service_group(storage_proxy_smp_service_group_config).get0();
spcfg.write_ack_smp_service_group = create_smp_service_group(storage_proxy_smp_service_group_config).get0();
(AFAIK IDs are allocated sequentially and 0 is reserved for the default smp group, so #2 is normal writes and #3 is hints)
Nearly all smp semaphore timeouts happened on node 3. They came from both normal write and hints group:
[piodul@localhost longevity-cdc-100gb-4h-4-2-db-node-9acee2d1-3]$ grep "smp_service_group#" messages.log | sed 's/^.*smp_service_group#\([0-9]\).*$/\1/' | sort | uniq -c
 322831 2
 164884 3
There are nearly twice as many timeouts on normal write group than hints group - but to be completely fair, the log was rate-limited and lots of error messages were skipped, so I'm not sure how much sense this proportion has.
piodul
on 4 Oct 2020
There was also a significant increase in time spent in streaming scheduling group:
...and task quota violations in main, compaction, statement and streaming groups:
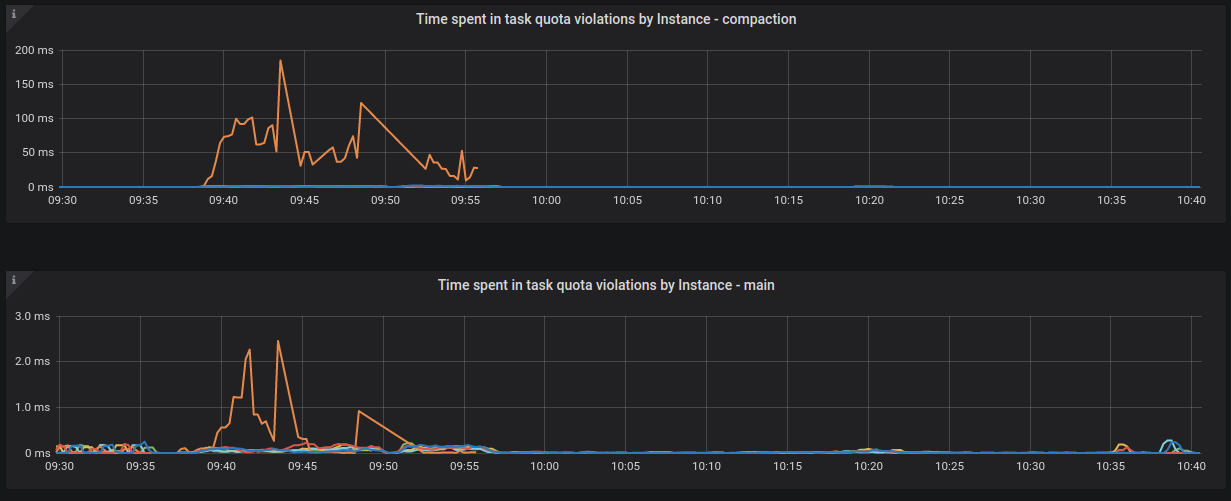
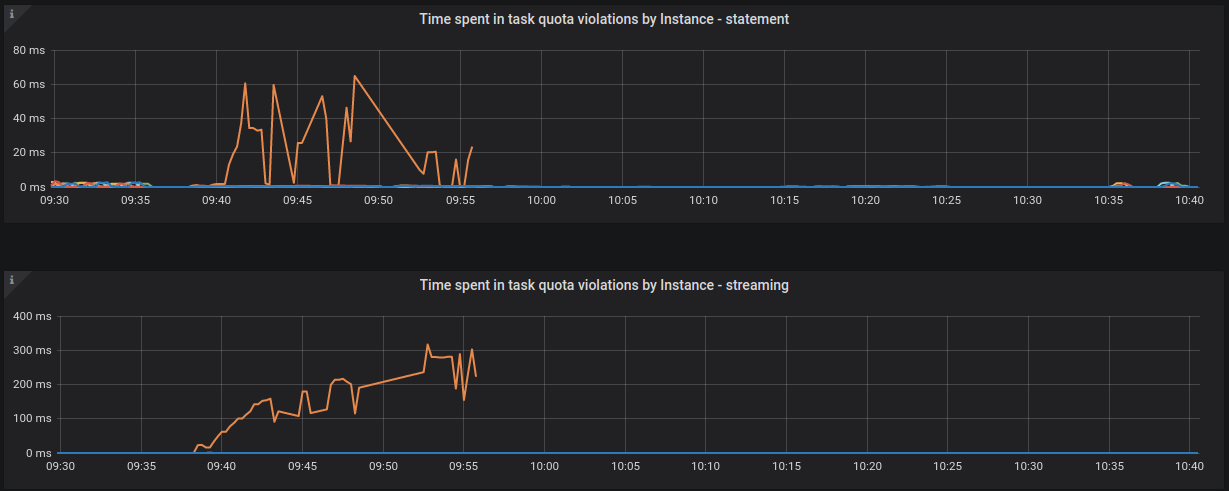
It can also be seen that around 9:55 we stopped receiving metrics from node3 - the orange line abruptly ends. The node was still working because it kept writing messages to its log.
This situation does not improve later - there was only a very small number of time points after that in which we managed to collect metrics.
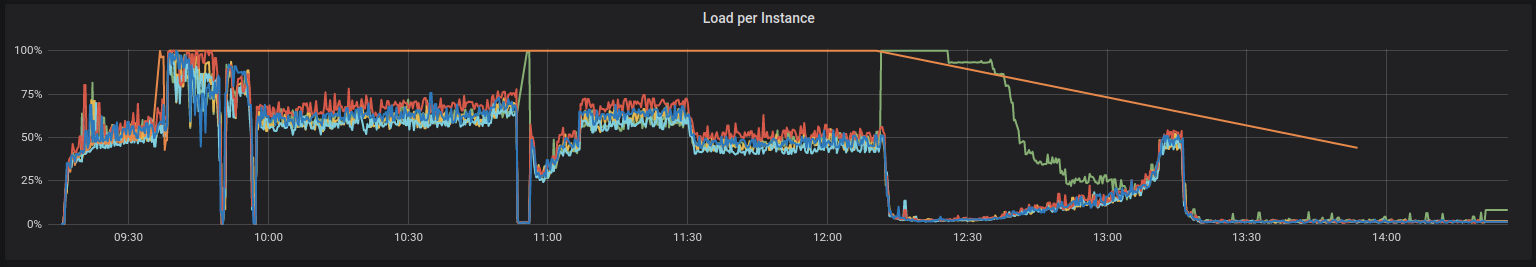
I'm not sure why it could happen. Maybe CPU was loaded so much that it didn't respond in time to prometheus collecting metrics? The graphs seem to indicate that node3 had 100% CPU utilization:
piodul
on 4 Oct 2020
In the logs, I manager to find the following error on node3, which seems to be the cause of repair failure:
2020-10-01T10:34:58+00:00 longevity-cdc-100gb-4h-4-2-db-node-9acee2d1-3 !INFO | scylla: [shard 0] repair - repair_tracker run for repair id 2 failed: std::runtime_error ({shard 0: std::runtime_error (get_repair_meta: repair_meta_id 89595 for node 10.0.1.225 does not exist), shard 1: std::runtime_error (get_repair_meta: repair_meta_id 94140 for node 10.0.1.225 does not exist), shard 2: std::runtime_error (get_repair_meta: repair_meta_id 90601 for node 10.0.1.225 does not exist), shard 3: std::runtime_error (get_repair_meta: repair_meta_id 90381 for node 10.0.1.225 does not exist), shard 4: std::runtime_error (get_repair_meta: repair_meta_id 91121 for node 10.0.1.225 does not exist), shard 5: std::runtime_error (get_repair_meta: repair_meta_id 91138 for node 10.0.1.225 does not exist), shard 6: std::runtime_error (get_repair_meta: repair_meta_id 91039 for node 10.0.1.225 does not exist), shard 7: std::runtime_error (get_repair_meta: repair_meta_id 91093 for node 10.0.1.225 does not exist), shard 8: std::runtime_error (get_repair_meta: repair_meta_id 93457 for node 10.0.1.225 does not exist), shard 9: std::runtime_error (get_repair_meta: repair_meta_id 94263 for node 10.0.1.225 does not exist), shard 10: std::runtime_error (get_repair_meta: repair_meta_id 93664 for node 10.0.1.225 does not exist), shard 11: std::runtime_error (get_repair_meta: repair_meta_id 90669 for node 10.0.1.225 does not exist), shard 12: std::runtime_error (get_repair_meta: repair_meta_id 90963 for node 10.0.1.225 does not exist), shard 13: std::runtime_error (get_repair_meta: repair_meta_id 91179 for node 10.0.1.225 does not exist)})
I'm not familiar with how repair works, so I have no idea what it means. @asias, do you know what it is?
piodul
on 4 Oct 2020
In the meantime, hints seem to behave OK during the repair (the repair lasted between around 9:38 and 10:34):
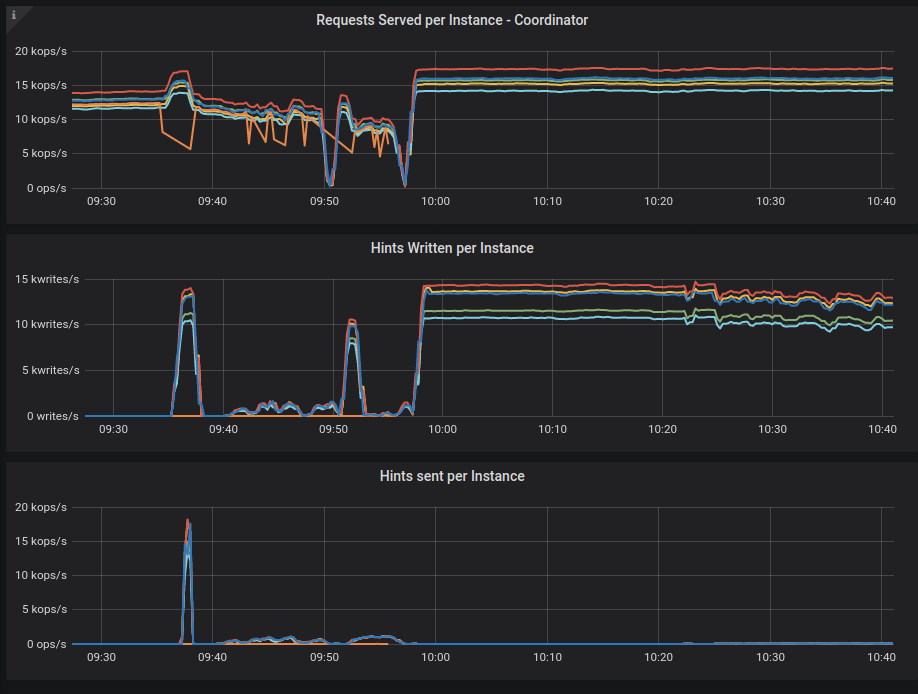
There are lots of hints being written to disk on other nodes, probably because replica writes to node3 were timing out.
As for hints sending, there is an initial spike of hints at the beginning being sent to node3, because CorruptThenRepair nemesis performed a restart of the node3, and some hints were accumulated while node3 was down.
After that, the hint sending rate did not exceed around 1,2k per node, while each node was serving between 14-17k total requests/s - so hints constituted below 10% of total throughput.
piodul
on 4 Oct 2020
I think that we might want to try it also with a shard aware driver to see what will happen then. IMO there are two possibilities:
- the cross shard semaphores don't serve their purpose in this specific use-case or maybe there is a deadlock somewhere (we know it can happen if the same semaphore is taken twice for example), creating an even worse than expected performance for non shard aware clients, this will be the explanation if the test will pass with the shard aware driver.
- The semaphore do serve it's purpose (I don't think it's likely) and there is time out simply because we have an overload case, then we can argue that we've better timing out than exhausting some shards memory.
eliransin
on 4 Oct 2020
@aleksbykov could you re-run the test with Eliran's suggestion (with HH on and with cassandra-stress that is shard-aware)?
piodul
on 14 Oct 2020
@piodul
yes, i will do
aleksbykov
on 14 Oct 2020
@piodul @eliransin
Job with HH on with shard-awareness driver had finished.
Here are the nodes:
| longevity-cdc-100gb-4h-reproduc-db-node-3db58271-1 | 13.48.104.83 |
| longevity-cdc-100gb-4h-reproduc-db-node-3db58271-2 | 13.48.55.102 |
| longevity-cdc-100gb-4h-reproduc-db-node-3db58271-3 | 13.48.84.67  |
| longevity-cdc-100gb-4h-reproduc-db-node-3db58271-4 | 13.49.78.229 |
| longevity-cdc-100gb-4h-reproduc-db-node-3db58271-6 | 13.49.18.119 |
| longevity-cdc-100gb-4h-reproduc-db-node-3db58271-5 | 13.48.13.3   |
Live monitoring stack:
http://13.53.106.121:3000
After CorrupThenRepair one node stay DN.
aleksbykov
on 15 Oct 2020
aleksbykov
on 15 Oct 2020
On node 6 coredump:
2020-10-14 14:35:27.000: (CoreDumpEvent Severity.ERROR): node=Node longevity-cdc-100gb-4h-reproduc-db-node-3db58271-6 [13.49.18.119 | 10.0.0.241] (seed: False)
corefile_url=
https://storage.cloud.google.com/upload.scylladb.com/core.scylla.997.54d30d70b3224784971f9007fe08e661.68273.1602686127000000/core.scylla.997.54d30d70b3224784971f9007fe08e661.68273.1602686127000000.gz
backtrace=           PID: 68273 (scylla)
           UID: 997 (scylla)
           GID: 1001 (scylla)
        Signal: 6 (ABRT)
     Timestamp: Wed 2020-10-14 14:35:27 UTC (3min 4s ago)
  Command Line: /usr/bin/scylla --blocked-reactor-notify-ms 500 --abort-on-lsa-bad-alloc 1 --abort-on-seastar-bad-alloc --abort-on-internal-error 1 --abort-on-ebadf 1 --experimental-features cdc --log-to-syslog 1 --log-to-stdout 0 --default-log-level info --network-stack posix --io-properties-file=/etc/scylla.d/io_properties.yaml --cpuset 1-7,9-15 --lock-memory=1
    Executable: /opt/scylladb/libexec/scylla
 Control Group: /
       Boot ID: 54d30d70b3224784971f9007fe08e661
    Machine ID: 93f219319dd5bdb42d9f1c8f2e23d329
      Hostname: longevity-cdc-100gb-4h-reproduc-db-node-3db58271-6
      Coredump: /var/lib/systemd/coredump/core.scylla.997.54d30d70b3224784971f9007fe08e661.68273.1602686127000000
       Message: Process 68273 (scylla) of user 997 dumped core.

                Stack trace of thread 68278:
                #0  0x00007f754d9579e5 raise (libc.so.6)
                #1  0x00007f754d94094d abort (libc.so.6)
                #2  0x0000000002e4ebe3 _ZN7seastar17on_internal_errorERNS_6loggerESt17basic_string_viewIcSt11char_traitsIcEE (scylla)
                #3  0x0000000001185754 on_validation_error (scylla)
                #4  0x00000000011a1614 _ZN42mutation_fragment_stream_validating_filter16on_end_of_streamEv (scylla)
                #5  0x000000000124ac10 _ZZN8sstables7sstable16write_componentsE20flat_mutation_readermN7seastar13lw_shared_ptrIK6schemaEERKNS_21sstable_writer_configE14encoding_statsRKNS2_17io_priority_classEENUlvE_clEv (scylla)
                #6  0x000000000124b604 __invoke_impl<void, sstables::sstable::write_components(flat_mutation_reader, uint64_t, sstables::schema_ptr, const sstables::sstable_writer_config&, encoding_stats, const seastar::io_priority_class&)::<lambda()> > (scylla)
                #7  0x000000000314b14d _ZNK7seastar20noncopyable_functionIFvvEEclEv (scylla)

                Stack trace of thread 68290:
                #0  0x00007f754e3a39ac read (libpthread.so.0)
                #1  0x0000000003112a87 _ZN7seastar11thread_pool4workENS_13basic_sstringIcjLj15ELb1EEE (scylla)
                #2  0x0000000003112ce8 operator() (scylla)
                #3  0x0000000002e4ee6e _ZNKSt8functionIFvvEEclEv (scylla)
                #4  0x00007f754e399432 start_thread (libpthread.so.0)
                #5  0x00007f754da1c913 __clone (libc.so.6)

                Stack trace of thread 68288:
                #0  0x00007f754e3a39ac read (libpthread.so.0)
                #1  0x0000000003112a87 _ZN7seastar11thread_pool4workENS_13basic_sstringIcjLj15ELb1EEE (scylla)
                #2  0x0000000003112ce8 operator() (scylla)
                #3  0x0000000002e4ee6e _ZNKSt8functionIFvvEEclEv (scylla)
                #4  0x00007f754e399432 start_thread (libpthread.so.0)
                #5  0x00007f754da1c913 __clone (libc.so.6)

                Stack trace of thread 68293:
                #0  0x00007f754e3a39ac read (libpthread.so.0)
                #1  0x0000000003112a87 _ZN7seastar11thread_pool4workENS_13basic_sstringIcjLj15ELb1EEE (scylla)
                #2  0x0000000003112ce8 operator() (scylla)
                #3  0x0000000002e4ee6e _ZNKSt8functionIFvvEEclEv (scylla)
                #4  0x00007f754e399432 start_thread (libpthread.so.0)
                #5  0x00007f754da1c913 __clone (libc.so.6)

                Stack trace of thread 68295:
                #0  0x00007f754e3a39ac read (libpthread.so.0)
                #1  0x0000000003112a87 _ZN7seastar11thread_pool4workENS_13basic_sstringIcjLj15ELb1EEE (scylla)
                #2  0x0000000003112ce8 operator() (scylla)
                #3  0x0000000002e4ee6e _ZNKSt8functionIFvvEEclEv (scylla)
                #4  0x00007f754e399432 start_thread (libpthread.so.0)
                #5  0x00007f754da1c913 __clone (libc.so.6)

                Stack trace of thread 68299:
                #0  0x00007f754e3a39ac read (libpthread.so.0)
                #1  0x0000000003112a87 _ZN7seastar11thread_pool4workENS_13basic_sstringIcjLj15ELb1EEE (scylla)
                #2  0x0000000003112ce8 operator() (scylla)
                #3  0x0000000002e4ee6e _ZNKSt8functionIFvvEEclEv (scylla)
                #4  0x00007f754e399432 start_thread (libpthread.so.0)
                #5  0x00007f754da1c913 __clone (libc.so.6)

                Stack trace of thread 68291:
                #0  0x00007f754e3a39ac read (libpthread.so.0)
                #1  0x0000000003112a87 _ZN7seastar11thread_pool4workENS_13basic_sstringIcjLj15ELb1EEE (scylla)
                #2  0x0000000003112ce8 operator() (scylla)
                #3  0x0000000002e4ee6e _ZNKSt8functionIFvvEEclEv (scylla)
                #4  0x00007f754e399432 start_thread (libpthread.so.0)
                #5  0x00007f754da1c913 __clone (libc.so.6)

                Stack trace of thread 68301:
                #0  0x00007f754e3a39ac read (libpthread.so.0)
                #1  0x0000000003112a87 _ZN7seastar11thread_pool4workENS_13basic_sstringIcjLj15ELb1EEE (scylla)
                #2  0x0000000003112ce8 operator() (scylla)
                #3  0x0000000002e4ee6e _ZNKSt8functionIFvvEEclEv (scylla)
                #4  0x00007f754e399432 start_thread (libpthread.so.0)
                #5  0x00007f754da1c913 __clone (libc.so.6)

                Stack trace of thread 68300:
                #0  0x00007f754e3a39ac read (libpthread.so.0)
                #1  0x0000000003112a87 _ZN7seastar11thread_pool4workENS_13basic_sstringIcjLj15ELb1EEE (scylla)
                #2  0x0000000003112ce8 operator() (scylla)
                #3  0x0000000002e4ee6e _ZNKSt8functionIFvvEEclEv (scylla)
                #4  0x00007f754e399432 start_thread (libpthread.so.0)
                #5  0x00007f754da1c913 __clone (libc.so.6)

                Stack trace of thread 68294:
                #0  0x00007f754e3a39ac read (libpthread.so.0)
                #1  0x0000000003112a87 _ZN7seastar11thread_pool4workENS_13basic_sstringIcjLj15ELb1EEE (scylla

download_instructions=
gsutil cp gs://upload.scylladb.com/core.scylla.997.54d30d70b3224784971f9007fe08e661.68273.1602686127000000/core.scylla.997.54d30d70b3224784971f9007fe08e661.68273.1602686127000000.gz .
gunzip /var/lib/systemd/coredump/core.scylla.997.54d30d70b3224784971f9007fe08e661.68273.1602686127000000.gz
@aleksbykov Thanks for running the test. Are logs/metrics available as usual through hydra? If so, please terminate the cluster, I think that metrics and logs from hydra will suffice.
piodul
on 15 Oct 2020
@piodul
hydra investigate show-logs 3db58271-0a0f-4c20-a60a-3ab3bd47b6e6 - to get links for logs
hydra investigate show-monitor 3db58271-0a0f-4c20-a60a-3ab3bd47b6e6 - to restore metrics
aleksbykov
on 16 Oct 2020
@asias / @denesb looking at the backtrace this seems simillar to other issues we had with stream validation when a node is restarted in the middle - stream validation fails.
Please confirm, if this is the case - I'll reassign this to you guys @piodul / @haaawk please wait for an answer and don't continue investigation on your end till we have an answer on this.
slivne
on 26 Oct 2020
Yes, the backtrace from https://github.com/scylladb/scylla/issues/7025#issuecomment-709073896 shows we hit the validator issue. Before we improve the validator to support abort, @slivne @denesb I think we should disable --abort_on_internal_error flag in the QA tests we we can focus on other real issues. We will still see the validation errors so we won't forget this issue.
Stack trace of thread 68278:
                #0  0x00007f754d9579e5 raise (libc.so.6)
                #1  0x00007f754d94094d abort (libc.so.6)
                #2  0x0000000002e4ebe3 _ZN7seastar17on_internal_errorERNS_6loggerESt17basic_string_viewIcSt11char_traitsIcEE (scylla)
                #3  0x0000000001185754 on_validation_error (scylla)
                #4  0x00000000011a1614 _ZN42mutation_fragment_stream_validating_filter16on_end_of_streamEv (scylla)
                #5  0x000000000124ac10 _ZZN8sstables7sstable16write_componentsE20flat_mutation_readermN7seastar13lw_shared_ptrIK6schemaEERKNS_21sstable_writer_configE14encoding_statsRKNS2_17io_priority_classEENUlvE_clEv (scylla)
                #6  0x000000000124b604 __invoke_impl<void, sstables::sstable::write_components(flat_mutation_reader, uint64_t, sstables::schema_ptr, const sstables::sstable_writer_config&, encoding_stats, const seastar::io_priority_class&)::<lambda()> > (scylla)
                #7  0x000000000314b14d _ZNK7seastar20noncopyable_functionIFvvEEclEv (scylla)
In the logs, I manager to find the following error on node3, which seems to be the cause of repair failure:
2020-10-01T10:34:58+00:00 longevity-cdc-100gb-4h-4-2-db-node-9acee2d1-3 !INFO | scylla: [shard 0] repair - repair_tracker run for repair id 2 failed: std::runtime_error ({shard 0: std::runtime_error (get_repair_meta: repair_meta_id 89595 for node 10.0.1.225 does not exist), shard 1: std::runtime_error (get_repair_meta: repair_meta_id 94140 for node 10.0.1.225 does not exist), shard 2: std::runtime_error (get_repair_meta: repair_meta_id 90601 for node 10.0.1.225 does not exist), shard 3: std::runtime_error (get_repair_meta: repair_meta_id 90381 for node 10.0.1.225 does not exist), shard 4: std::runtime_error (get_repair_meta: repair_meta_id 91121 for node 10.0.1.225 does not exist), shard 5: std::runtime_error (get_repair_meta: repair_meta_id 91138 for node 10.0.1.225 does not exist), shard 6: std::runtime_error (get_repair_meta: repair_meta_id 91039 for node 10.0.1.225 does not exist), shard 7: std::runtime_error (get_repair_meta: repair_meta_id 91093 for node 10.0.1.225 does not exist), shard 8: std::runtime_error (get_repair_meta: repair_meta_id 93457 for node 10.0.1.225 does not exist), shard 9: std::runtime_error (get_repair_meta: repair_meta_id 94263 for node 10.0.1.225 does not exist), shard 10: std::runtime_error (get_repair_meta: repair_meta_id 93664 for node 10.0.1.225 does not exist), shard 11: std::runtime_error (get_repair_meta: repair_meta_id 90669 for node 10.0.1.225 does not exist), shard 12: std::runtime_error (get_repair_meta: repair_meta_id 90963 for node 10.0.1.225 does not exist), shard 13: std::runtime_error (get_repair_meta: repair_meta_id 91179 for node 10.0.1.225 does not exist)})
I'm not familiar with how repair works, so I have no idea what it means. @asias, do you know what it is?
Say we have n1, n2. n1 runs repair. n2 marks n1 down in gossip. n2 will remove all repair meta data with n1. when n1 tries to run repair with n1 again, n2 will report repair meta data can not be found. This is expected. The problem is n2 marks n1 down for some reason.
asias
on 27 Oct 2020
We fixed theend of stream issue - we need to validate whats the status of this issue
slivne
on 21 Dec 2020
@slivne , run reproducers on master and 4.3?
aleksbykov
on 21 Dec 2020
Issue reproduced on
Scylla version (or git commit hash): 4.4.dev-0.20201222.da7e87dc5 with build-id aa68864677dc1be288a25b2b585a163f29c73880
Cluster size: 6 nodes (i3.4xlarge)
OS (RHEL/CentOS/Ubuntu/AWS AMI): ami-0bd80fd03ad630f16 (aws: eu-north-1)
Test: longevity-cdc-100gb-4h-test
Test name: longevity_test.LongevityTest.test_custom_time
Test config file(s):
- [longevity-cdc-100gb-4h.yaml] (https://github.com/scylladb/scylla-cluster-tests/blob/ca8a02961c8a045df4e2ea49d1cc2fde06d11620/test-cases/longevity/longevity-cdc-100gb-4h.yaml)
Restore Monitor Stack command: $ hydra investigate show-monitor fbcc902f-6a40-4dae-8ba6-273e4c3ea42e
Show all stored logs command: $ hydra investigate show-logs fbcc902f-6a40-4dae-8ba6-273e4c3ea42e
Test id: fbcc902f-6a40-4dae-8ba6-273e4c3ea42e
Logs:
db-cluster - https://cloudius-jenkins-test.s3.amazonaws.com/fbcc902f-6a40-4dae-8ba6-273e4c3ea42e/20201223_055850/db-cluster-fbcc902f.zip
monitor-set - https://cloudius-jenkins-test.s3.amazonaws.com/fbcc902f-6a40-4dae-8ba6-273e4c3ea42e/20201223_055850/monitor-set-fbcc902f.zip
on node 3 nemesis CorruptThenRepair nemesis was running. This nemesis stop scylla, remove several sstables, start scylla and run nodetool repair.
on node3 after scylla was started again. reshaping for *_cdc_scylla_log tables were first run. Then during repair a lot of errors:
2020-12-23T03:13:15+00:00  longevity-cdc-100gb-4h-master-db-node-fbcc902f-3 !INFO    | scylla: [shard 4] repair - Repair 621 out of 768 ranges, id=[id=3, uuid=11b12d5e-fe22-4249-9ad8-f0f2c97bc7b3], shard=4, keyspace=cdc_test, table={test_table_postimage_scylla_cdc_log, test_table, test_table_preimage, test_table_scylla_cdc_log, test_table_preimage_scylla_cdc_log, test_table_preimage_postimage, test_table_preimage_postimage_scylla_cdc_log, test_table_postimage}, range=(6193756115618466922, 6211663950097106878]
2020-12-23T03:13:15+00:00  longevity-cdc-100gb-4h-master-db-node-fbcc902f-3 !WARNING | scylla: [shard 0] repair - repair id [id=3, uuid=11b12d5e-fe22-4249-9ad8-f0f2c97bc7b3] on shard 0, keyspace=cdc_test, cf=test_table_scylla_cdc_log, range=(6026428027869041103, 6031887802956078081], got error in row level repair: std::runtime_error (get_full_row_hashes: Peer failed to process)
2020-12-23T03:13:15+00:00  longevity-cdc-100gb-4h-master-db-node-fbcc902f-3 !WARNING | scylla: [shard 1] repair - repair id [id=3, uuid=11b12d5e-fe22-4249-9ad8-f0f2c97bc7b3] on shard 1, keyspace=cdc_test, cf=test_table_preimage, range=(5766976298176155940, 5778732351316734686], got error in row level repair: std::runtime_error (put_row_diff: Repair follower=10.0.1.31 failed in put_row_diff hanlder, status=0)
2020-12-23T03:13:15+00:00  longevity-cdc-100gb-4h-master-db-node-fbcc902f-3 !WARNING | scylla: [shard 7] repair - repair id [id=3, uuid=11b12d5e-fe22-4249-9ad8-f0f2c97bc7b3] on shard 7, keyspace=cdc_test, cf=test_table_scylla_cdc_log, range=(6228432913545426032, 6244349246298838366], got error in row level repair: std::runtime_error (get_repair_meta: repair_meta_id 116230 for node 10.0.1.9 does not exist)

2020-12-23T04:27:37+00:00  longevity-cdc-100gb-4h-master-db-node-fbcc902f-3 !ERR     | scylla: [shard 8] storage_proxy - exception during mutation write to 10.0.1.9: seastar::named_semaphore_timed_out (Semaphore timed out: smp_service_group#2 11->8 semaphore)
2020-12-23T04:27:37+00:00  longevity-cdc-100gb-4h-master-db-node-fbcc902f-3 !ERR     | scylla: [shard 13] storage_proxy - exception during mutation write to 10.0.1.9: seastar::named_semaphore_timed_out (Semaphore timed out: smp_service_group#2 3->13 semaphore)
2020-12-23T04:27:37+00:00  longevity-cdc-100gb-4h-master-db-node-fbcc902f-3 !ERR     | scylla: [shard 6] storage_proxy - exception during mutation write to 10.0.1.9: seastar::named_semaphore_timed_out (Semaphore timed out: smp_service_group#2 11->6 semaphore)
the command nodetool repair failed:
Command: '/usr/bin/nodetool  repair '

Exit code: 2

Stdout:

Using /etc/scylla/scylla.yaml as the config file
[2020-12-23 03:03:23,340] Starting repair command #1, repairing 1 ranges for keyspace system_auth (parallelism=SEQUENTIAL, full=true)
[2020-12-23 03:03:27,459] Repair session 1
[2020-12-23 03:03:27,461] Repair session 1 finished
[2020-12-23 03:03:27,521] Starting repair command #2, repairing 1 ranges for keyspace system_traces (parallelism=SEQUENTIAL, full=true)
[2020-12-23 03:03:29,640] Repair session 2
[2020-12-23 03:03:29,643] Repair session 2 finished
[2020-12-23 03:03:29,741] Starting repair command #3, repairing 1 ranges for keyspace cdc_test (parallelism=SEQUENTIAL, full=true)
[2020-12-23 04:00:27,776] Repair session 3 failed
[2020-12-23 04:00:27,779] Repair session 3 finished

Stderr:

error: Repair job has failed with the error message: [2020-12-23 04:00:27,776] Repair session 3 failed
-- StackTrace --
java.lang.RuntimeException: Repair job has failed with the error message: [2020-12-23 04:00:27,776] Repair session 3 failed
    at org.apache.cassandra.tools.RepairRunner.progress(RepairRunner.java:124)
    at org.apache.cassandra.utils.progress.jmx.JMXNotificationProgressListener.handleNotification(JMXNotificationProgressListener.java:77)
    at com.sun.jmx.remote.internal.ClientNotifForwarder$NotifFetcher.dispatchNotification(ClientNotifForwarder.java:583)
    at com.sun.jmx.remote.internal.ClientNotifForwarder$NotifFetcher.doRun(ClientNotifForwarder.java:533)
    at com.sun.jmx.remote.internal.ClientNotifForwarder$NotifFetcher.run(ClientNotifForwarder.java:452)
    at com.sun.jmx.remote.internal.ClientNotifForwarder$LinearExecutor$1.run(ClientNotifForwarder.java:108)
And node3 got statud DN.
aleksbykov
on 23 Dec 2020
Issue reproduced on
Scylla version (or git commit hash):4.4.dev-0.20201222.da7e87dc5 with build-id aa68864677dc1be288a25b2b585a163f29c73880
Cluster size: 6 nodes (i3.4xlarge)
OS (RHEL/CentOS/Ubuntu/AWS AMI):ami-0bd80fd03ad630f16(aws: eu-north-1)Test:
longevity-cdc-100gb-4h-test
Test name:longevity_test.LongevityTest.test_custom_time
Test config file(s):
- [longevity-cdc-100gb-4h.yaml] (https://github.com/scylladb/scylla-cluster-tests/blob/ca8a02961c8a045df4e2ea49d1cc2fde06d11620/test-cases/longevity/longevity-cdc-100gb-4h.yaml)
Restore Monitor Stack command:
$ hydra investigate show-monitor fbcc902f-6a40-4dae-8ba6-273e4c3ea42e
Show all stored logs command:$ hydra investigate show-logs fbcc902f-6a40-4dae-8ba6-273e4c3ea42eTest id:
fbcc902f-6a40-4dae-8ba6-273e4c3ea42eLogs:
db-cluster - https://cloudius-jenkins-test.s3.amazonaws.com/fbcc902f-6a40-4dae-8ba6-273e4c3ea42e/20201223_055850/db-cluster-fbcc902f.zip
monitor-set - https://cloudius-jenkins-test.s3.amazonaws.com/fbcc902f-6a40-4dae-8ba6-273e4c3ea42e/20201223_055850/monitor-set-fbcc902f.zipon node 3 nemesis CorruptThenRepair nemesis was running. This nemesis stop scylla, remove several sstables, start scylla and run nodetool repair.
on node3 after scylla was started again. reshaping for *_cdc_scylla_log tables were first run. Then during repair a lot of errors:2020-12-23T03:13:15+00:00 longevity-cdc-100gb-4h-master-db-node-fbcc902f-3 !INFO | scylla: [shard 4] repair - Repair 621 out of 768 ranges, id=[id=3, uuid=11b12d5e-fe22-4249-9ad8-f0f2c97bc7b3], shard=4, keyspace=cdc_test, table={test_table_postimage_scylla_cdc_log, test_table, test_table_preimage, test_table_scylla_cdc_log, test_table_preimage_scylla_cdc_log, test_table_preimage_postimage, test_table_preimage_postimage_scylla_cdc_log, test_table_postimage}, range=(6193756115618466922, 6211663950097106878] 2020-12-23T03:13:15+00:00 longevity-cdc-100gb-4h-master-db-node-fbcc902f-3 !WARNING | scylla: [shard 0] repair - repair id [id=3, uuid=11b12d5e-fe22-4249-9ad8-f0f2c97bc7b3] on shard 0, keyspace=cdc_test, cf=test_table_scylla_cdc_log, range=(6026428027869041103, 6031887802956078081], got error in row level repair: std::runtime_error (get_full_row_hashes: Peer failed to process) 2020-12-23T03:13:15+00:00 longevity-cdc-100gb-4h-master-db-node-fbcc902f-3 !WARNING | scylla: [shard 1] repair - repair id [id=3, uuid=11b12d5e-fe22-4249-9ad8-f0f2c97bc7b3] on shard 1, keyspace=cdc_test, cf=test_table_preimage, range=(5766976298176155940, 5778732351316734686], got error in row level repair: std::runtime_error (put_row_diff: Repair follower=10.0.1.31 failed in put_row_diff hanlder, status=0) 2020-12-23T03:13:15+00:00 longevity-cdc-100gb-4h-master-db-node-fbcc902f-3 !WARNING | scylla: [shard 7] repair - repair id [id=3, uuid=11b12d5e-fe22-4249-9ad8-f0f2c97bc7b3] on shard 7, keyspace=cdc_test, cf=test_table_scylla_cdc_log, range=(6228432913545426032, 6244349246298838366], got error in row level repair: std::runtime_error (get_repair_meta: repair_meta_id 116230 for node 10.0.1.9 does not exist) 2020-12-23T04:27:37+00:00 longevity-cdc-100gb-4h-master-db-node-fbcc902f-3 !ERR | scylla: [shard 8] storage_proxy - exception during mutation write to 10.0.1.9: seastar::named_semaphore_timed_out (Semaphore timed out: smp_service_group#2 11->8 semaphore) 2020-12-23T04:27:37+00:00 longevity-cdc-100gb-4h-master-db-node-fbcc902f-3 !ERR | scylla: [shard 13] storage_proxy - exception during mutation write to 10.0.1.9: seastar::named_semaphore_timed_out (Semaphore timed out: smp_service_group#2 3->13 semaphore) 2020-12-23T04:27:37+00:00 longevity-cdc-100gb-4h-master-db-node-fbcc902f-3 !ERR | scylla: [shard 8] storage_proxy - exception during mutation write to 10.0.1.9: seastar::named_semaphore_timed_out (Semaphore timed out: smp_service_group#2 11->8 semaphore) 2020-12-23T04:27:37+00:00 longevity-cdc-100gb-4h-master-db-node-fbcc902f-3 !ERR | scylla: [shard 13] storage_proxy - exception during mutation write to 10.0.1.9: seastar::named_semaphore_timed_out (Semaphore timed out: smp_service_group#2 3->13 semaphore) 2020-12-23T04:27:37+00:00 longevity-cdc-100gb-4h-master-db-node-fbcc902f-3 !ERR | scylla: [shard 6] storage_proxy - exception during mutation write to 10.0.1.9: seastar::named_semaphore_timed_out (Semaphore timed out: smp_service_group#2 11->6 semaphore)the command nodetool repair failed:
Command: '/usr/bin/nodetool  repair '

Exit code: 2

Stdout:

Using /etc/scylla/scylla.yaml as the config file
[2020-12-23 03:03:23,340] Starting repair command #1, repairing 1 ranges for keyspace system_auth (parallelism=SEQUENTIAL, full=true)
[2020-12-23 03:03:27,459] Repair session 1
[2020-12-23 03:03:27,461] Repair session 1 finished
[2020-12-23 03:03:27,521] Starting repair command #2, repairing 1 ranges for keyspace system_traces (parallelism=SEQUENTIAL, full=true)
[2020-12-23 03:03:29,640] Repair session 2
[2020-12-23 03:03:29,643] Repair session 2 finished
[2020-12-23 03:03:29,741] Starting repair command #3, repairing 1 ranges for keyspace cdc_test (parallelism=SEQUENTIAL, full=true)
[2020-12-23 04:00:27,776] Repair session 3 failed
[2020-12-23 04:00:27,779] Repair session 3 finished

Stderr:

error: Repair job has failed with the error message: [2020-12-23 04:00:27,776] Repair session 3 failed
-- StackTrace --
java.lang.RuntimeException: Repair job has failed with the error message: [2020-12-23 04:00:27,776] Repair session 3 failed
  at org.apache.cassandra.tools.RepairRunner.progress(RepairRunner.java:124)
  at org.apache.cassandra.utils.progress.jmx.JMXNotificationProgressListener.handleNotification(JMXNotificationProgressListener.java:77)
  at com.sun.jmx.remote.internal.ClientNotifForwarder$NotifFetcher.dispatchNotification(ClientNotifForwarder.java:583)
  at com.sun.jmx.remote.internal.ClientNotifForwarder$NotifFetcher.doRun(ClientNotifForwarder.java:533)
  at com.sun.jmx.remote.internal.ClientNotifForwarder$NotifFetcher.run(ClientNotifForwarder.java:452)
  at com.sun.jmx.remote.internal.ClientNotifForwarder$LinearExecutor$1.run(ClientNotifForwarder.java:108)
And node3 got statud DN.
This scenario was reproduced in Jenkins job URL
Installation details
Scylla version (or git commit hash): 4.4.rc3-0.20210304.c2d924757 with build-id 1d0929cbdc3fd39b79157e974cd8d08cd2610afb
Cluster size: 6 nodes (i3.4xlarge)
OS (RHEL/CentOS/Ubuntu/AWS AMI): ami-0242812f1bd719d03 (aws: eu-west-1)
Test: longevity-cdc-3d-400gb-test
Test name: longevity_test.LongevityTest.test_custom_time
Test config file(s):
The cluster is alive
Live monitor
Restore Monitor Stack command: $ hydra investigate show-monitor c1aa2d4f-9121-4de7-a351-29ebe67a8c0a
Show all stored logs command: $ hydra investigate show-logs c1aa2d4f-9121-4de7-a351-29ebe67a8c0a
Test id: c1aa2d4f-9121-4de7-a351-29ebe67a8c0a
Logs:
db-cluster - https://cloudius-jenkins-test.s3.amazonaws.com/c1aa2d4f-9121-4de7-a351-29ebe67a8c0a/20210313_204229/db-cluster-c1aa2d4f.zip
 juliayakovlev
on 16 Mar 2021
juliayakovlev
on 16 Mar 2021
Issue reproduced on
Scylla version (or git commit hash):4.4.dev-0.20201222.da7e87dc5 with build-id aa68864677dc1be288a25b2b585a163f29c73880
Cluster size: 6 nodes (i3.4xlarge)
OS (RHEL/CentOS/Ubuntu/AWS AMI):ami-0bd80fd03ad630f16(aws: eu-north-1)
Test:longevity-cdc-100gb-4h-test
Test name:longevity_test.LongevityTest.test_custom_time
Test config file(s):
- [longevity-cdc-100gb-4h.yaml] (https://github.com/scylladb/scylla-cluster-tests/blob/ca8a02961c8a045df4e2ea49d1cc2fde06d11620/test-cases/longevity/longevity-cdc-100gb-4h.yaml)
Restore Monitor Stack command:
$ hydra investigate show-monitor fbcc902f-6a40-4dae-8ba6-273e4c3ea42e
Show all stored logs command:$ hydra investigate show-logs fbcc902f-6a40-4dae-8ba6-273e4c3ea42e
Test id:fbcc902f-6a40-4dae-8ba6-273e4c3ea42e
Logs:
db-cluster - https://cloudius-jenkins-test.s3.amazonaws.com/fbcc902f-6a40-4dae-8ba6-273e4c3ea42e/20201223_055850/db-cluster-fbcc902f.zip
monitor-set - https://cloudius-jenkins-test.s3.amazonaws.com/fbcc902f-6a40-4dae-8ba6-273e4c3ea42e/20201223_055850/monitor-set-fbcc902f.zip
Jenkins job URL
on node 3 nemesis CorruptThenRepair nemesis was running. This nemesis stop scylla, remove several sstables, start scylla and run nodetool repair.
on node3 after scylla was started again. reshaping for *_cdc_scylla_log tables were first run. Then during repair a lot of errors:2020-12-23T03:13:15+00:00 longevity-cdc-100gb-4h-master-db-node-fbcc902f-3 !INFO | scylla: [shard 4] repair - Repair 621 out of 768 ranges, id=[id=3, uuid=11b12d5e-fe22-4249-9ad8-f0f2c97bc7b3], shard=4, keyspace=cdc_test, table={test_table_postimage_scylla_cdc_log, test_table, test_table_preimage, test_table_scylla_cdc_log, test_table_preimage_scylla_cdc_log, test_table_preimage_postimage, test_table_preimage_postimage_scylla_cdc_log, test_table_postimage}, range=(6193756115618466922, 6211663950097106878] 2020-12-23T03:13:15+00:00 longevity-cdc-100gb-4h-master-db-node-fbcc902f-3 !WARNING | scylla: [shard 0] repair - repair id [id=3, uuid=11b12d5e-fe22-4249-9ad8-f0f2c97bc7b3] on shard 0, keyspace=cdc_test, cf=test_table_scylla_cdc_log, range=(6026428027869041103, 6031887802956078081], got error in row level repair: std::runtime_error (get_full_row_hashes: Peer failed to process) 2020-12-23T03:13:15+00:00 longevity-cdc-100gb-4h-master-db-node-fbcc902f-3 !WARNING | scylla: [shard 1] repair - repair id [id=3, uuid=11b12d5e-fe22-4249-9ad8-f0f2c97bc7b3] on shard 1, keyspace=cdc_test, cf=test_table_preimage, range=(5766976298176155940, 5778732351316734686], got error in row level repair: std::runtime_error (put_row_diff: Repair follower=10.0.1.31 failed in put_row_diff hanlder, status=0) 2020-12-23T03:13:15+00:00 longevity-cdc-100gb-4h-master-db-node-fbcc902f-3 !WARNING | scylla: [shard 7] repair - repair id [id=3, uuid=11b12d5e-fe22-4249-9ad8-f0f2c97bc7b3] on shard 7, keyspace=cdc_test, cf=test_table_scylla_cdc_log, range=(6228432913545426032, 6244349246298838366], got error in row level repair: std::runtime_error (get_repair_meta: repair_meta_id 116230 for node 10.0.1.9 does not exist) 2020-12-23T04:27:37+00:00 longevity-cdc-100gb-4h-master-db-node-fbcc902f-3 !ERR | scylla: [shard 8] storage_proxy - exception during mutation write to 10.0.1.9: seastar::named_semaphore_timed_out (Semaphore timed out: smp_service_group#2 11->8 semaphore) 2020-12-23T04:27:37+00:00 longevity-cdc-100gb-4h-master-db-node-fbcc902f-3 !ERR | scylla: [shard 13] storage_proxy - exception during mutation write to 10.0.1.9: seastar::named_semaphore_timed_out (Semaphore timed out: smp_service_group#2 3->13 semaphore) 2020-12-23T04:27:37+00:00 longevity-cdc-100gb-4h-master-db-node-fbcc902f-3 !ERR | scylla: [shard 8] storage_proxy - exception during mutation write to 10.0.1.9: seastar::named_semaphore_timed_out (Semaphore timed out: smp_service_group#2 11->8 semaphore) 2020-12-23T04:27:37+00:00 longevity-cdc-100gb-4h-master-db-node-fbcc902f-3 !ERR | scylla: [shard 13] storage_proxy - exception during mutation write to 10.0.1.9: seastar::named_semaphore_timed_out (Semaphore timed out: smp_service_group#2 3->13 semaphore) 2020-12-23T04:27:37+00:00 longevity-cdc-100gb-4h-master-db-node-fbcc902f-3 !ERR | scylla: [shard 6] storage_proxy - exception during mutation write to 10.0.1.9: seastar::named_semaphore_timed_out (Semaphore timed out: smp_service_group#2 11->6 semaphore)the command nodetool repair failed:
Command: '/usr/bin/nodetool  repair '

Exit code: 2

Stdout:

Using /etc/scylla/scylla.yaml as the config file
[2020-12-23 03:03:23,340] Starting repair command #1, repairing 1 ranges for keyspace system_auth (parallelism=SEQUENTIAL, full=true)
[2020-12-23 03:03:27,459] Repair session 1
[2020-12-23 03:03:27,461] Repair session 1 finished
[2020-12-23 03:03:27,521] Starting repair command #2, repairing 1 ranges for keyspace system_traces (parallelism=SEQUENTIAL, full=true)
[2020-12-23 03:03:29,640] Repair session 2
[2020-12-23 03:03:29,643] Repair session 2 finished
[2020-12-23 03:03:29,741] Starting repair command #3, repairing 1 ranges for keyspace cdc_test (parallelism=SEQUENTIAL, full=true)
[2020-12-23 04:00:27,776] Repair session 3 failed
[2020-12-23 04:00:27,779] Repair session 3 finished

Stderr:

error: Repair job has failed with the error message: [2020-12-23 04:00:27,776] Repair session 3 failed
-- StackTrace --
java.lang.RuntimeException: Repair job has failed with the error message: [2020-12-23 04:00:27,776] Repair session 3 failed
    at org.apache.cassandra.tools.RepairRunner.progress(RepairRunner.java:124)
    at org.apache.cassandra.utils.progress.jmx.JMXNotificationProgressListener.handleNotification(JMXNotificationProgressListener.java:77)
    at com.sun.jmx.remote.internal.ClientNotifForwarder$NotifFetcher.dispatchNotification(ClientNotifForwarder.java:583)
    at com.sun.jmx.remote.internal.ClientNotifForwarder$NotifFetcher.doRun(ClientNotifForwarder.java:533)
    at com.sun.jmx.remote.internal.ClientNotifForwarder$NotifFetcher.run(ClientNotifForwarder.java:452)
    at com.sun.jmx.remote.internal.ClientNotifForwarder$LinearExecutor$1.run(ClientNotifForwarder.java:108)
And node3 got statud DN.
This scenario was reproduced in Jenkins job URL
_Installation details_
Scylla version (or git commit hash):4.4.rc3-0.20210304.c2d924757 with build-id 1d0929cbdc3fd39b79157e974cd8d08cd2610afb
Cluster size: 6 nodes (i3.4xlarge)
OS (RHEL/CentOS/Ubuntu/AWS AMI):ami-0242812f1bd719d03(aws: eu-west-1)Test:
longevity-cdc-3d-400gb-test
Test name:longevity_test.LongevityTest.test_custom_time
Test config file(s):The cluster is alive
Live monitorRestore Monitor Stack command:
$ hydra investigate show-monitor c1aa2d4f-9121-4de7-a351-29ebe67a8c0a
Show all stored logs command:$ hydra investigate show-logs c1aa2d4f-9121-4de7-a351-29ebe67a8c0aTest id:
c1aa2d4f-9121-4de7-a351-29ebe67a8c0aLogs:
db-cluster - https://cloudius-jenkins-test.s3.amazonaws.com/c1aa2d4f-9121-4de7-a351-29ebe67a8c0a/20210313_204229/db-cluster-c1aa2d4f.zip
@asias @slivne Do you need this cluster or I can terminate it?
juliayakovlev
on 18 Mar 2021
@asias @slivne I am going to terminate the cluster if you have no objections
juliayakovlev
on 21 Mar 2021
Please go ahead if we have logs and monitor data.
asias
on 22 Mar 2021
Related issues
 duarten
·
5Comments
duarten
·
5Comments
 dimaqq
·
6Comments
dimaqq
·
6Comments
 Ritaja
·
3Comments
Ritaja
·
3Comments
 LouayKamel
·
6Comments
LouayKamel
·
6Comments
 vladzcloudius
·
5Comments
vladzcloudius
·
5Comments
Most helpful comment
the test 1st reported (the same as the default in SCT) is 500 ms, as in the following arguments set for the test:
--blocked-reactor-notify-ms 500 --abort-on-lsa-bad-alloc 1 --abort-on-seastar-bad-alloc --abort-on-internal-error 1 --abort-on-ebadf 1 --experimental-features cdc