Scylla: Performance regression of 780% in p99th latency compared to 2.2.0 for 100% read test
Installation details
Scylla version (or git commit hash): 2.3.rc0-0.20180722.a77bb1fe3
Cluster size: 3
OS (RHEL/CentOS/Ubuntu/AWS AMI): AWS AMI (ami-905252ef)
instance type: i3.4xlarge
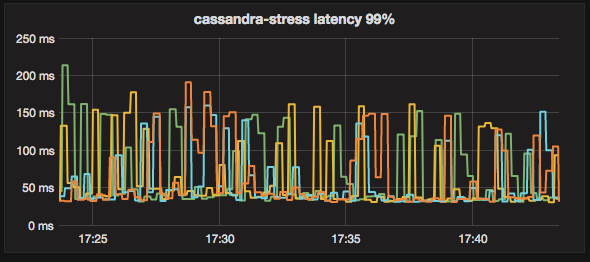
test_latency_read results showing 780% regression in p99th latency compared to 2.2.0:
Version | Op rate total | Latency mean | Latency 99th percentile
-- | -- | -- | --
2.2.0 | 39997.0 [2018-07-19 10:26:37] | 1.4 [2018-07-19 10:26:37] | 3.1 [2018-07-19 10:26:37]
2.3.0 | 37200.0 (6% Regression) | 8.2 (485% Regression) | 27.3 (780% Regression)
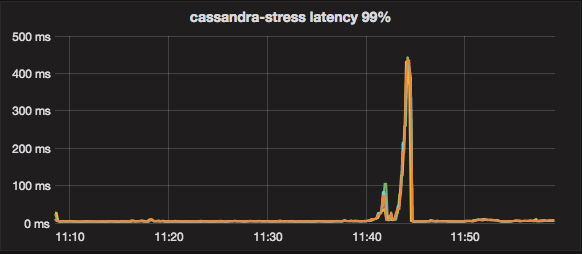
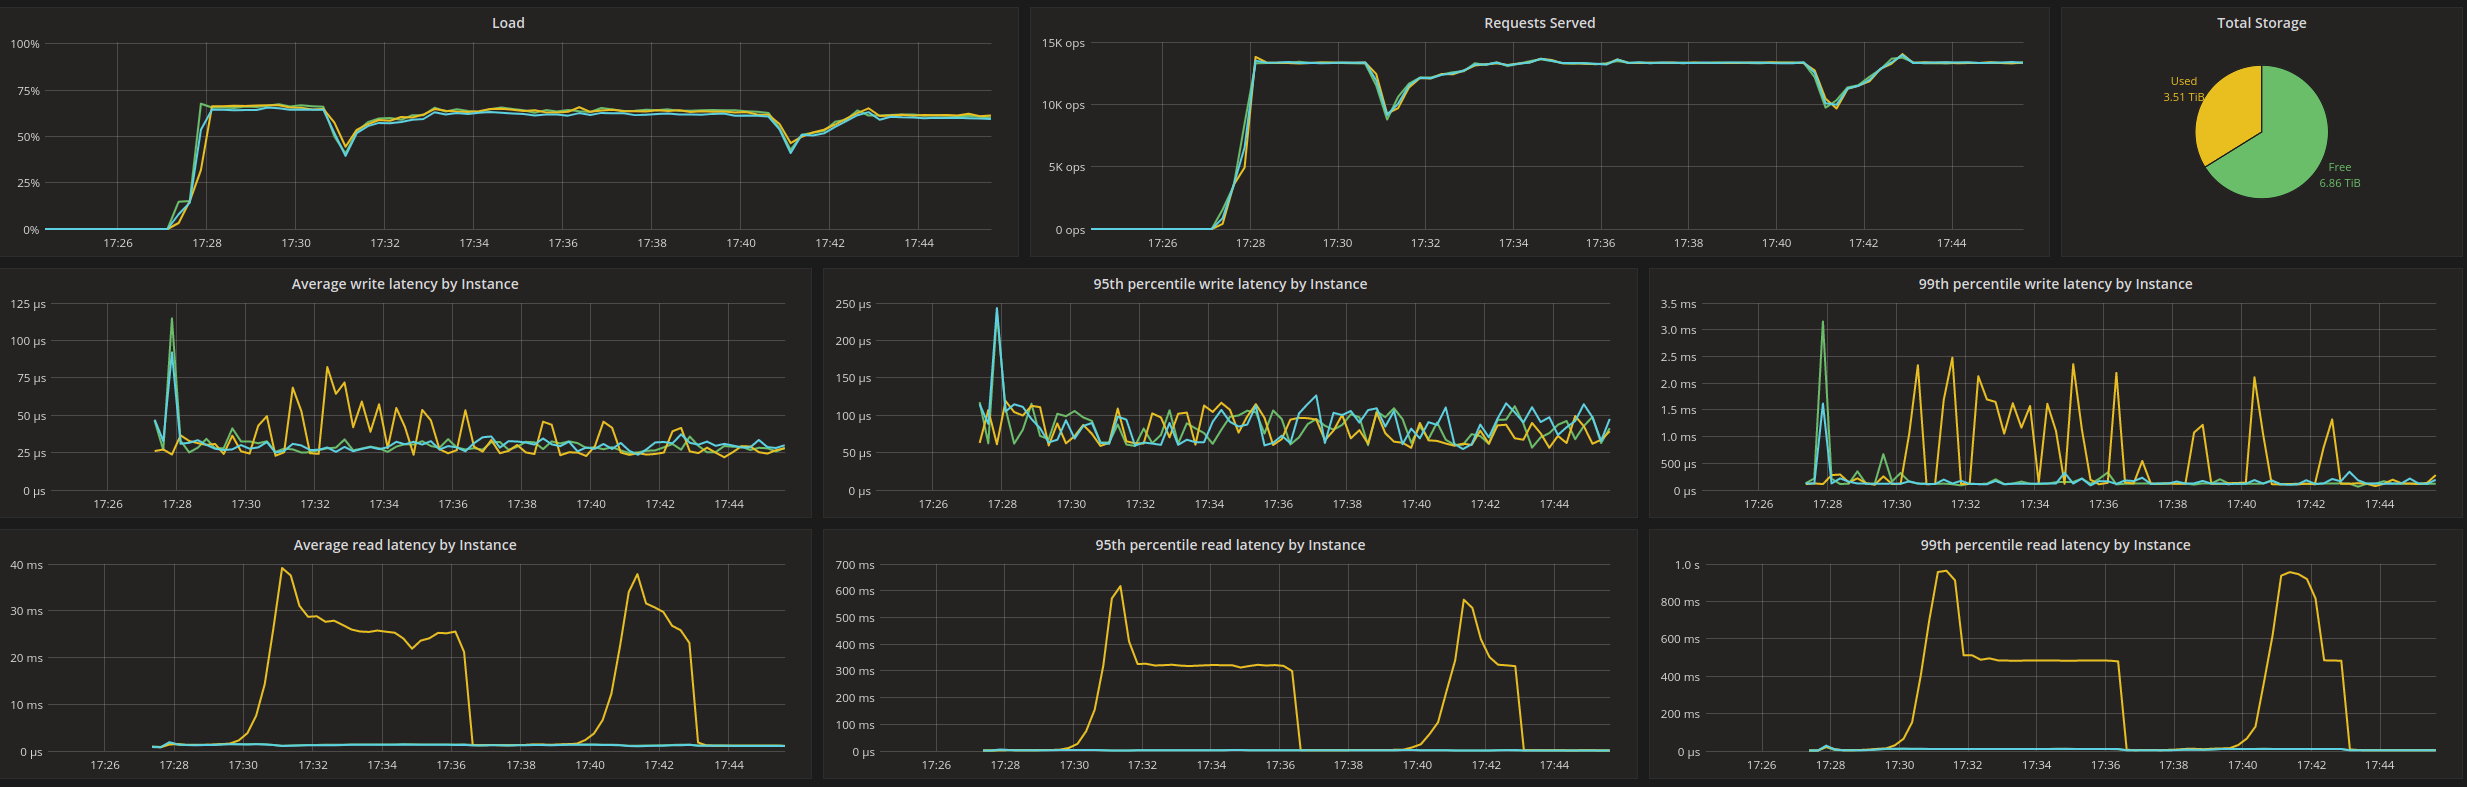
2.3.0 p99th latency looks abnormal and reaches peaks of ~400ms:

Test is populating 1TB of data and then start a c-s read command:
cassandra-stress read no-warmup cl=QUORUM duration=50m -schema 'replication(factor=3)' -port jmx=6868 -mode cql3 native -rate 'threads=100 limit=10000/s' -errors ignore -col 'size=FIXED(1024) n=FIXED(1)' -pop 'dist=gauss(1..1000000000,500000000,50000000)'
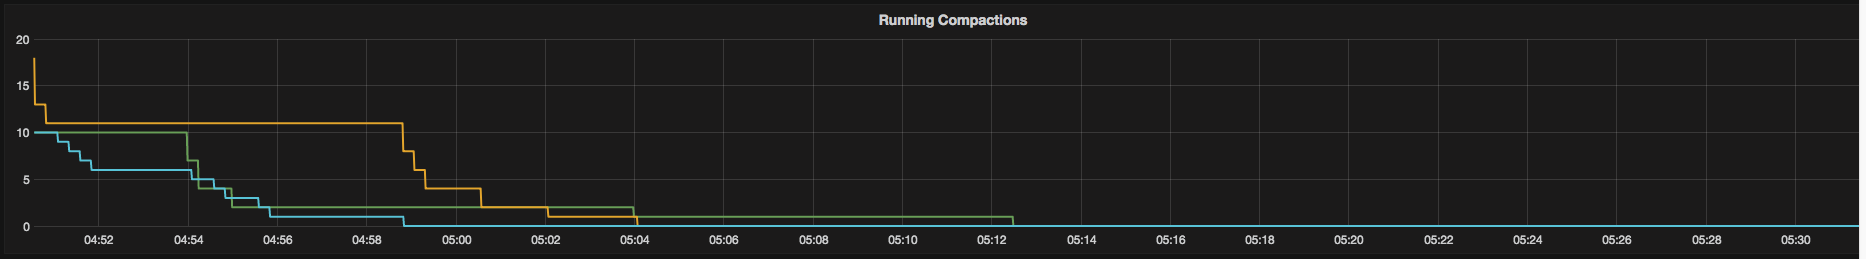
(During the first part of the test we can still see compactions that are leftovers of the write population)
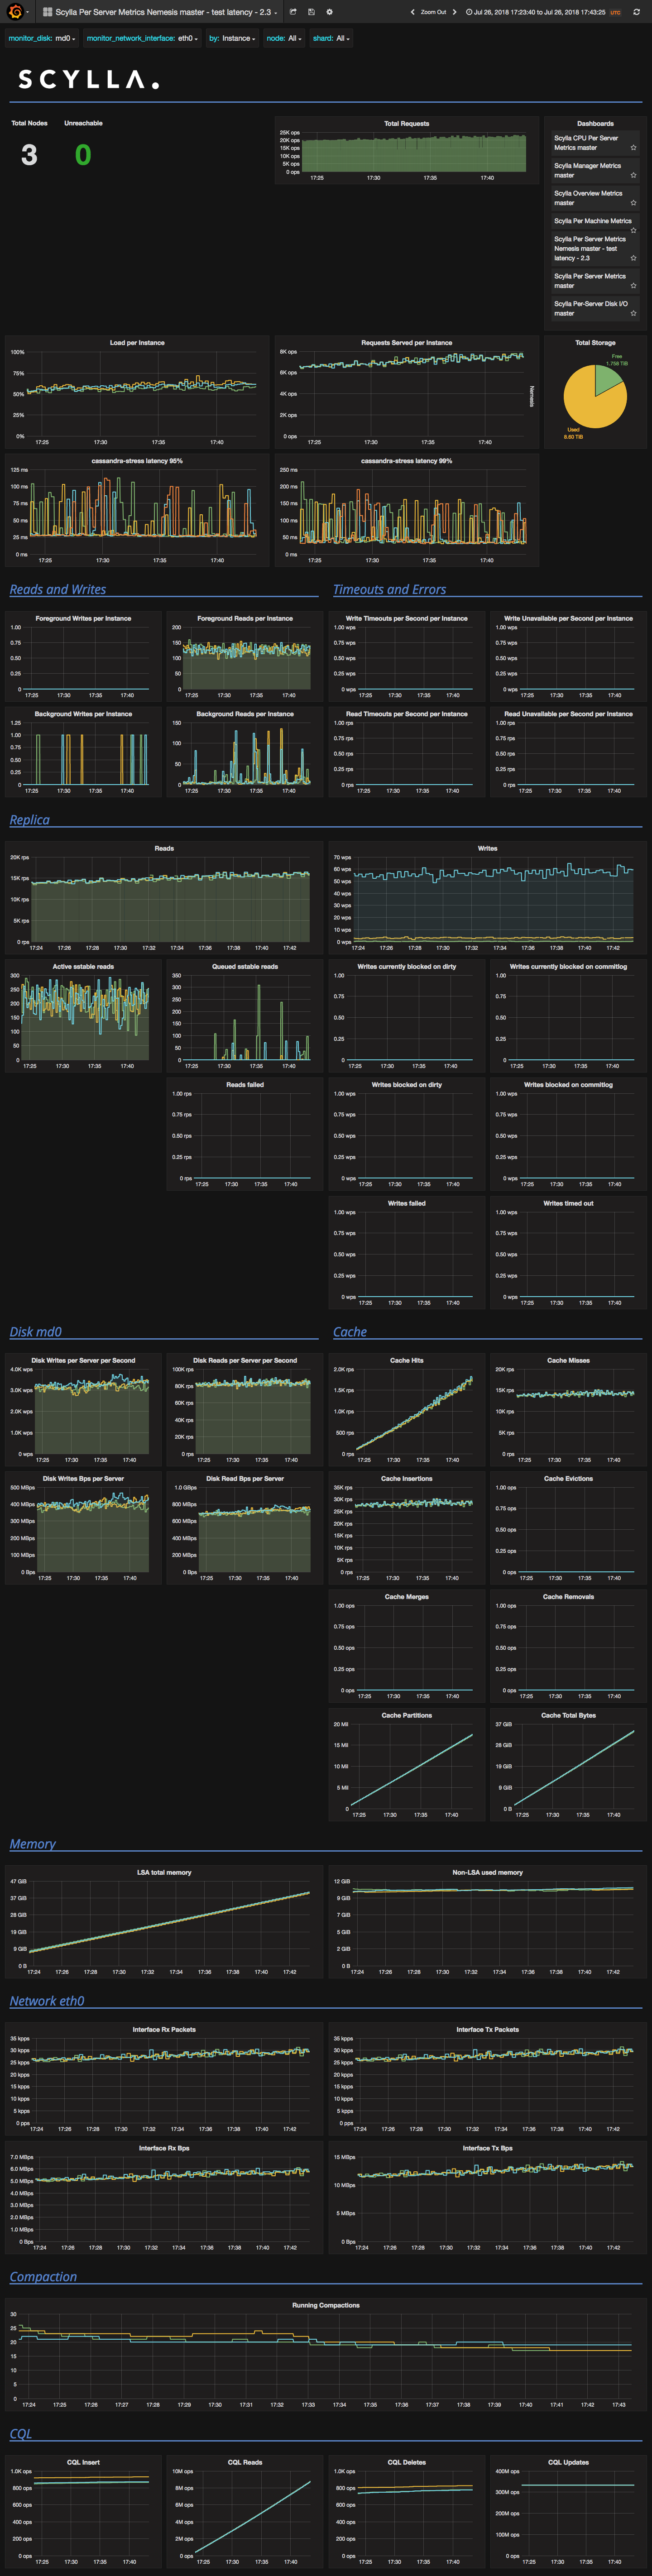
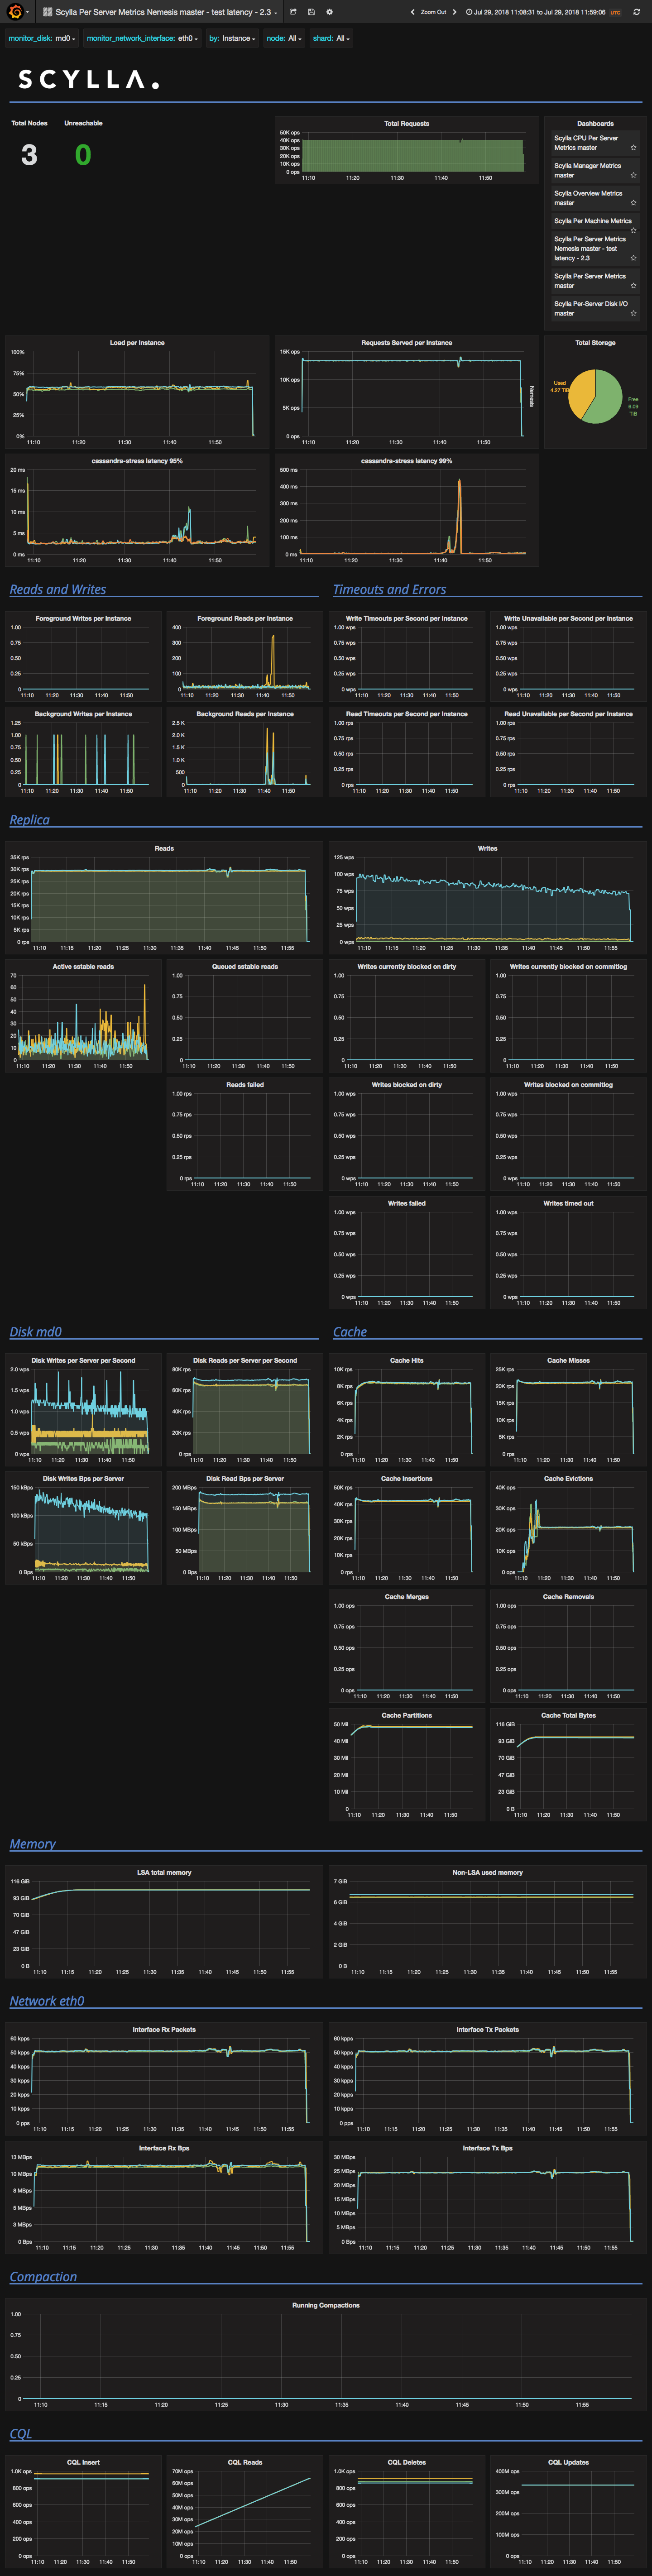
Full screenshot:

 roydahan
All 127 comments
FYI @slivne @tzach @glommer
roydahan
on 25 Jul 2018
Do you have a screenshot of metrics for 2.2 ?
 glommer
on 25 Jul 2018
glommer
on 25 Jul 2018
The workload is evolving during the test - starting from 5% hit rate and stabilizing at 30%. But the high latency happens during the high hit rate. So the suspect is LSA, since as the workload evolves the LRU becomes randomized and eviction becomes harder.
What do the logs say? Are there large allocation warnings?
 avikivity
on 25 Jul 2018
avikivity
on 25 Jul 2018
No warnings at all during the test (I'm uploading full log in case it's interesting).
roydahan
on 25 Jul 2018
roydahan
on 25 Jul 2018
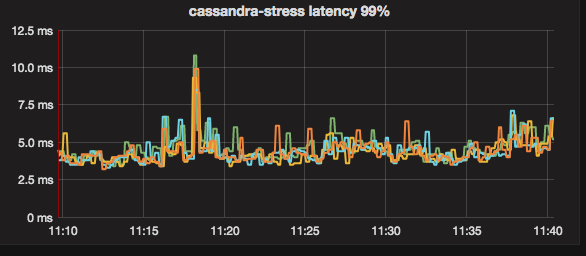
This is the screenshot of Grafana from 2.2.0 (live monitors in mail):
roydahan
on 25 Jul 2018
First thing that strikes me as odd is that there are constant writes in 2.3, while in 2.2 there are none.
Did we maybe missed so many keys in the population phase that we know have to read-repair them often ?
glommer
on 25 Jul 2018
In 2.3 we see that there are read-repairs while in 2.2 there aren't:
2.3:
2.2:
roydahan
on 25 Jul 2018
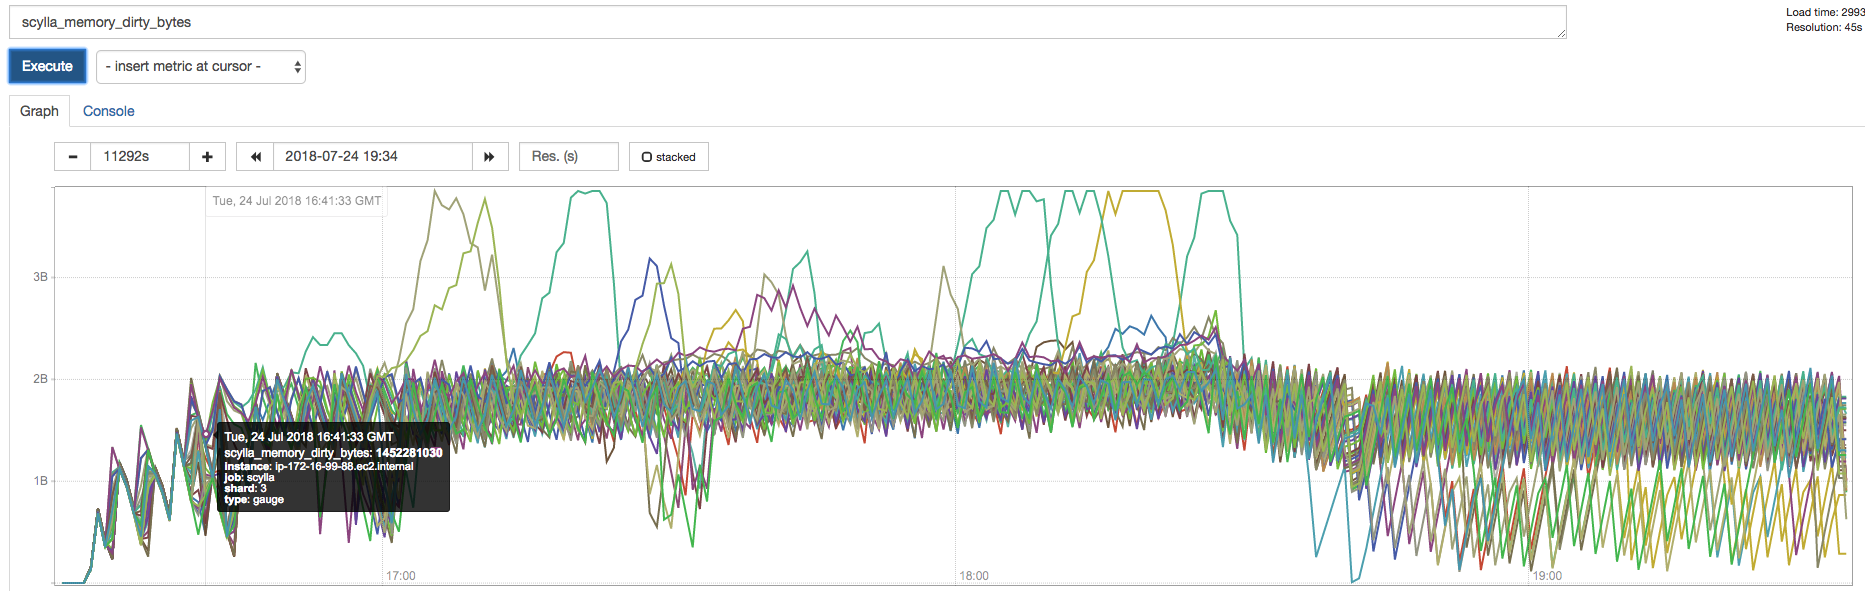
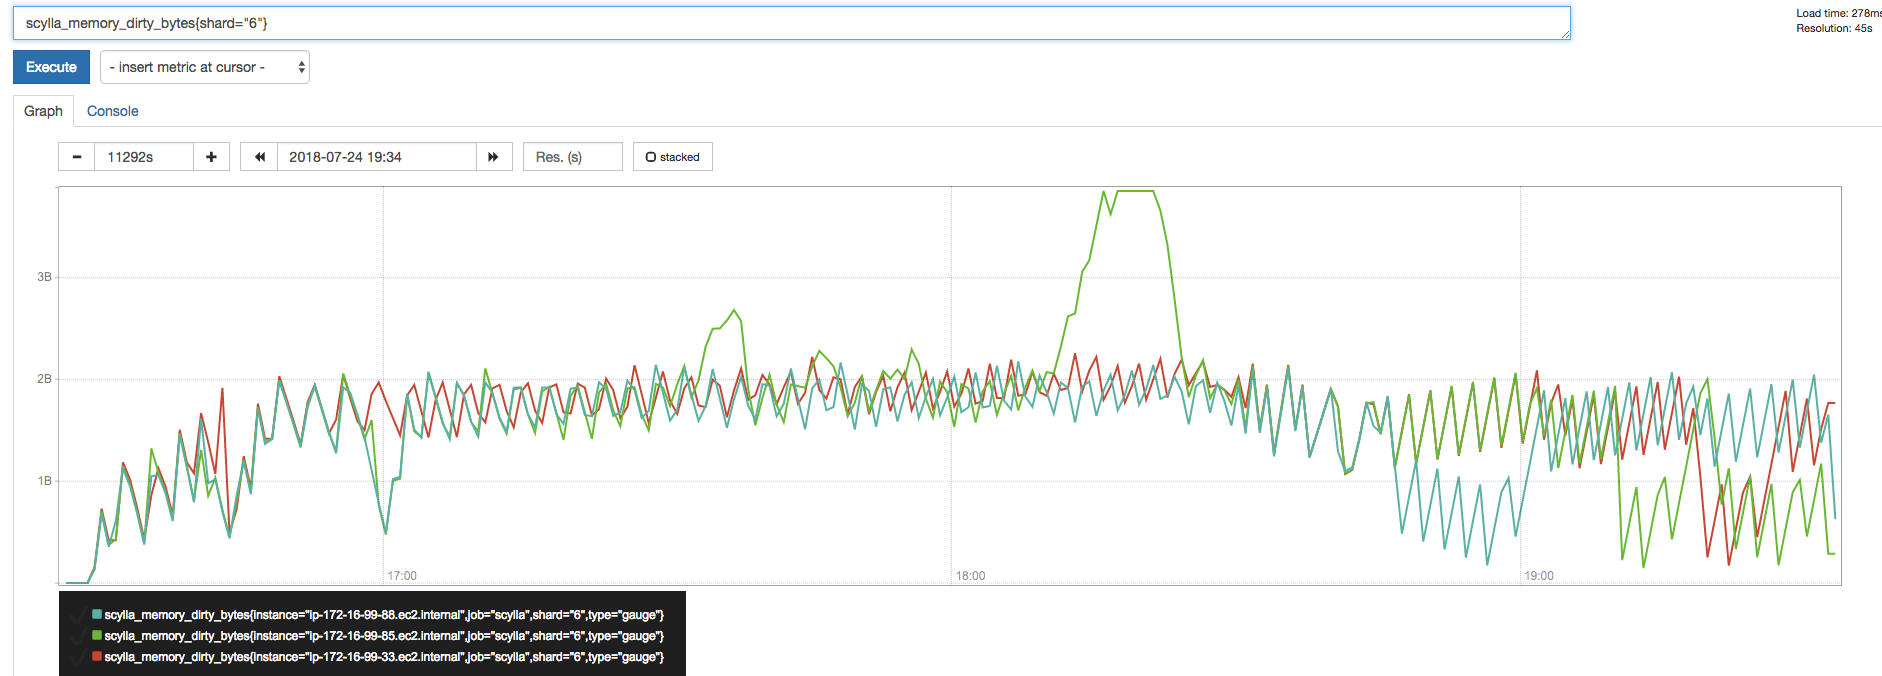
scylla_memory_dirty_bytes in 2.3 During population:
roydahan
on 25 Jul 2018
2.3 scylla_scheduler_shares during write:
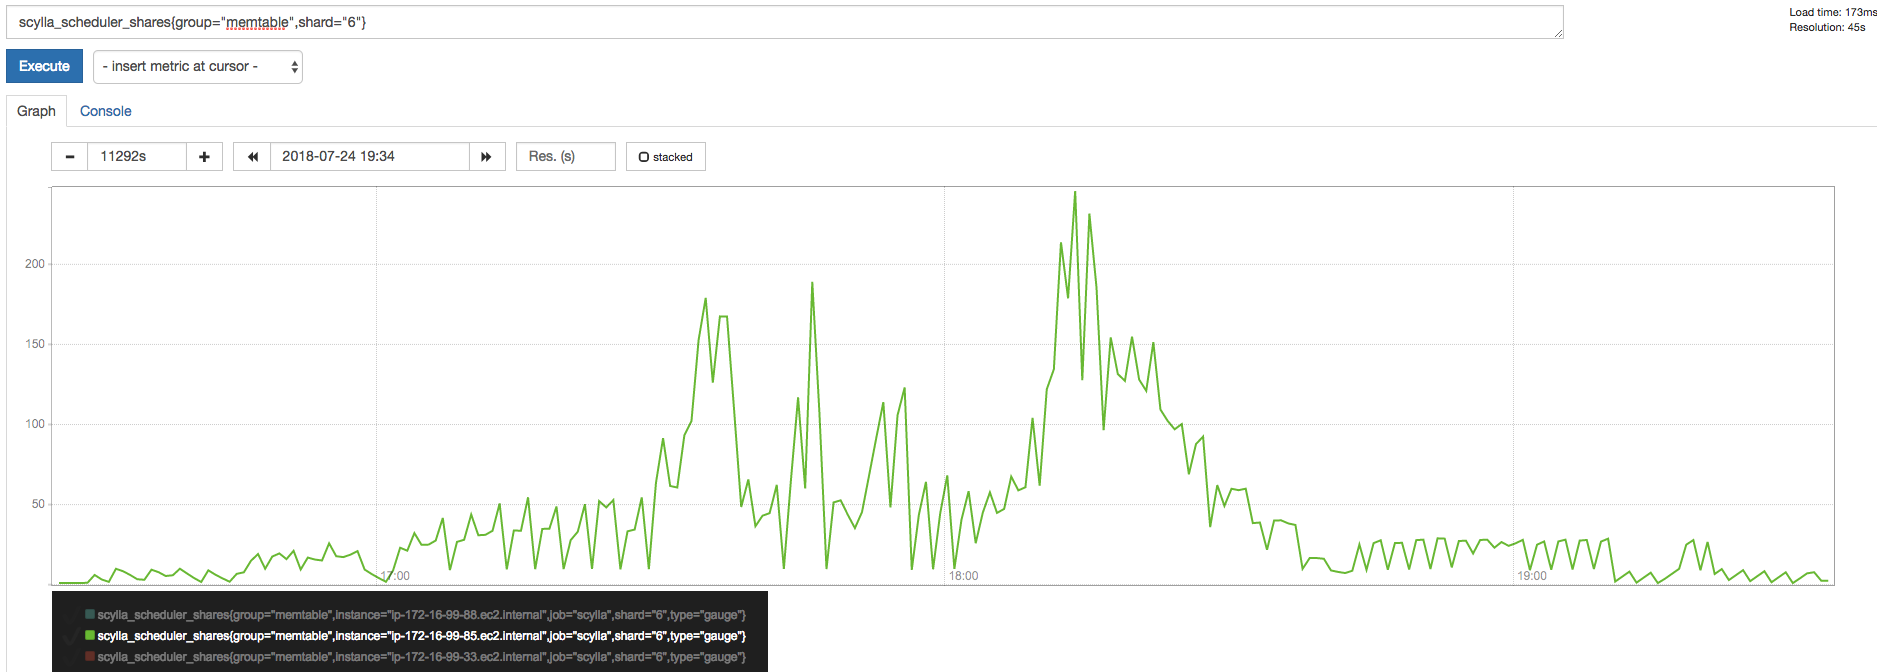
Correlated with the dirty bytes on that shard:
roydahan
on 25 Jul 2018
scylla_memory_dirty_bytes in 2.3 During population:
@glommer looks like we hit the wall. No idea why.
avikivity
on 25 Jul 2018
I/O queue delays during the population phase:
- Compaction: 60-90ms
- Commitlog: 2-5ms
- Memtable flush: 600-750ms
avikivity
on 25 Jul 2018
I/O queue bandwidth:
- Compaction: 1400 MB/s
- Commitlog: 150-170 MB/s
- Memtable flush: 130-150 MB/s
avikivity
on 25 Jul 2018
High delay in memtable flush is not directly bad (it is a batch job), but can delay the controller responsiveness.
avikivity
on 25 Jul 2018
in my experience, we can hit the wall if there are delays in the cache. If we don't update the cache fast enough, at some point we will hit the real dirty limit.
Have we checked for cache related stalls yet ?
glommer
on 25 Jul 2018
Nothing at 10ms.
avikivity
on 25 Jul 2018
@glommer if we hit the wall, shouldn't memtable shares hit 1000?
avikivity
on 25 Jul 2018
yes. And nothing really changed in this area since 2.2. And actually 2.0
for that matter.
That is the weird part. and what makes me suspect we are hitting the real
dirty because of cache updates.
I can check a bit more after the webinar
On Wed, Jul 25, 2018 at 12:32 PM, Avi Kivity notifications@github.com
wrote:
@glommer https://github.com/glommer if we hit the wall, shouldn't
memtable shares hit 1000?—
You are receiving this because you were mentioned.
Reply to this email directly, view it on GitHub
https://github.com/scylladb/scylla/issues/3628#issuecomment-407816547,
or mute the thread
https://github.com/notifications/unsubscribe-auth/AAUNvTqzz-dMCfEwi4ENVL_6-R6eYpuFks5uKJ2GgaJpZM4VfCGr
.
glommer
on 25 Jul 2018
We should have hit 1000 regardless of any stalls (if there were stalls, we might not have gone back down, but at least we should have ratcheted up the shares).
avikivity
on 25 Jul 2018
We wouldn't have hit 1000 if we didn't hit the actual limit. Have you
checked that we did?
It could always be that we flatted out because we hit the real dirty - and
not virtual dirty limit
On Wed, Jul 25, 2018 at 12:36 PM, Avi Kivity notifications@github.com
wrote:
We should have hit 1000 regardless of any stalls (if there were stalls, we
might not have gone back down, but at least we should have ratcheted up the
shares).—
You are receiving this because you were mentioned.
Reply to this email directly, view it on GitHub
https://github.com/scylladb/scylla/issues/3628#issuecomment-407817734,
or mute the thread
https://github.com/notifications/unsubscribe-auth/AAUNveZaZE3DLCT_lONugRoZyYzfCRsHks5uKJ5ygaJpZM4VfCGr
.
glommer
on 25 Jul 2018
I can check a bit more after the webinar
Livecode the debugging process
avikivity
on 25 Jul 2018
See real dirty in https://github.com/scylladb/scylla/issues/3628#issuecomment-407770028. Looks like it hit a ceiling (which we call the wall for some reason)
avikivity
on 25 Jul 2018
I saw that, but I don't know the limits.
I find it useful to add straight lines in grafana to show where the limits
are.
total_memory * 0.45 * 0.30 for the virtual dirty limit,
total_memory * 0.45 * 0.50 for the real dirty limit
then plot real and virtual dirty. This should be a default graph in
grafana, but we're lacking real estate there
On Wed, Jul 25, 2018 at 12:40 PM, Avi Kivity notifications@github.com
wrote:
See real dirty in #3628 (comment)
https://github.com/scylladb/scylla/issues/3628#issuecomment-407770028.
Looks like it hit a ceiling (which we call the wall for some reason)—
You are receiving this because you were mentioned.
Reply to this email directly, view it on GitHub
https://github.com/scylladb/scylla/issues/3628#issuecomment-407819157,
or mute the thread
https://github.com/notifications/unsubscribe-auth/AAUNveOZYdgy8jxrtYTMQpAUTk8wzphyks5uKJ-WgaJpZM4VfCGr
.
glommer
on 25 Jul 2018
Multiple shards hitting the same ceiling, it's bound to be the real limit.
avikivity
on 25 Jul 2018
(also it's at around 3.something GB, half of the 7 GB/shard i3 capacity)
avikivity
on 25 Jul 2018
but let's assume it is:
Is it the real dirty or virtual dirty?
If it is the real dirty, that is not controlled at all (you will remember
we discussed a couple of times that we maybe should), and the only relevant
actor there is the cache. The memtable controller has nothing to do with it.
So if it is the real dirty limit, maybe the cache update is now slower for
some reason, or it is just the fact that they are not controlled.
On Wed, Jul 25, 2018 at 12:46 PM, Avi Kivity notifications@github.com
wrote:
Multiple shards hitting the same ceiling, it's bound to be the real limit.
—
You are receiving this because you were mentioned.
Reply to this email directly, view it on GitHub
https://github.com/scylladb/scylla/issues/3628#issuecomment-407820693,
or mute the thread
https://github.com/notifications/unsubscribe-auth/AAUNvQ-A1uHgKRYFWmnsNJb8qIlFq_6qks5uKKDWgaJpZM4VfCGr
.
glommer
on 25 Jul 2018
Is it the real dirty or virtual dirty?
real, see graph
Its group is at 200. We can try to raise it (it will cause its own problems)
avikivity
on 25 Jul 2018
We should try to understand first why it couldn't update the cache fast
enough. It's the same limit in 2.2 and 2.3
But 200 is likely not enough in some situations.
We have been calling this "20%" but in reality if we have compactions,
main, statements and memtable with 1000 each, we have 4200 shares active at
the same time
3200 is way less than 20 % (the pre-scheduler limit).
Actually, this could be the reason: in 2.3 we moved some more codepaths out
of main to statement. So before we would have effectivelly 3200 shares
total, now 4200.
On Wed, Jul 25, 2018 at 12:54 PM, Avi Kivity notifications@github.com
wrote:
Is it the real dirty or virtual dirty?
real, see graph
Its group is at 200. We can try to raise it (it will cause its own
problems)—
You are receiving this because you were mentioned.
Reply to this email directly, view it on GitHub
https://github.com/scylladb/scylla/issues/3628#issuecomment-407823125,
or mute the thread
https://github.com/notifications/unsubscribe-auth/AAUNvYLZE9s8ilvAZyXil9OgU6aMY-a_ks5uKKLGgaJpZM4VfCGr
.
glommer
on 25 Jul 2018
Only main and statement have 1000 in practice. But yes, as long as we don't move everything out of main (which should only have glue), we halved everyone else.
avikivity
on 25 Jul 2018
well, yes - I was assuming the worst case for compactions and memtables because I don't know the real shares. But the argument still stands. Cache updates are now made slower as we introduced more things into the statement group, and because they are not controlled, they cannot react.
glommer
on 25 Jul 2018
I'll prepare packages with 400 to test.
avikivity
on 25 Jul 2018
avikivity
on 25 Jul 2018
Running with the new RPMs did not solve the issue, latencies are still high when running right after population:
Full metric screenshot:
roydahan
on 29 Jul 2018
When running the same workload again and not right after the population workload, the latency looks much better (as it was in 2.2) for most of the workload.
However, at some point there is a huge spike in latency.
The good latency part:
Including the spike:
From the writes during the load, it seems like there are read repairs during the entire workload:
roydahan
on 29 Jul 2018
Interesting graphs
Notes:
- shard 5 hits the dirty ceiling in the first graph
- shard 5 has writes blocked on dirty (second graph)
- shard 5 has no extraordinary CPU usage for memtable_to_cache, but it consistently eats more CPU there
avikivity
on 30 Jul 2018
When testing with CL=ALL during population, to eliminate the "read repair" issue, we can see that latency is still higher than 2.2.0 by 550%:
Version | Op rate total | Latency mean | Latency 99th percentile
-- | -- | -- | --
2.2.0 | 39997.0 [2018-07-19 10:26:37] | 1.4 [2018-07-19 10:26:37] | 3.1 [2018-07-19 10:26:37]
2.3.0 | 38224.0 (4% Regression) | 5.5 (292% Regression) | 20.2 (551% Regression)
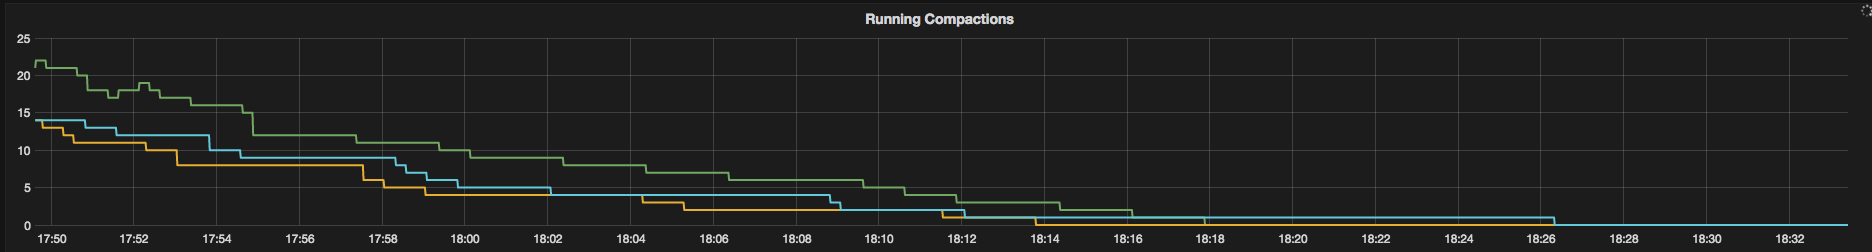
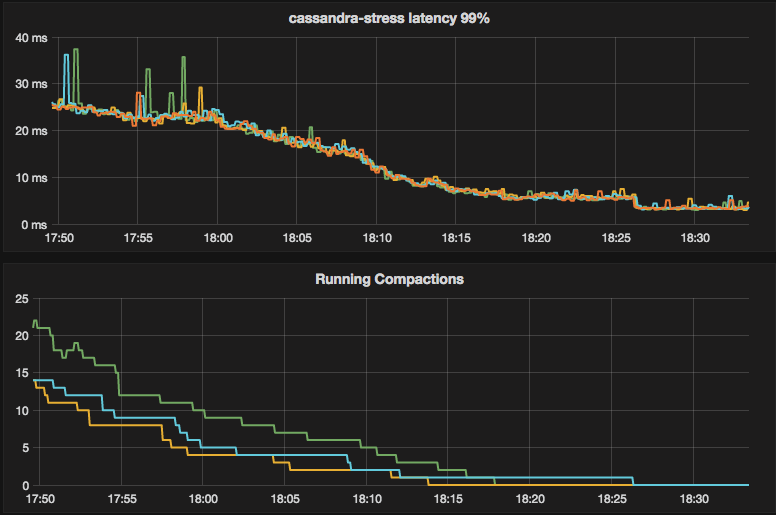
Looking at the latency graph we can see it correlates with compactions (leftovers of previous write load).
in 2.2 test most the compactions leftovers ended ~15 mins into the test and tail last ~22 mins.
In 2.3 test most compactions leftovers ended ~25mins into the test and tail last ~35 mins.
2.3:
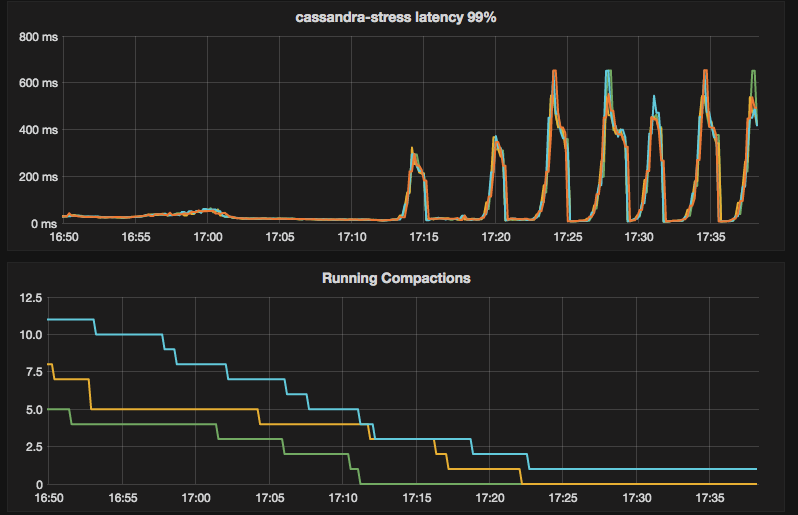
2.2:
latency vs compactions (2.3):
roydahan
on 30 Jul 2018
Avi, in my view, this is the same logic: as we started using the statement
group, every other shares got diluted.
this is not necessarily a bad thing in real life. We can move things back
to main just to make sure I am right. At which point we can decide what to
do about it.
On Mon, Jul 30, 2018, 12:49 PM Roy Dahan, notifications@github.com wrote:
When testing with CL=ALL during population, to eliminate the "read repair"
issue, we can see that latency is still higher than 2.2.0 by 550%:
Version Op rate total Latency mean Latency 99th percentile
2.2.0 39997.0 [2018-07-19 10:26:37] 1.4 [2018-07-19 10:26:37] 3.1 [2018-07-19
10:26:37]
2.3.0 38224.0 (4% Regression) 5.5 (292% Regression) 20.2 (551% Regression)Looking at the latency graph we can see it correlates with compactions
(leftovers of previous write load).
in 2.2 test most the compactions leftovers ended ~15 mins into the test
and tail last ~22 mins.
In 2.3 test most compactions leftovers ended ~25mins into the test and
tail last ~35 mins.2.3:
[image: screen shot 2018-07-30 at 19 45 16]
https://user-images.githubusercontent.com/20959584/43410905-30f41340-9431-11e8-91db-ef61d0cf2539.png2.2:
[image: screen shot 2018-07-30 at 19 45 38]
https://user-images.githubusercontent.com/20959584/43410919-3ee40ea6-9431-11e8-9bcd-62827facffb7.pnglatency vs compactions (2.3):
[image: screen shot 2018-07-30 at 19 48 07]
https://user-images.githubusercontent.com/20959584/43411004-898a03d4-9431-11e8-98ab-9961ba1fbc2b.png—
You are receiving this because you were assigned.
Reply to this email directly, view it on GitHub
https://github.com/scylladb/scylla/issues/3628#issuecomment-408932418,
or mute the thread
https://github.com/notifications/unsubscribe-auth/AAUNvTghmJGcZaN3-wAtYXS8_YSH4y43ks5uLzkRgaJpZM4VfCGr
.
glommer
on 30 Jul 2018
@glommer read @roydahan's comment above yours
avikivity
on 30 Jul 2018
I read, and as a matter of fact I was repluing to them:
Looking at the latency graph we can see it correlates with compactions (leftovers of previous write load).
in 2.2 test most the compactions leftovers ended ~15 mins into the test and tail last ~22 mins.
In 2.3 test most compactions leftovers ended ~25mins into the test and tail last ~35 mins.
Compactions would indeed take longer if they hit 1000 shares in the population phase. It used to be the case that those 1000 shares were competing against 1000 shares for main, but now they are competing against 1000 main + 1000 statements.
glommer
on 30 Jul 2018
That part is fine. We don't guarantee that the compaction throughput will remain exactly the same.
What worries me is the read repairs due to hitting the wall, and hitting the wall in the first place.
@roydahan can you adjust the test to wait until compactions complete after the population phase?
avikivity
on 30 Jul 2018
I think that while it looks that the major regression is in latency, the
main issue is throughput (probably because of too busy or
to idle shard). It's because the 2.3 couldn't even satisfy the whole
throughput of the test which ain't supposed to be cpu bound
On Mon, Jul 30, 2018 at 8:28 PM, Glauber Costa notifications@github.com
wrote:
I read, and as a matter of fact I was repluing to them:
Looking at the latency graph we can see it correlates with compactions (leftovers of previous write load).
in 2.2 test most the compactions leftovers ended ~15 mins into the test and tail last ~22 mins.
In 2.3 test most compactions leftovers ended ~25mins into the test and tail last ~35 mins.Compactions would indeed take longer if they hit 1000 shares in the
population phase. It used to be the case that those 1000 shares were
competing against 1000 shares for main, but now they are competing against
1000 main + 1000 statements.—
You are receiving this because you are subscribed to this thread.
Reply to this email directly, view it on GitHub
https://github.com/scylladb/scylla/issues/3628#issuecomment-408944508,
or mute the thread
https://github.com/notifications/unsubscribe-auth/ABp6RTx3w014e6vlmABpVTByuIqxoYa1ks5uL0IugaJpZM4VfCGr
.
 dorlaor
on 30 Jul 2018
dorlaor
on 30 Jul 2018
As far as I can tell the latency is due to read repair, which is itself due to memtable flush throughput being too low.
avikivity
on 30 Jul 2018
@avikivity you might remember that I have tried in the past to have memtable flush going way over 1000. And the reason for that is that as we approach the limit and hit the wall, the cost per request becomes much higher and we may trash to the point of timing out.
I still think it would be worth it to retest the population phase moving everything that is in statements back to main, to see what happens.
glommer
on 30 Jul 2018
(I thought that was for compaction, not memtable flush)
If the cost per request increases, then memtable flush has an easier job in comparison. It would need even fewer shares to compete with statement/main!
Moreover, we don't see memtable shares hitting 1000, even for the bad shard they oscillate between 200 and 400. So letting them go above 1000 wouldn't help.
avikivity
on 30 Jul 2018
Added steal time to the graph. The bad shard has the highest steal time.
avikivity
on 30 Jul 2018
There is something strange in the graph you linked. memtable_to_cache is at 200. Wasn't the whole point of your RPM to kick it up to 400? I see the streaming class at 400, so maybe we just made a mistake there
glommer
on 30 Jul 2018
Good catch! Will try again.
avikivity
on 30 Jul 2018
Perhaps we have a group leak, where once we hit the wall, mutation applies run in the memtable group instead of the statement group. This is because it is the memtable group that frees the memory.
You sent a broken patch once to force the scheduling group, perhaps we should revisit it (with a more humble goal of just running everything in the statement group).
avikivity
on 30 Jul 2018
Let's verify if this is indeed the issue before we discuss further.
On Mon, Jul 30, 2018 at 2:17 PM, Avi Kivity notifications@github.com
wrote:
Perhaps we have a group leak, where once we hit the wall, mutation applies
run in the memtable group instead of the statement group. This is because
it is the memtable group that frees the memory.You sent a broken patch once to force the scheduling group, perhaps we
should revisit it (with a more humble goal of just running everything in
the statement group).—
You are receiving this because you were mentioned.
Reply to this email directly, view it on GitHub
https://github.com/scylladb/scylla/issues/3628#issuecomment-408960331,
or mute the thread
https://github.com/notifications/unsubscribe-auth/AAUNvaRxCFc7kh2dDY0dRgQXA8VWCf9Aks5uL023gaJpZM4VfCGr
.
glommer
on 30 Jul 2018
Actually, it will run in whatever group start_releaser() is called in, so likely the main group.
avikivity
on 30 Jul 2018
Maybe we need
-    dirty_memory_manager(database& db, size_t threshold, double soft_limit)
+    dirty_memory_manager(database& db, size_t threshold, double soft_limit, scheduling_group sg)
@roydahan new rpm correctly increasing memtable_to_cache shares to 400: http://scratch.scylladb.com/avi/scylla-2.3.rc1-2.avi.tar
avikivity
on 31 Jul 2018
New run with the new RPMs available here (test has just started, this is first 10 mins).
roydahan
on 31 Jul 2018
@avikivity, population phase looks better and during the read workload I don't see any writes, so I assume there aren't read repairs.
However, even after 1.5 hours since the population had finished compactions have't settle down, so I assume they continue as long as scylla doesn't have something else to do.
Bottom line, the read latency hasn't improved.
p99th varying between 15-20ms for about 25 mins and then I see peaks of 400-600ms.
There isn't anything in the log except compactions.
roydahan
on 31 Jul 2018
See for example shard 7 here. Huge downward spikes coordinated across the cluster with no visible cause.
avikivity
on 31 Jul 2018
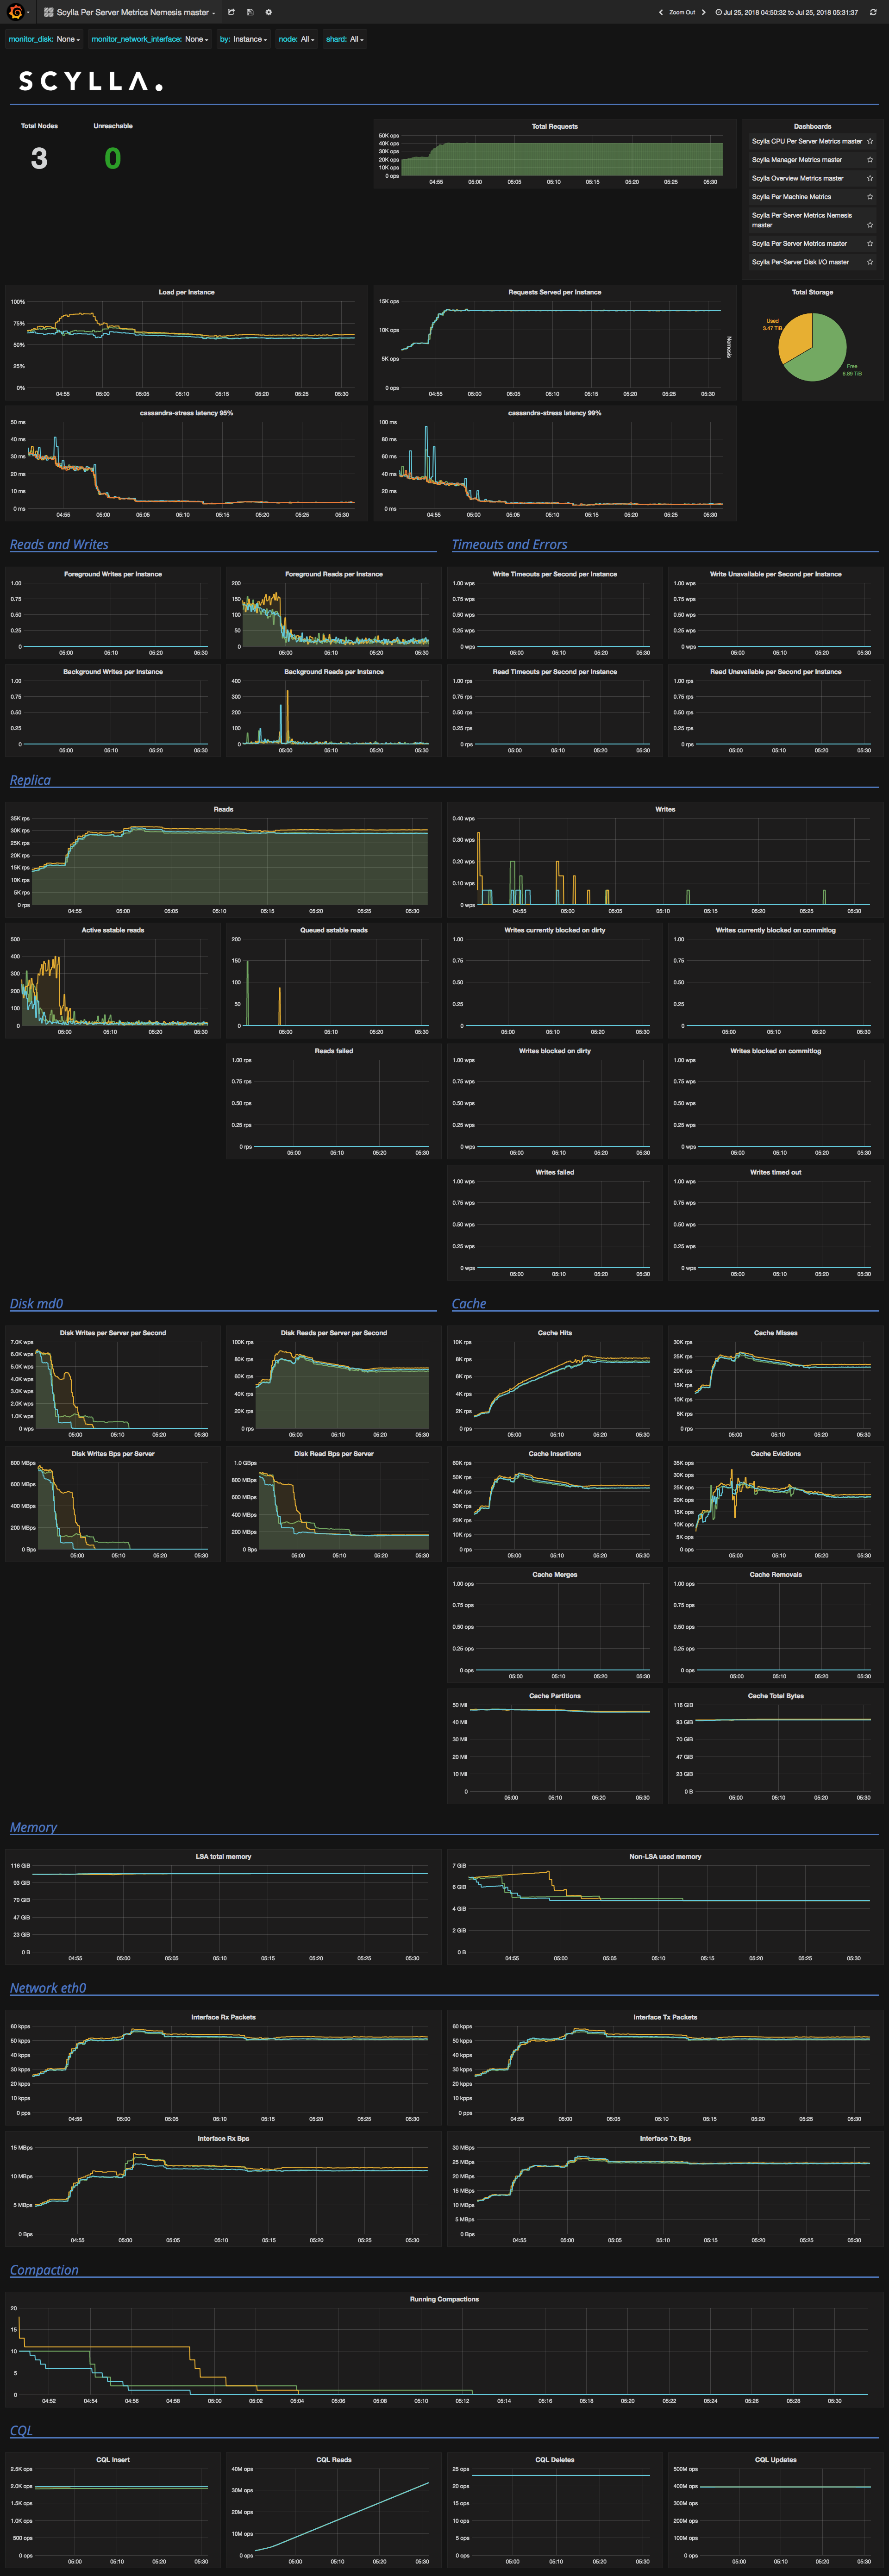
@gleb-cloudius @pdziepak live Grafana / Prometheus for correct time range (modulo time zone problems). Notice coordinator foreground reads increasing on one node.
avikivity
on 1 Aug 2018
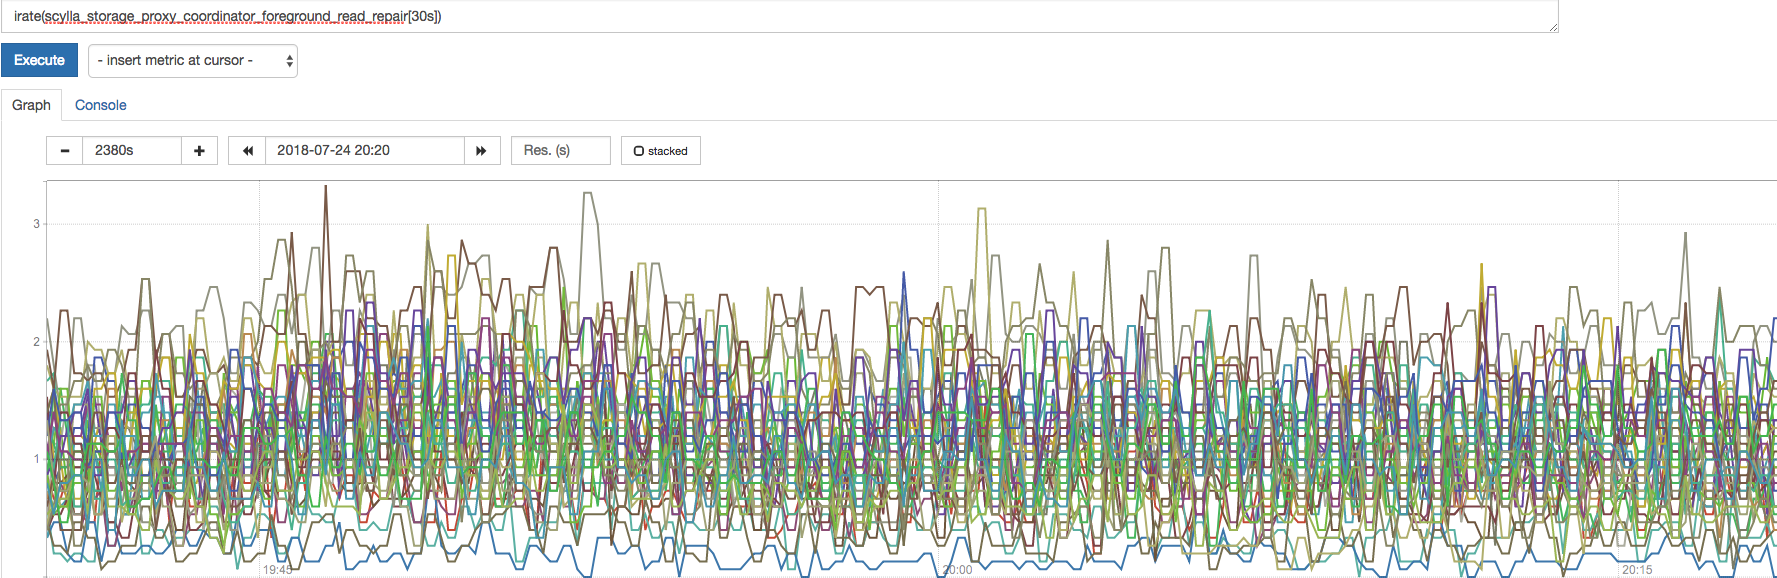
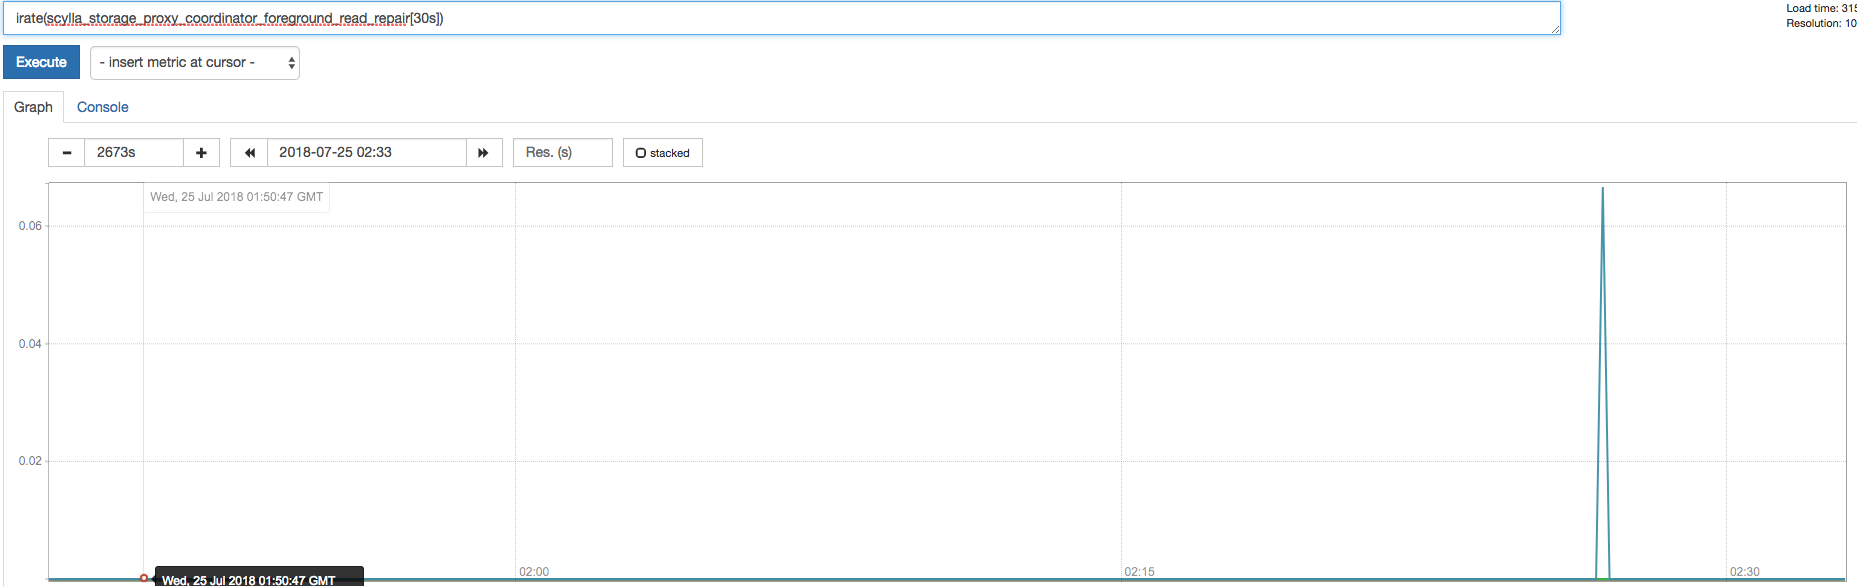
Here is the graph of scylla_execution_stages_function_calls_enqueued-scylla_execution_stages_function_calls_executed.
It has peaks that seams to correlate with foreground read peaks in
data_query execution stage.
http://34.207.233.155:9090/graph#%5B%7B%22range_input%22%3A%221h%22%2C%22end_input%22%3A%222018-07-31%2014%3A50%22%2C%22step_input%22%3A%22%22%2C%22stacked%22%3A%22%22%2C%22expr%22%3A%22scylla_execution_stages_function_calls_enqueued-scylla_execution_stages_function_calls_executed%22%2C%22tab%22%3A0%7D%5D
--
Gleb.
 gleb-cloudius
on 1 Aug 2018
gleb-cloudius
on 1 Aug 2018
@gleb-cloudius / @pdziepak update ?
 slivne
on 6 Aug 2018
slivne
on 6 Aug 2018
@gleb-cloudius @avikivity @pdziepak any update on this issue?
 tzach
on 12 Aug 2018
tzach
on 12 Aug 2018
Let me summarize the issues identified, and correct me if I missed something:
1) On 2.3, memtable_to_cache gets less effective share of CPU, which results in cache update lagging behind, blocking writes on real dirty, writes timing out, forcing later reads to reconciliate, and thus higher read latency. Avi's RPM with shares adjusted seems to "fix" the problem.
This may be also related to https://github.com/scylladb/scylla/issues/3260.
2) On 2.3 we see spikes of read latency reaching ~600ms
@roydahan Wrote:
However, even after 1.5 hours since the population had finished compactions have't settle down, so I > assume they continue as long as scylla doesn't have something else to do.
Bottom line, the read latency hasn't improved.
p99th varying between 15-20ms for about 25 mins and then I see peaks of 400-600ms.
The statement that latency hasn't improved is based on the fact that latency is higher when compaction is running, but so it is on 2.2, when compaction is running. When compaction is not running, we have those spikes of 400-600 ms, and that is the problem (2) mentioned above. That seems to be independent of the problem (1).
 tgrabiec
on 14 Aug 2018
tgrabiec
on 14 Aug 2018
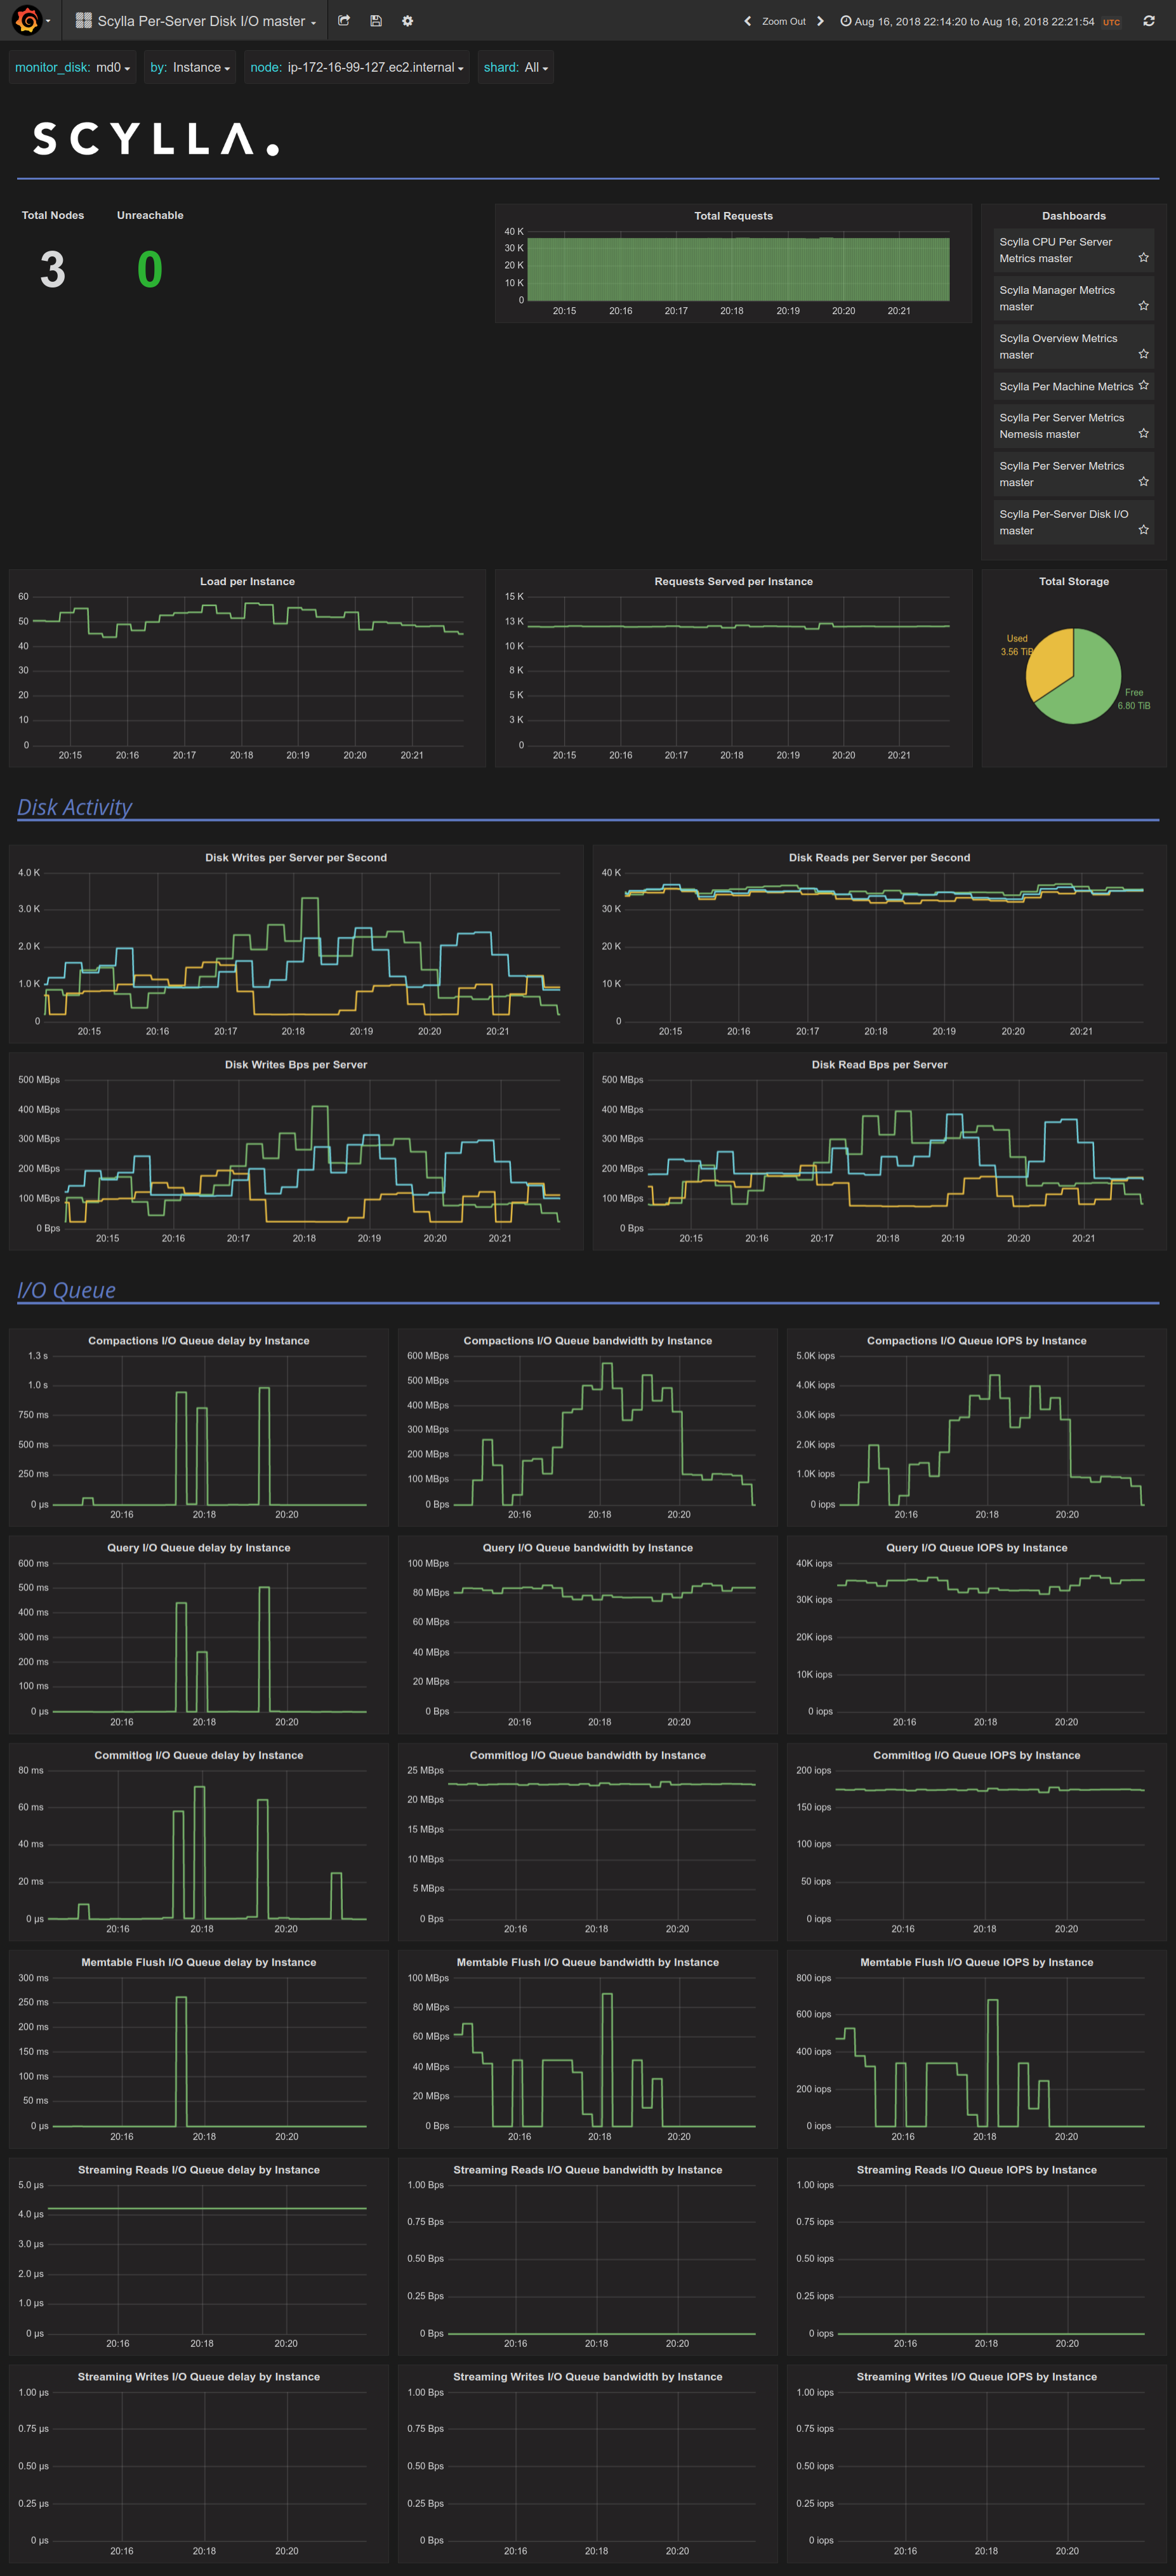
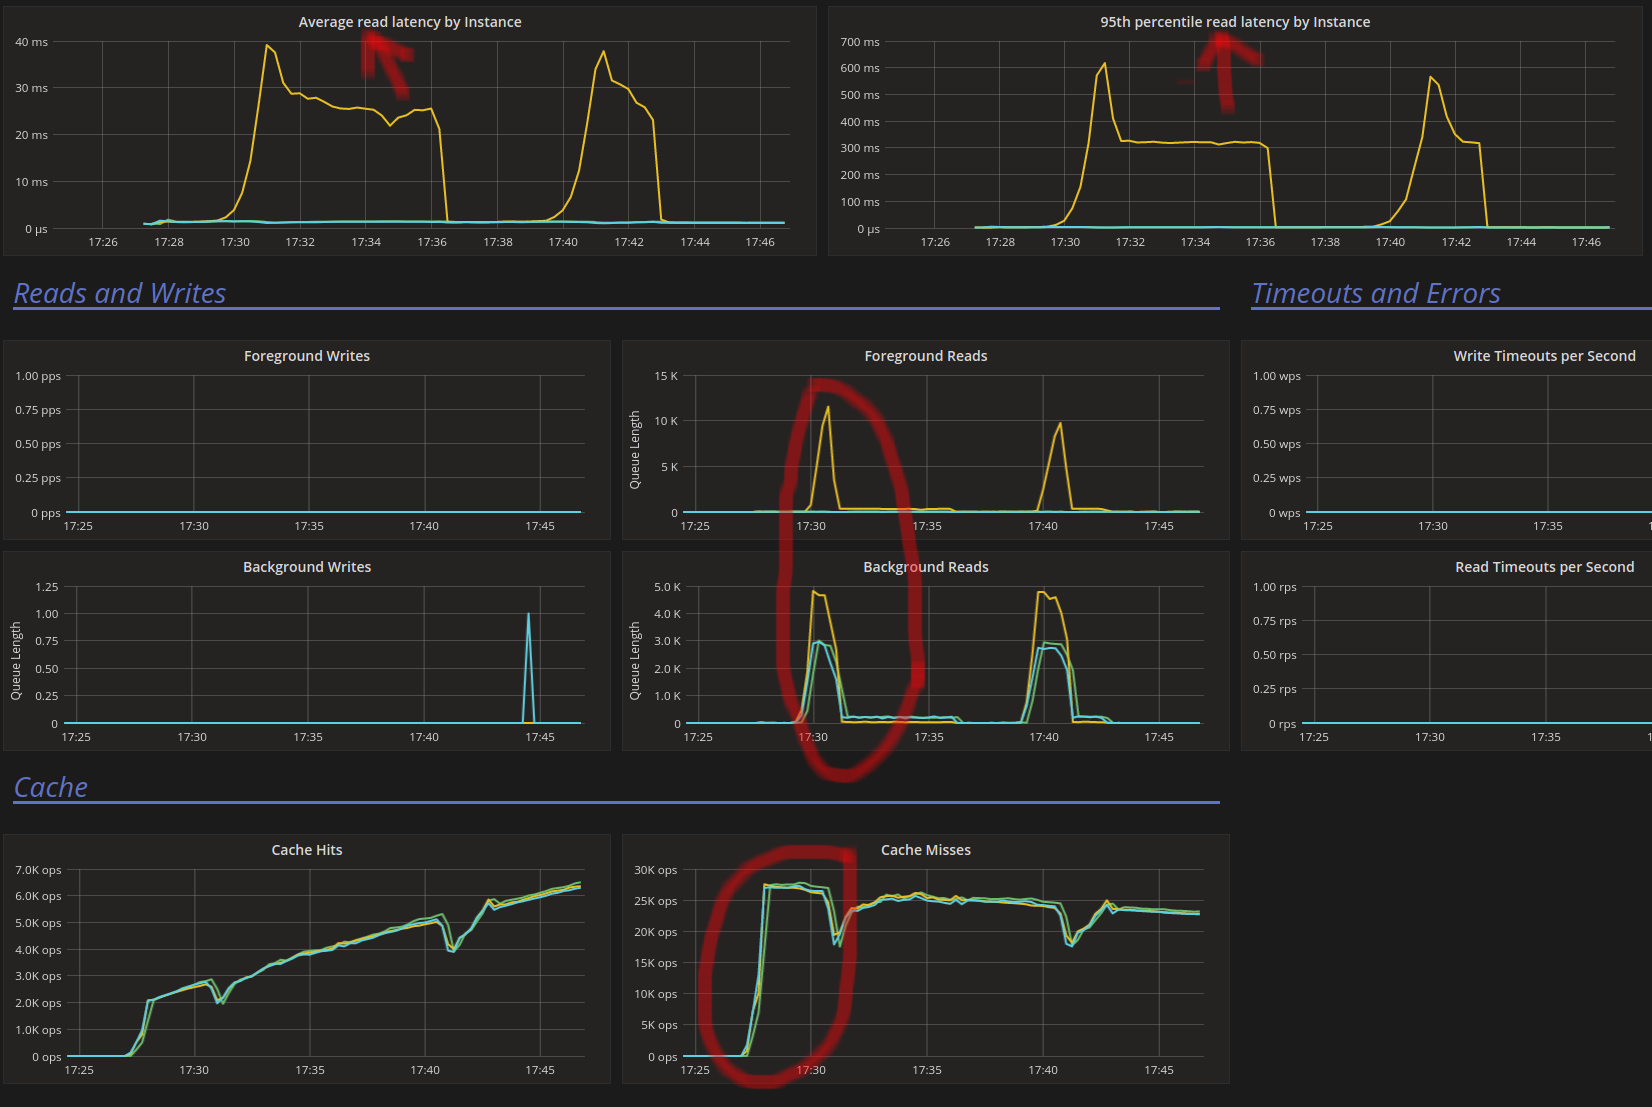
Roy reproduced latency spikes in a mixed workload.
c-s clients experience latency of up to 200ms for 99%, where usually they're below 20ms.
That correlates somewhat with 3 spikes of "foreground reads per instance" on node A.
They correlate with spikes of "Background Reads"
They correlate with spikes in active sstable reads on that node (840, 560, 490 reads respectively).
There is no loss of throughput on that replica. The amount of cache misses seems steady at about 10K row/s, hits at 3.5 k row/s.
The spikes correlate with "Running Compactions" reaching 4 on that node.
The spikes in sstable read queue correlate with I/O Queue delay spikes for "Compactions" (up to 1s), "Query" (up to 500ms) and Commitlog (up to 70ms).
No reactor stalls at that time (8ms threshold)
Average duration between polls doesn't exceed 0.5ms.
Query bandwidth is steady at 80 MBps / 35k IOPS.
Commitlog bandwidth is steady at 22 MBps / 175 IOPS.
Compaction bandwidth fluctuates. When spikes happen, it rises from 380 MBps to 480 MBps, then to 571 MBps.
The shape of Compactions I/O queue bandwidth / IOPS correlates well with the shape of 99% latency of c-s.
I suspect an I/O scheduling issue.
$ cat /etc/scylla.d/io_properties.yaml
disks:
- mountpoint: /var/lib/scylla
  read_bandwidth: 4030685470
  read_iops: 822400
  write_bandwidth: 1617551304
  write_iops: 363000
tgrabiec
on 17 Aug 2018
On Fri, Aug 17, 2018, 10:50 AM Tomasz Grabiec, notifications@github.com
wrote:
Roy reproduced latency spikes in a mixed workload.
c-s clients experience latency of up to 200ms for 99%, where usually
they're below 20ms.That correlates somewhat with 3 spikes of "foreground reads per instance"
on node A.
They correlate with spikes of "Background Reads"They correlate with spikes in active sstable reads on that node (840, 560,
490 reads respectively).There is no loss of throughput on that replica. The amount of cache misses
seems steady at about 10K row/s, hits at 3.5 k row/s.The spikes correlate with "Running Compactions" reaching 4 on that node.
The spikes in sstable read queue correlate with I/O Queue delay spikes for
"Compactions" (up to 1s), "Query" (up to 500ms) and Commitlog (up to 70ms).No reactor stalls at that time.
At which threshold ? Our default threshold for spike reoporting is 2s. So
if we stall for less than that we would not catch it. Since you see delays
in all classes, it is quite possible that this is stall related
Average duration between polls doesn't exceed 0.5ms.
Query bandwidth is steady at 80 MBps / 35k IOPS.
Commitlog bandwidth is steady at 22 MBps / 175 IOPS.
Compaction bandwidth fluctuates. When spikes happen, it rises from 380
MBps to 480 MBps, then to 571 MBps.The shape of Compactions I/O queue bandwidth / IOPS correlates well with
the shape of 99% latency of c-s.I suspect an I/O scheduling issue.
$ cat /etc/scylla.d/io_properties.yaml
disks:
- mountpoint: /var/lib/scylla
read_bandwidth: 4030685470
read_iops: 822400
write_bandwidth: 1617551304
write_iops: 363000[image:
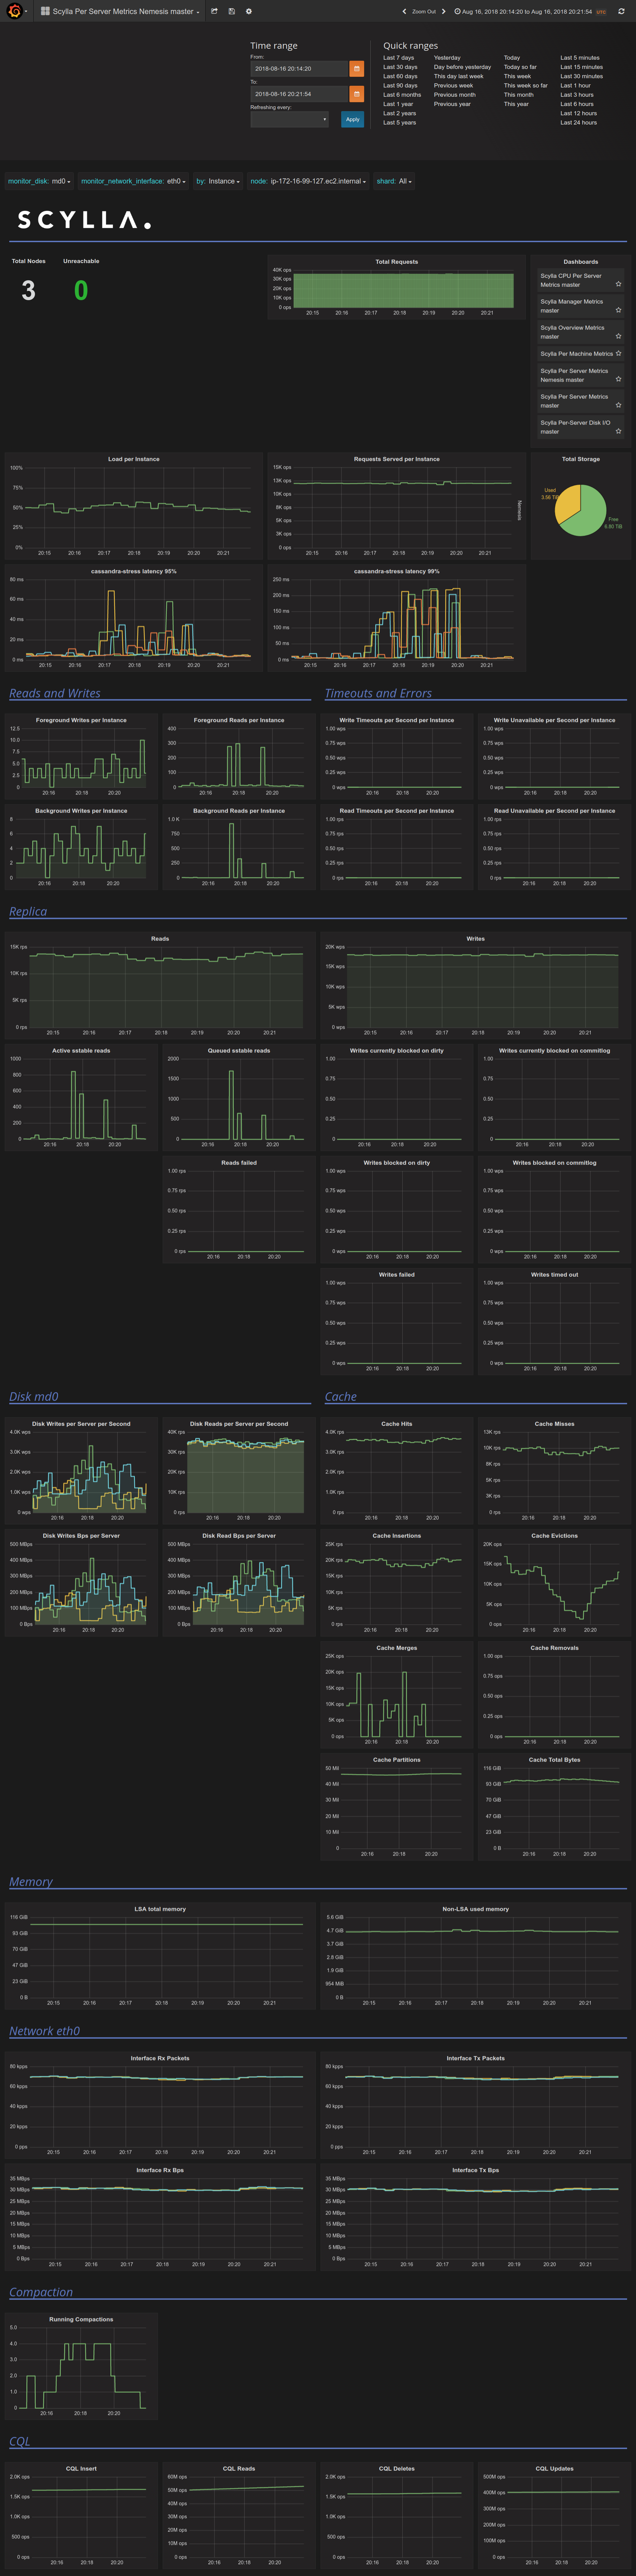
screencapture-54-152-69-49-3000-dashboard-db-scylla-per-server-metrics-nemesis-master-2018-08-17-15_05_04]
https://user-images.githubusercontent.com/283695/44271111-90254f80-a239-11e8-829f-2f6c3821d8f0.png[image:
screencapture-54-152-69-49-3000-dashboard-db-scylla-per-server-disk-i-o-master-2018-08-17-15_04_32]
https://user-images.githubusercontent.com/283695/44271133-99aeb780-a239-11e8-9108-fef99e2ccce4.png—
You are receiving this because you were mentioned.
Reply to this email directly, view it on GitHub
https://github.com/scylladb/scylla/issues/3628#issuecomment-413890517,
or mute the thread
https://github.com/notifications/unsubscribe-auth/AAUNvVZ0EY7NqdGJ_olNSaumIZm1bANyks5uRtg2gaJpZM4VfCGr
.
glommer
on 17 Aug 2018
pt., 17 sie 2018 o 17:39 Glauber Costa notifications@github.com
napisał(a):
On Fri, Aug 17, 2018, 10:50 AM Tomasz Grabiec, notifications@github.com
wrote:Roy reproduced latency spikes in a mixed workload.
c-s clients experience latency of up to 200ms for 99%, where usually
they're below 20ms.That correlates somewhat with 3 spikes of "foreground reads per instance"
on node A.
They correlate with spikes of "Background Reads"They correlate with spikes in active sstable reads on that node (840,
560,
490 reads respectively).There is no loss of throughput on that replica. The amount of cache
misses
seems steady at about 10K row/s, hits at 3.5 k row/s.The spikes correlate with "Running Compactions" reaching 4 on that node.
The spikes in sstable read queue correlate with I/O Queue delay spikes
for
"Compactions" (up to 1s), "Query" (up to 500ms) and Commitlog (up to
70ms).No reactor stalls at that time.
At which threshold ?
8ms.
Average duration between polls doesn't exceed 0.5ms, so it also suggests no
stalls.
Our default threshold for spike reoporting is 2s. So
if we stall for less than that we would not catch it. Since you see delays
in all classes, it is quite possible that this is stall relatedAverage duration between polls doesn't exceed 0.5ms.
Query bandwidth is steady at 80 MBps / 35k IOPS.
Commitlog bandwidth is steady at 22 MBps / 175 IOPS.
Compaction bandwidth fluctuates. When spikes happen, it rises from 380
MBps to 480 MBps, then to 571 MBps.The shape of Compactions I/O queue bandwidth / IOPS correlates well with
the shape of 99% latency of c-s.I suspect an I/O scheduling issue.
$ cat /etc/scylla.d/io_properties.yaml
disks:
- mountpoint: /var/lib/scylla
read_bandwidth: 4030685470
read_iops: 822400
write_bandwidth: 1617551304
write_iops: 363000[image:
screencapture-54-152-69-49-3000-dashboard-db-scylla-per-server-metrics-nemesis-master-2018-08-17-15_05_04]
<
https://user-images.githubusercontent.com/283695/44271111-90254f80-a239-11e8-829f-2f6c3821d8f0.png[image:
screencapture-54-152-69-49-3000-dashboard-db-scylla-per-server-disk-i-o-master-2018-08-17-15_04_32]
<
https://user-images.githubusercontent.com/283695/44271133-99aeb780-a239-11e8-9108-fef99e2ccce4.png—
You are receiving this because you were mentioned.
Reply to this email directly, view it on GitHub
https://github.com/scylladb/scylla/issues/3628#issuecomment-413890517,
or mute the thread
<
https://github.com/notifications/unsubscribe-auth/AAUNvVZ0EY7NqdGJ_olNSaumIZm1bANyks5uRtg2gaJpZM4VfCGr.
—
You are receiving this because you were assigned.
Reply to this email directly, view it on GitHub
https://github.com/scylladb/scylla/issues/3628#issuecomment-413905050,
or mute the thread
https://github.com/notifications/unsubscribe-auth/AARUL7gh4CJGCNvf06n3rkQgGkB89ca4ks5uRuOfgaJpZM4VfCGr
.
tgrabiec
on 17 Aug 2018
Old monitor links don't seem to be working. Where can I find metrics for the last run ?
glommer
on 17 Aug 2018
When the spikes happen, there are many requests queued in the I/O Scheduler, with the vast majority of the requests queued being to the query class
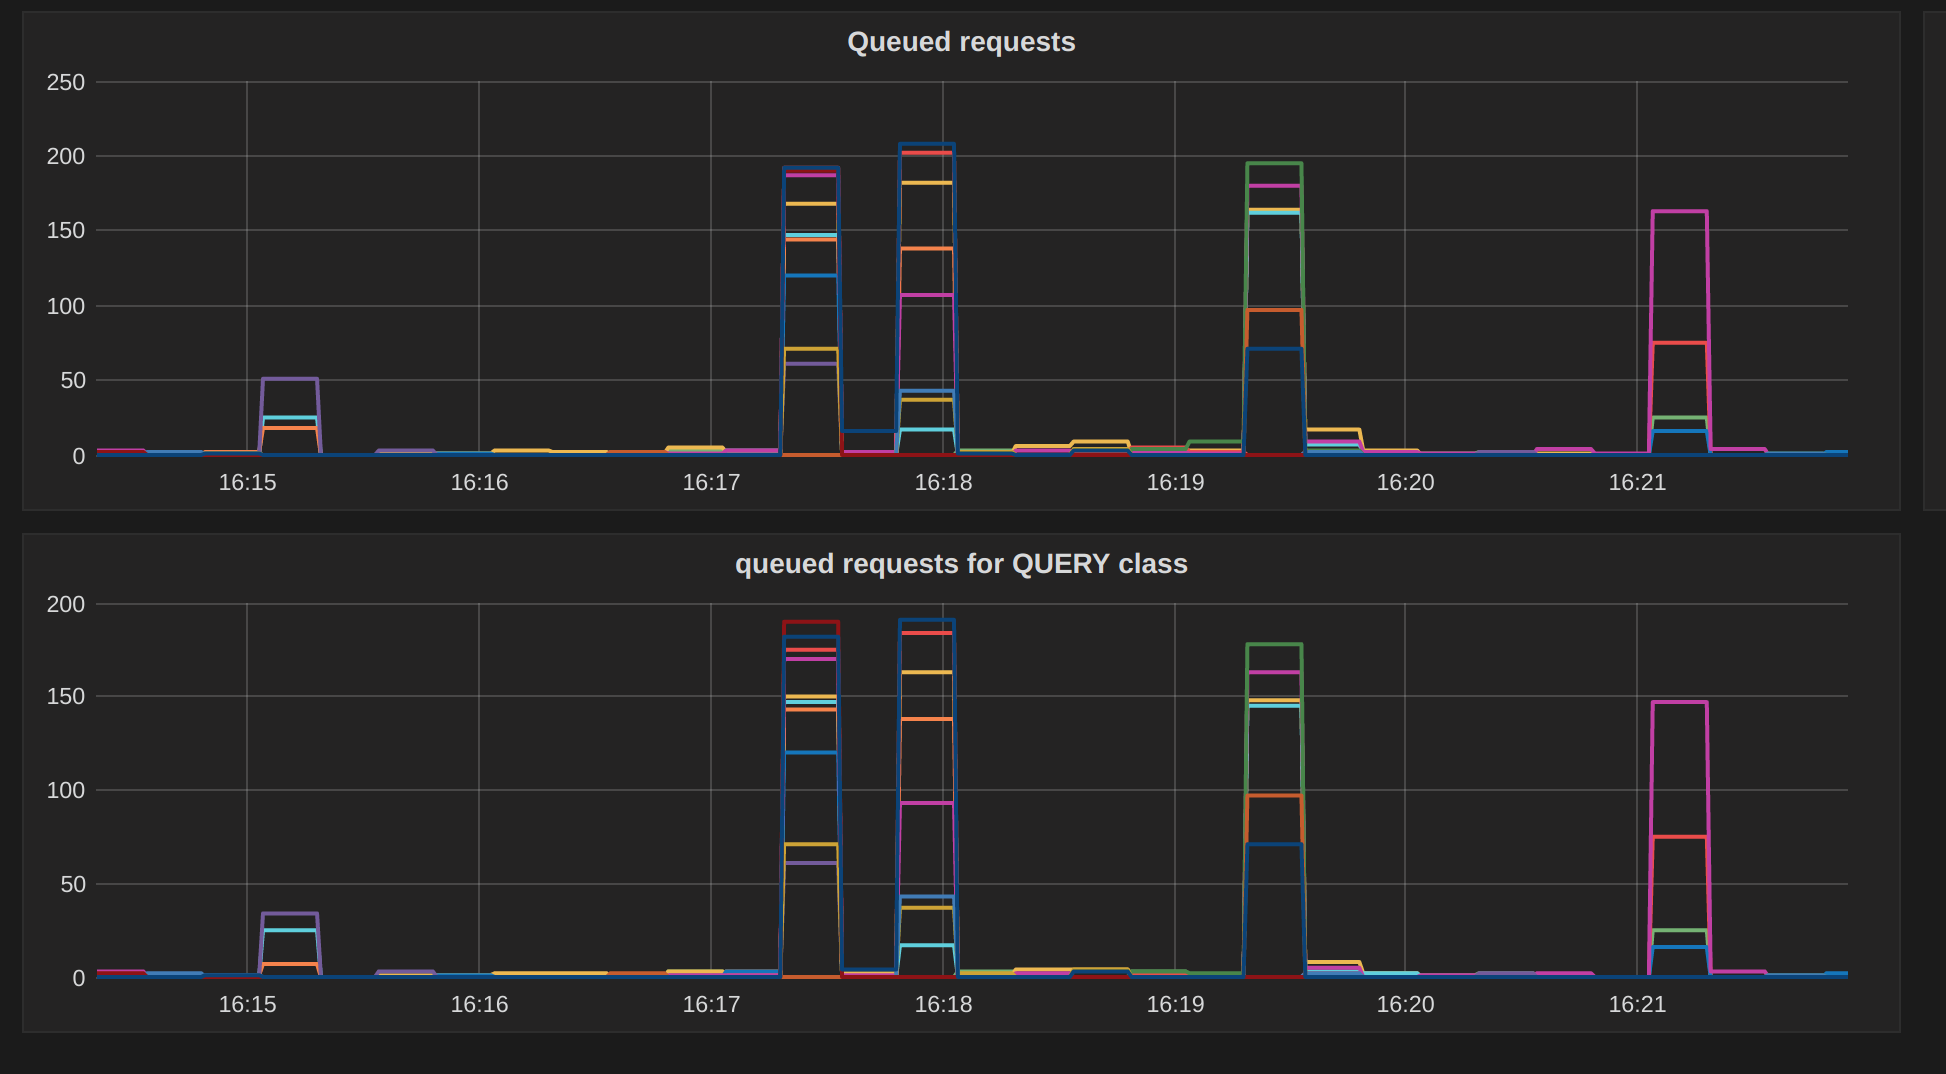
Because those things are spikes, one theory that I came up with is that requests are returning -EAGAIN to io_getevents and are being delayed. Unfortunately we have no metrics counting how many times that happened (maybe we should add, for the 2.3 cycle) so it will be hard to confirm.
While those requests don't come back, the I/O Scheduler will not admit more requests, leading to queueing.
Of course, the code for that is in 2.2 as well, but The 2.3 I/O Scheduler -- aiming for better latencies -- will admit significantly less requests than it would before. Keeping in mind for that: compaction requests are 128kB. 2 compaction write requests (in a shard) would be enough to block the I/O Scheduler, as we will hit the bandwidth bottleneck.
If those requests block and are moved to the syscall thread, we won't see any stalls (because that wasn't a reactor stall), but we won't be able to admit any more query requests either.
In 2.2, using the old thresholds, we would admit 27 requests per shard of any size, of any type. For this workload, we would hit a CPU bottleneck before we could send 27 compaction requests down, so we would never see this effect.
@avikivity and @tgrabiec do you see any holes with this ?
glommer
on 17 Aug 2018
@glommer we should see the reactor.io_threaded_fallbacks counter increase for EAGAIN requests, do you see this?
avikivity
on 17 Aug 2018
Good idea.
There is always a baseline of 3 iothread_fallbacks per second, which I believe are due to other syscalls (correct me if I am wrong, but iothread_fallbacks seems to cover any and all submissions to the syscall thread).
I am plotting here iothreaded_fallbacks - 3 -> so that the baseline would go to 0 and make it easier to see.
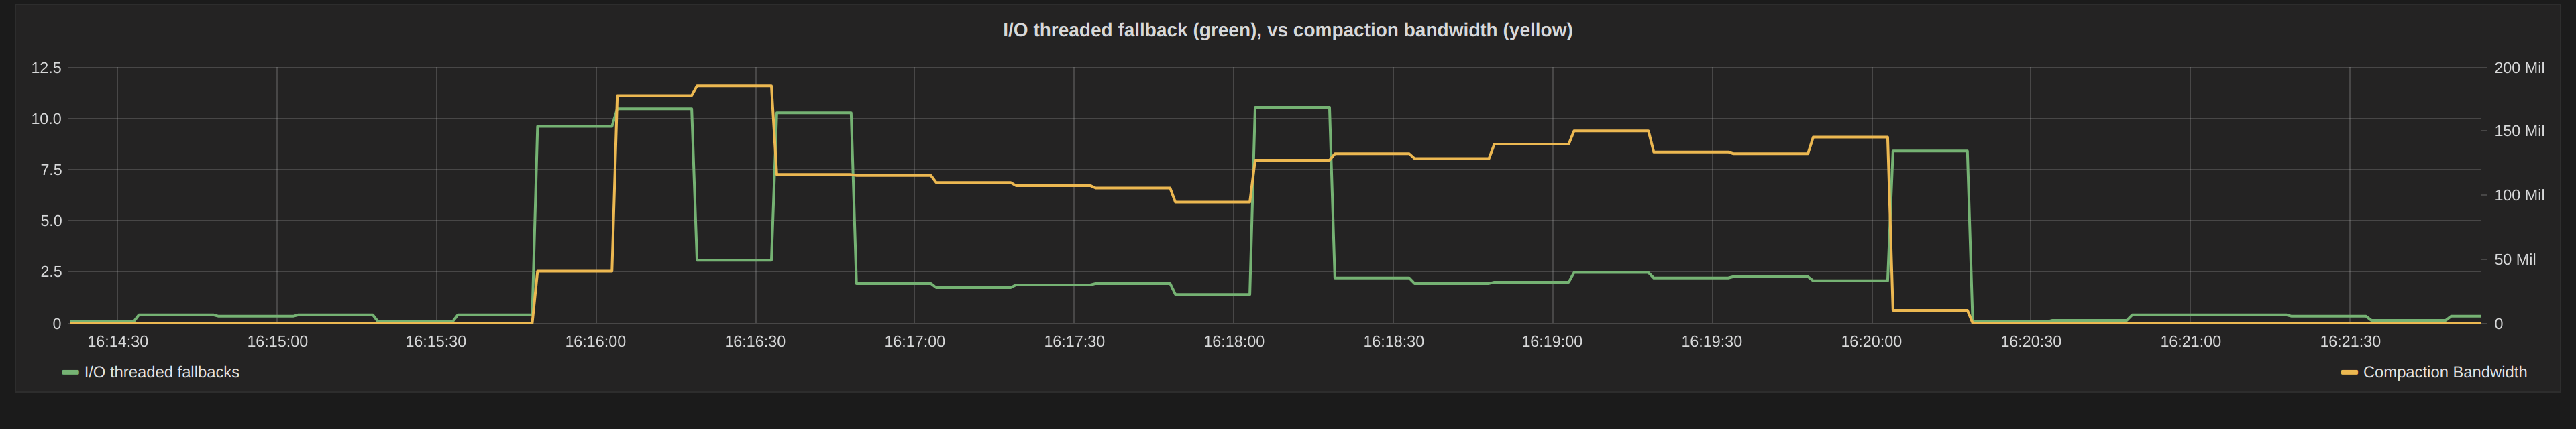
During compactions, we are considerably over the baseline (that's for a single shard)
I think it would help to have a metric just counting the retries. I am about to send a patch. But so far this graph leads some credence to the theory.
@avikivity : those retries should be a write-only phenomenon, no ? We could allow for reads to proceed in this case
glommer
on 17 Aug 2018
3 aios per second, even 10 aios per second, from the I/O thread shouldn't affect anything (and come instead of a reactor stall).
It's possible that a read being queued after a long operation will end up as high latency, but it will show up in the 99th percentile only if we're doing fewer than 1000 reads/sec on the replica (not just misses).
Is that graph for a single shard or for a node? If for a node, it doesn't explain anything (it's dubious even if it's for a shard).
More likely that the I/O scheduler is not behaving correctly. Let's do another run with the I/O scheduler changes reverted.
avikivity
on 17 Aug 2018
We are doing around exactly 1000 reads/sec total.
The graph above is for a single shard.
glommer
on 17 Aug 2018
It says 37200 ops/sec above.
avikivity
on 17 Aug 2018
I am talking about a single shard. Each shard does exactly around 1k/s user-visible reads.
glommer
on 17 Aug 2018
Anyway, I don't see how you get 200 queued read requests with 10 threaded read aios. Those 10 reads should be slower, but should not block other reads.
avikivity
on 17 Aug 2018
exactly around?
avikivity
on 17 Aug 2018
What's the 95th percentile latency? those delays should not affect the 95th.
avikivity
on 17 Aug 2018
My theory is not that the reads are going to the syscall thread.
Is that the writes (for the compaction) are.
Each read request translates into 2.5 disk reads (Each shard issues 2.5k IOPS into the read queue).
This means one arrival at every 400usec
According to the configuration file that Tomek posted, The read bandwidth is 4030685470 bytes/sec, or 287906105 bytes/sec/core. The bandwidth that the I/O Scheduler can sustain concurrently is 3 * 287906105 * 0.0005 = 431859 bytes.
The read:write ratio is 2.49, so each 128kB request will be accounted as 326369 bytes. The I/O Scheduler will therefore, only accept 2 such requests - and nothing else.
Let's assume the worst case where all compaction requests, that have a think time of 0, are sent to the syscall thread, and that adds 50ms worth of delay. That means that every read request will now have to wait 50ms more because the writes are blocking the I/O Queue.
The writes will block the reads, because the I/O Scheduler still counts those requests as ongoing.
glommer
on 17 Aug 2018
One nit: the dashboards are plotting cassandra-stress latency, which will be affected by things like speculative retry and the fact that we'll often hit one of the other replicas.
This is the graph of the server side latencies:
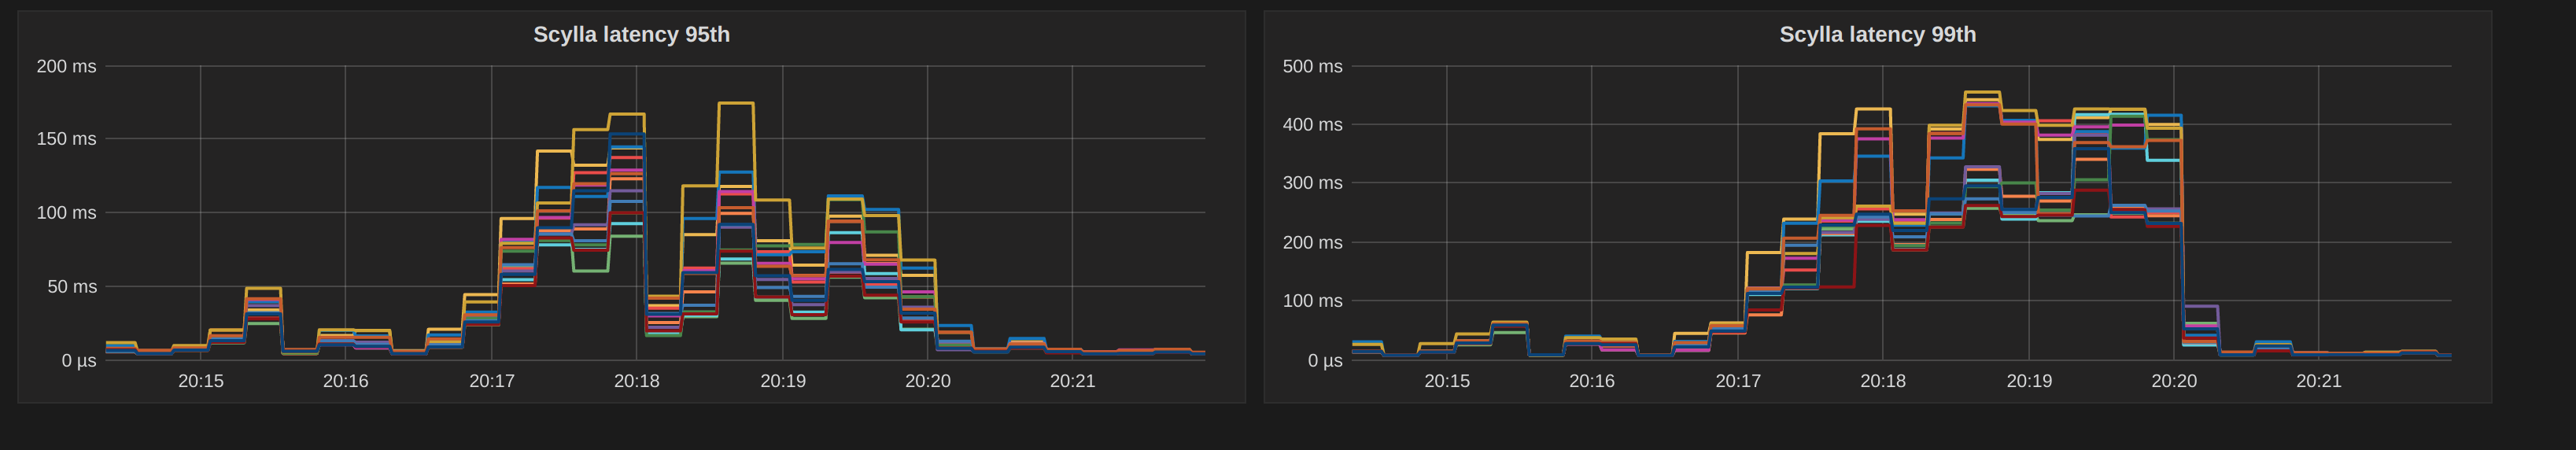
Both 95th and 99th grow during the compaction.
glommer
on 17 Aug 2018
The new I/O scheduler is vulnerable to reduced bandwidth in the way that the old one was not. Since compaction has limited concurrency, it could not saturate the old scheduler, but it can saturate the new one. In addition, the decay time is shorter than the actual latency we see.
This may or may not be related to nowait aio. We can try to disable that and retest.
If it's related nowait aio, we can move the retries to a separate thread rather than sharing the syscall worker thread.
avikivity
on 17 Aug 2018
Once all patches I sent to fix the old scheduler are in, we can definitely try a run with the old io.conf for this setup.
We merged them all, except for one still pending that fixes the number of I/O queues recommendation.
glommer
on 17 Aug 2018
Will it behave in exactly the same way? better to do a complete revert (just for testing).
avikivity
on 17 Aug 2018
It is supposed to.
If it doesn't I consider that a serious regression that I would like to fix ASAP (like the one we actually had).
Keep in mind that not all users will re-run iotune. So if they keep the same parameters as is, they should have the same results.
glommer
on 17 Aug 2018
@glommer of course it is supposed to. The question is whether it will. To extract the most value from the next run, we should completely revert it.
Here are the options depending on what we do and what the result is:
- reverted, regression fixed: we know the I/O scheduler is to blame
- not reverted, regression fixed: we know the I/O scheduler is to blame
- reverted, regression not fixed: we know the I/O scheduler is not to blame
- not reverted, regression not fixed: we don't know anything
So to gain the most knowledge, we need to revert the I/O scheduler (and the related AMI changes) and re-test.
avikivity
on 19 Aug 2018
@glommer , @avikivity , FYI:
When I tried to reproduce the spikes issue using the latest 2.3.rc1 (2.3.rc1-0.20180810.f8cec2f89) the issue did not reproduced (twice).
When I moved back to the same version I open this bug (2.3.rc0-0.20180722.a77bb1fe3), the issue reproduced and this is what @tgrabiec reported above.
@glommer has something changed in I/O scheduler between these commits?
roydahan
on 19 Aug 2018
There's absolutely nothing related.
There were some typo fixes in dist scripts that could have fixed a script failing entirely, so maybe the those got the scheduler badly misconfigured.
Please test once more with each version, maybe it has a 50% probability of reproducing and it just happened to reproduce on the old ones and not reproduce on the new ones, but without a real causation.
avikivity
on 19 Aug 2018
@avikivity for now, what do you want me to do ? Do you want me to prepare a tree with the scheduler changes reverted ?
glommer
on 20 Aug 2018
@glommer tree + uniquely named rpm + instructions for undoing the AMI changes.
(and we should package our AMI stuff in the rpm, maybe as scylla-ami.rpm, and just invoke it from the AMI code)
avikivity
on 20 Aug 2018
A separate ami rpm would be my preference. I told Takuya that when he started. But that's unrelated to this. I will prepare a package here.
glommer
on 20 Aug 2018
@avikivity, spikes aren't reproduces with latest 2.3 (tested several times with 2.3.rc2).
roydahan
on 20 Aug 2018
@roydahan wow. Please give me the two ami IDs, I'd like to do a manual compare of the configuration files.
avikivity
on 20 Aug 2018
I don't see anything between 9b4a0a2879d4df39d199be141c59a15ed1d02c4f and c1cb779dd23cbac9c8103a5ef9e125024b87c483 that could make a difference here (btw, I don't see an actual tag for rc2)
Unless the I/O Scheduler was a total red herring, of course.
glommer
on 20 Aug 2018
@roydahan and how many times did it reproduce with rc0? Please do a couple more runs on that so we are certain it's indeed fixed and not just a flaky test.
avikivity
on 20 Aug 2018
Note that we saw in the past that XFS can introduce high latencies to writes on various occasions, e.g. https://github.com/scylladb/seastar/issues/340. NOWAIT fixes reactor stalls caused by that, but we didn't eliminate this latency from request's service time. I assume that our IO scheduler assumes that such hiccups don't happen.
tgrabiec
on 20 Aug 2018
The I/O scheduler assumes that available bandwidth is constant. If bandwidth drops by a factor of K, average latency will increase by a factor of K (and tail latency may increase more). XFS problems can manifest as bandwidth dropping, and a rejected-aio-write-queuing-behind-some-other-syscall-on-the-same-thread can amplify the problem.
However, these are huge latency increases for long periods of time. A hiccup doesn't explain them.
avikivity
on 20 Aug 2018
Avi, how long would you expect a log flush to last in a customer-grade disk ? (keep in mind that most disks we deal with, including AWS i3 disks are customer grade, with a write-back cache)
I expect all write requests that are sent down during the metadata flush to be blocked. If that takes a long time, all of that will become write latencies.
It seems to me that the dedicated thread for the retried operations sounds like a good idea regardless of this particular issue.
glommer
on 20 Aug 2018
The latency from a consumer-grade disk is unpredictable. The AWS i3 disks, however, are enterprise grade with write through cache.
avikivity
on 20 Aug 2018
@roydahan maybe we picked up a kernel regression in rc0 and unloaded it in rc2. That's something that changes between releases outside git control.
avikivity
on 20 Aug 2018
roy please provide the AMI ids so avi can check this on his own.
On Mon, Aug 20, 2018 at 11:11 PM, Avi Kivity notifications@github.com
wrote:
@roydahan https://github.com/roydahan maybe we picked up a kernel
regression in rc0 and unloaded it in rc2. That's something that changes
between releases outside git control.—
You are receiving this because you were mentioned.
Reply to this email directly, view it on GitHub
https://github.com/scylladb/scylla/issues/3628#issuecomment-414447507,
or mute the thread
https://github.com/notifications/unsubscribe-auth/ADThCDy0mL49BVtwyV_WoTE3CZRpCG-Lks5uSxgMgaJpZM4VfCGr
.
slivne
on 20 Aug 2018
AMI ID of 2.3.rc0 - ami-905252ef (reproduces every time, I'm running again).
AMI ID of 2.3.rc1 - ami-0e40f087569e143a9 (also rc2 and after doesn't reproduce).
roydahan
on 21 Aug 2018
I sent a patch to seastar titled core/reactor: Add counters for IO queue max service time and max queueing time, which can help to confirm or rule out Glauber's theory.
tgrabiec
on 21 Aug 2018
The issue reproduced on:
Version: 2.3.rc2
build date: 20180821
commit id: c1cb779dd
Link to the Grafana:
http://35.230.159.54:3001/dashboard/db/scylla-overview-metrics-2-3?orgId=1&from=1534846806268&to=1534872679275&var-by=instance&var-node=All&var-shard=All
 bentsi
on 23 Aug 2018
bentsi
on 23 Aug 2018
Hard to believe those are the same issues (unless our initial analysis was totally wrong).
It's very hard for I/O Scheduling issues to cause write latencies.
glommer
on 23 Aug 2018
Actually these are read latencies, not the write...
Anb probably they are related to the cache
bentsi
on 23 Aug 2018
What I meant to say was that we have write spikes as well.
They are not as big as reads, but we shouldn't really see any if I/O was the problem.
@tgrabiec will look at it.
glommer
on 23 Aug 2018
czw., 23 sie 2018 o 16:38 Bentsi notifications@github.com napisał(a):
Actually these are read latencies, not the write...
Anb probably they are related to the cache
Why do you think they're related to the cache?
tgrabiec
on 23 Aug 2018
@tgrabiec - are you looking at the metrics - I think you mentioned something in the daily call ...
slivne
on 3 Sep 2018
@slivne Yes.
On one of the nodes, one shard serves reads (cache missing mostly) with higher latency than all other shards, due to higher per-request CPU cost, and thus higher CPU utilization. The per-read CPU cost is calculated as a runtime change for the statement scheduling group divided by the number of retired reads. Other nodes and shards have that cost at about half the initial value. The cost also increases with time on the slow shard. That correlates with growing CPU user time, and shrinking system time (due to increased poll period). That shard was already 84% utilized, more than the sibling shards on other nodes (70%) and due to increasing runtime of the statement scheduling group, it finally saturates. Until it saturates, the throughput is flat, but then, since the cost keeps increasing, it starts to drop. This is when speculative retries start to grow the background read queue for that shard, which after 5 seconds start to time-out, which shows in the metrics as a spike of foreground reads due to https://github.com/scylladb/scylla/issues/3734.
Client-side latencies are growing slowly due to speculation getting late https://github.com/scylladb/scylla/issues/3746, and eventually reach 2.5 s, which is the threshold at which speculative retry is forced, bypassing the read latency histogram threshold.
Read latency for requests going through non-slow nodes remains low, because they are less likely to hit the slow shard (50% vs 100%, times 1/14, cause we have 14 shards), and they keep speculating throughout the event.
After some time the per-read cost drops for a short while (one metric tick, so 0-30 sec), restoring throughput and causing the background queue to drain, but then jumps back to high level, keeping the CPU still fully utilized. This will not form a large background queue though, probably because speculation is now dormant on the slow node. The c-s latency will settle at ~500ms, which is probably a product of client concurrency (including speculations coming from other nodes) and the CPU cost of a read. After a few minutes, the cost of a read drops, and the core becomes underutilized again, and all is back to normal.
The same scenario repeats again after ~10 minutes since the start of the first one.
tgrabiec
on 3 Sep 2018
Shouldn't we close this one and move the discussion to these other two
issues? Btw - if they aren't regressions, let's not block 2.3
On Mon, Sep 3, 2018 at 10:35 AM Tomasz Grabiec notifications@github.com
wrote:
@slivne https://github.com/slivne Yes.
On one of the nodes, one shard serves reads with higher latency than all
other shards, due to higher per-request CPU cost, and thus higher CPU
utilization. The per-read CPU cost is calculated as a runtime change for
the statement scheduling group divided by the number of retired reads.
Other nodes and shards have that cost at about half the initial value. The
cost also increases with time on the slow shard. That correlates with
growing CPU user time, and shrinking system time (due to increased poll
period). That shard was already 84% utilized, more than the sibling shards
on other nodes (70%) and due to increasing runtime of the statement
scheduling group, it finally saturates. Until it saturates, the throughput
is flat, but then, since the cost keeps increasing, it starts to drop. This
is when speculative retries start to grow the background read queue for
that shard, which after 5 seconds start to time-out, which shows in the
metrics as a spike of foreground reads due to #3734
https://github.com/scylladb/scylla/issues/3734.Client-side latencies are growing slowly due to speculation getting late
3746 https://github.com/scylladb/scylla/issues/3746, and eventually
reach 2.5 s, which is the threshold at which speculative retry is forced,
bypassing the read latency histogram threshold.Read latency for requests going through non-slow nodes remains low,
because they are less likely to hit the slow shard (50% vs 100%), and they
keep speculating throughput the event.After some time the per-read cost drops for a short while (one metric
tick, so 0-30 sec), restoring throughput and causing the background queue
to drain, but then jumps back to high level, keeping the CPU still fully
utilized. This will not form a large background queue though, probably
because speculation is now dormant on the slow node. The c-s latency will
settle at ~500ms, which is probably a product of client concurrency
(including speculations coming from other nodes) and the CPU cost of a
read. After a few minutes, the cost of a read drops, and the core becomes
underutilized again, and all is back to normal.The same scenario repeats again after ~10 minutes since the start of the
first one.—
You are receiving this because you commented.
Reply to this email directly, view it on GitHub
https://github.com/scylladb/scylla/issues/3628#issuecomment-418167020,
or mute the thread
https://github.com/notifications/unsubscribe-auth/ABp6RaV_9rmiZ-ZqLkpfYIiLP0D2Rx_lks5uXWhvgaJpZM4VfCGr
.
dorlaor
on 3 Sep 2018
The two issues I mentioned are involved, but are not at the cause. The
cause is that reads are getting more expensive and saturate a core. I am
not sure if it's a regression or not, because we don't know the cause of
this.
pon., 3 wrz 2018 o 19:55 Dor Laor notifications@github.com napisał(a):
Shouldn't we close this one and move the discussion to these other two
issues? Btw - if they aren't regressions, let's not block 2.3On Mon, Sep 3, 2018 at 10:35 AM Tomasz Grabiec notifications@github.com
wrote:@slivne https://github.com/slivne Yes.
On one of the nodes, one shard serves reads with higher latency than all
other shards, due to higher per-request CPU cost, and thus higher CPU
utilization. The per-read CPU cost is calculated as a runtime change for
the statement scheduling group divided by the number of retired reads.
Other nodes and shards have that cost at about half the initial value.
The
cost also increases with time on the slow shard. That correlates with
growing CPU user time, and shrinking system time (due to increased poll
period). That shard was already 84% utilized, more than the sibling
shards
on other nodes (70%) and due to increasing runtime of the statement
scheduling group, it finally saturates. Until it saturates, the
throughput
is flat, but then, since the cost keeps increasing, it starts to drop.
This
is when speculative retries start to grow the background read queue for
that shard, which after 5 seconds start to time-out, which shows in the
metrics as a spike of foreground reads due to #3734
https://github.com/scylladb/scylla/issues/3734.Client-side latencies are growing slowly due to speculation getting late
3746 https://github.com/scylladb/scylla/issues/3746, and eventually
reach 2.5 s, which is the threshold at which speculative retry is forced,
bypassing the read latency histogram threshold.Read latency for requests going through non-slow nodes remains low,
because they are less likely to hit the slow shard (50% vs 100%), and
they
keep speculating throughput the event.After some time the per-read cost drops for a short while (one metric
tick, so 0-30 sec), restoring throughput and causing the background queue
to drain, but then jumps back to high level, keeping the CPU still fully
utilized. This will not form a large background queue though, probably
because speculation is now dormant on the slow node. The c-s latency will
settle at ~500ms, which is probably a product of client concurrency
(including speculations coming from other nodes) and the CPU cost of a
read. After a few minutes, the cost of a read drops, and the core becomes
underutilized again, and all is back to normal.The same scenario repeats again after ~10 minutes since the start of the
first one.—
You are receiving this because you commented.
Reply to this email directly, view it on GitHub
https://github.com/scylladb/scylla/issues/3628#issuecomment-418167020,
or mute the thread
<
https://github.com/notifications/unsubscribe-auth/ABp6RaV_9rmiZ-ZqLkpfYIiLP0D2Rx_lks5uXWhvgaJpZM4VfCGr.
—
You are receiving this because you were mentioned.
Reply to this email directly, view it on GitHub
https://github.com/scylladb/scylla/issues/3628#issuecomment-418169653,
or mute the thread
https://github.com/notifications/unsubscribe-auth/AARUL3PhVRigxc36gXNHkUniCmzsW318ks5uXWz3gaJpZM4VfCGr
.
tgrabiec
on 3 Sep 2018
On Mon, Sep 03, 2018 at 10:35:46AM -0700, Tomasz Grabiec wrote:
Client-side latencies are growing slowly due to speculation getting late https://github.com/scylladb/scylla/issues/3746, and eventually reach 2.5 s, which is the threshold at which speculative retry is forced, bypassing the read latency histogram threshold.
The question is what will happen if we will speculate earlier. Latencies
will be better, but background work will accumulate fast and eventually
coordinator will OOM or will fall back to the current behaviour due
to throttling (which is not yet exists for reads, so for now it will be
OOM).
--
Gleb.
gleb-cloudius
on 4 Sep 2018
wt., 4 wrz 2018 o 09:11 Gleb Natapov notifications@github.com napisał(a):
On Mon, Sep 03, 2018 at 10:35:46AM -0700, Tomasz Grabiec wrote:
Client-side latencies are growing slowly due to speculation getting late
https://github.com/scylladb/scylla/issues/3746, and eventually reach 2.5
s, which is the threshold at which speculative retry is forced, bypassing
the read latency histogram threshold.The question is what will happen if we will speculate earlier. Latencies
will be better, but background work will accumulate fast and eventually
coordinator will OOM or will fall back to the current behaviour due
to throttling (which is not yet exists for reads, so for now it will be
OOM).
Yes, in this case doing #3746 wouldn't bring any benefit, since the slow
core eventually reduces throughput.
>
tgrabiec
on 4 Sep 2018
@tgrabiec @gleb-cloudius we've seen that shards running on socket 1, core 0 are sometimes much slower than other shards. There's nothing special about socket 1, core 0 that I know of. Socket 0, core 0 is special in that it is assigned to networking, but that shouldn't affect socket 1.
Do you know the shard->cpu mapping in that test?
avikivity
on 4 Sep 2018
wt., 4 wrz 2018 o 09:16 Avi Kivity notifications@github.com napisał(a):
@tgrabiec https://github.com/tgrabiec @gleb-cloudius
https://github.com/gleb-cloudius we've seen that shards running on
socket 1, core 0 are sometimes much slower than other shards. There's
nothing special about socket 1, core 0 that I know of. Socket 0, core 0 is
special in that it is assigned to networking, but that shouldn't affect
socket 1.Do you know the shard->cpu mapping in that test?
The slow shard is shard 10, which is cpu6 in nodeexporter, which I think is
on socket 0.
>
tgrabiec
on 4 Sep 2018
wt., 4 wrz 2018 o 09:15 Tomasz Grabiec tgrabiec@gmail.com napisał(a):
>
>
wt., 4 wrz 2018 o 09:11 Gleb Natapov notifications@github.com
napisał(a):On Mon, Sep 03, 2018 at 10:35:46AM -0700, Tomasz Grabiec wrote:
Client-side latencies are growing slowly due to speculation getting
late https://github.com/scylladb/scylla/issues/3746, and eventually
reach 2.5 s, which is the threshold at which speculative retry is forced,
bypassing the read latency histogram threshold.The question is what will happen if we will speculate earlier. Latencies
will be better, but background work will accumulate fast and eventually
coordinator will OOM or will fall back to the current behaviour due
to throttling (which is not yet exists for reads, so for now it will be
OOM).Yes, in this case doing #3746 wouldn't bring any benefit, since the slow
core eventually reduces throughput.
To fix this case, we would have to do some kind of latency-based load
balancing, which would not leave a background queue.
tgrabiec
on 4 Sep 2018
On Tue, Sep 04, 2018 at 07:18:50AM +0000, Tomasz Grabiec wrote:
wt., 4 wrz 2018 o 09:16 Avi Kivity notifications@github.com napisał(a):
@tgrabiec https://github.com/tgrabiec @gleb-cloudius
https://github.com/gleb-cloudius we've seen that shards running on
socket 1, core 0 are sometimes much slower than other shards. There's
nothing special about socket 1, core 0 that I know of. Socket 0, core 0 is
special in that it is assigned to networking, but that shouldn't affect
socket 1.Do you know the shard->cpu mapping in that test?
The slow shard is shard 10, which is cpu6 in nodeexporter, which I think is
on socket 0.You also saying the shard is not always slower, it just sometimes
becomes slower, right?
--
Gleb.
gleb-cloudius
on 4 Sep 2018
wt., 4 wrz 2018 o 09:22 Gleb Natapov notifications@github.com napisał(a):
On Tue, Sep 04, 2018 at 07:18:50AM +0000, Tomasz Grabiec wrote:
wt., 4 wrz 2018 o 09:16 Avi Kivity notifications@github.com
napisał(a):@tgrabiec https://github.com/tgrabiec @gleb-cloudius
https://github.com/gleb-cloudius we've seen that shards running on
socket 1, core 0 are sometimes much slower than other shards. There's
nothing special about socket 1, core 0 that I know of. Socket 0, core
0 is
special in that it is assigned to networking, but that shouldn't affect
socket 1.Do you know the shard->cpu mapping in that test?
The slow shard is shard 10, which is cpu6 in nodeexporter, which I think
is
on socket 0.You also saying the shard is not always slower, it just sometimes
becomes slower, right?
Yes, it eventually recovers, it looks as if the cost of a read varies.
tgrabiec
on 4 Sep 2018
On Tue, Sep 04, 2018 at 12:21:34AM -0700, Tomasz Grabiec wrote:
wt., 4 wrz 2018 o 09:15 Tomasz Grabiec tgrabiec@gmail.com napisał(a):
>
>wt., 4 wrz 2018 o 09:11 Gleb Natapov notifications@github.com
napisał(a):On Mon, Sep 03, 2018 at 10:35:46AM -0700, Tomasz Grabiec wrote:
Client-side latencies are growing slowly due to speculation getting
late https://github.com/scylladb/scylla/issues/3746, and eventually
reach 2.5 s, which is the threshold at which speculative retry is forced,
bypassing the read latency histogram threshold.The question is what will happen if we will speculate earlier. Latencies
will be better, but background work will accumulate fast and eventually
coordinator will OOM or will fall back to the current behaviour due
to throttling (which is not yet exists for reads, so for now it will be
OOM).Yes, in this case doing #3746 wouldn't bring any benefit, since the slow
core eventually reduces throughput.To fix this case, we would have to do some kind of latency-based load
balancing, which would not leave a background queue.This is exactly what what dynamic snitch in Cassandra is doing and we
decided to not implement it because it susceptible to fluctuations.
--
Gleb.
gleb-cloudius
on 4 Sep 2018
@tgrabiec / @avikivity - going back to the original issue "The
cause is that reads are getting more expensive and saturate a core. I am
not sure if it's a regression or not, because we don't know the cause of
this."
whats the next step
slivne
on 4 Sep 2018
@slivne I think we should:
1) collect more relevant metrics: CPU frequency, CPU throttling, instructions per cycle. which will allow us to identify if the slow down is due to hardware. The latest version of node_exporter already exports some of those, so we should upgrade our stack (\cc @roydahan @tzach).
2) apply the patch "core/reactor: Add counters for IO queue max service time and max queueing time", for diagnosing issues found in earlier runs.
3) add a seastar feature to automatically run perf record when shards become fully utilized, for later analysis (on me)
4) run with --blocked-reactor-notify-ms 4
5) run with --logger-log-level lsa-timing=trace
I will prepare an RPM with 2) and 3)
tgrabiec
on 4 Sep 2018
- I can try using branch-2.0 of monitor if it contains the relevant metrics.
4 & 5 I can add to the the run with your new RPMs.
roydahan
on 4 Sep 2018
I have found a correlation between CPU cost of a read and interrupts (sum(irate(node_interrupts{instance="172.16.99.5:9100"}[30s])) by (CPU)):
CPUs 0 and 8 (green and navy) are isolated, not used by scylla. CPU 6 (brown) is shard 10, and it's the only shard with such a high number of interrupts used by Scylla. Interestingly, node_cpu{mode="irq", cpu="6"} is flat at 0, and node_cpu{mode="softirq", cpu="6"} is low (~1%), lower on CPU 6 than on all other CPUs, and its shape doesn't correlate with the slowdown.
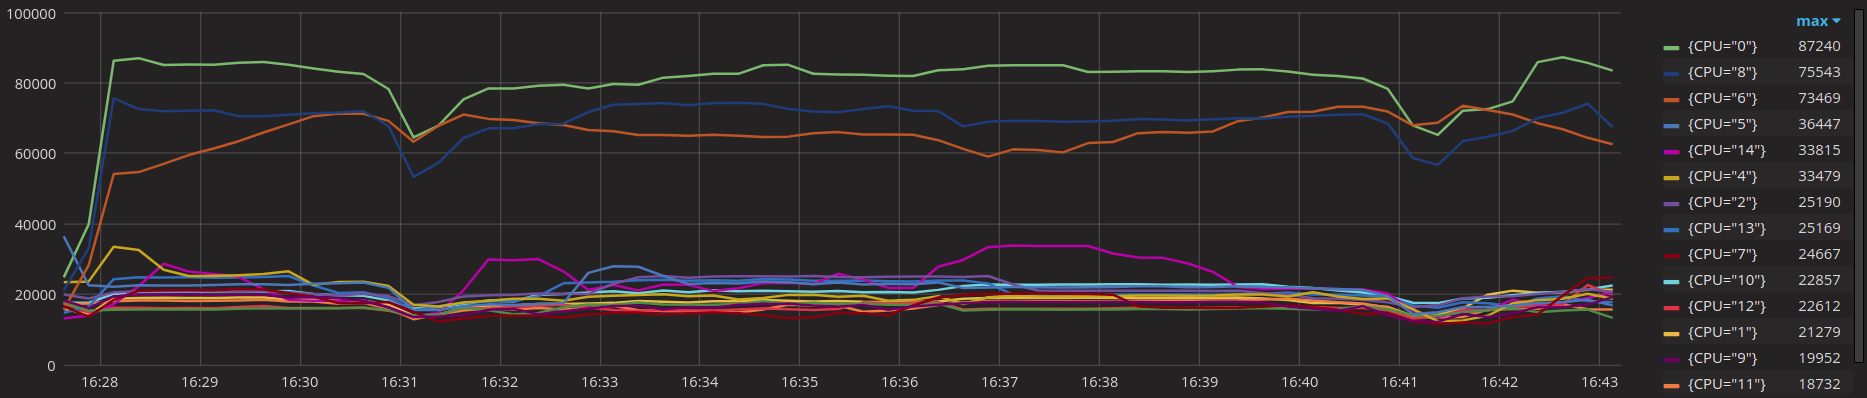
The interrupts which contribute to the correlation seem to be all related to NVMe (showing CPU 6 only):
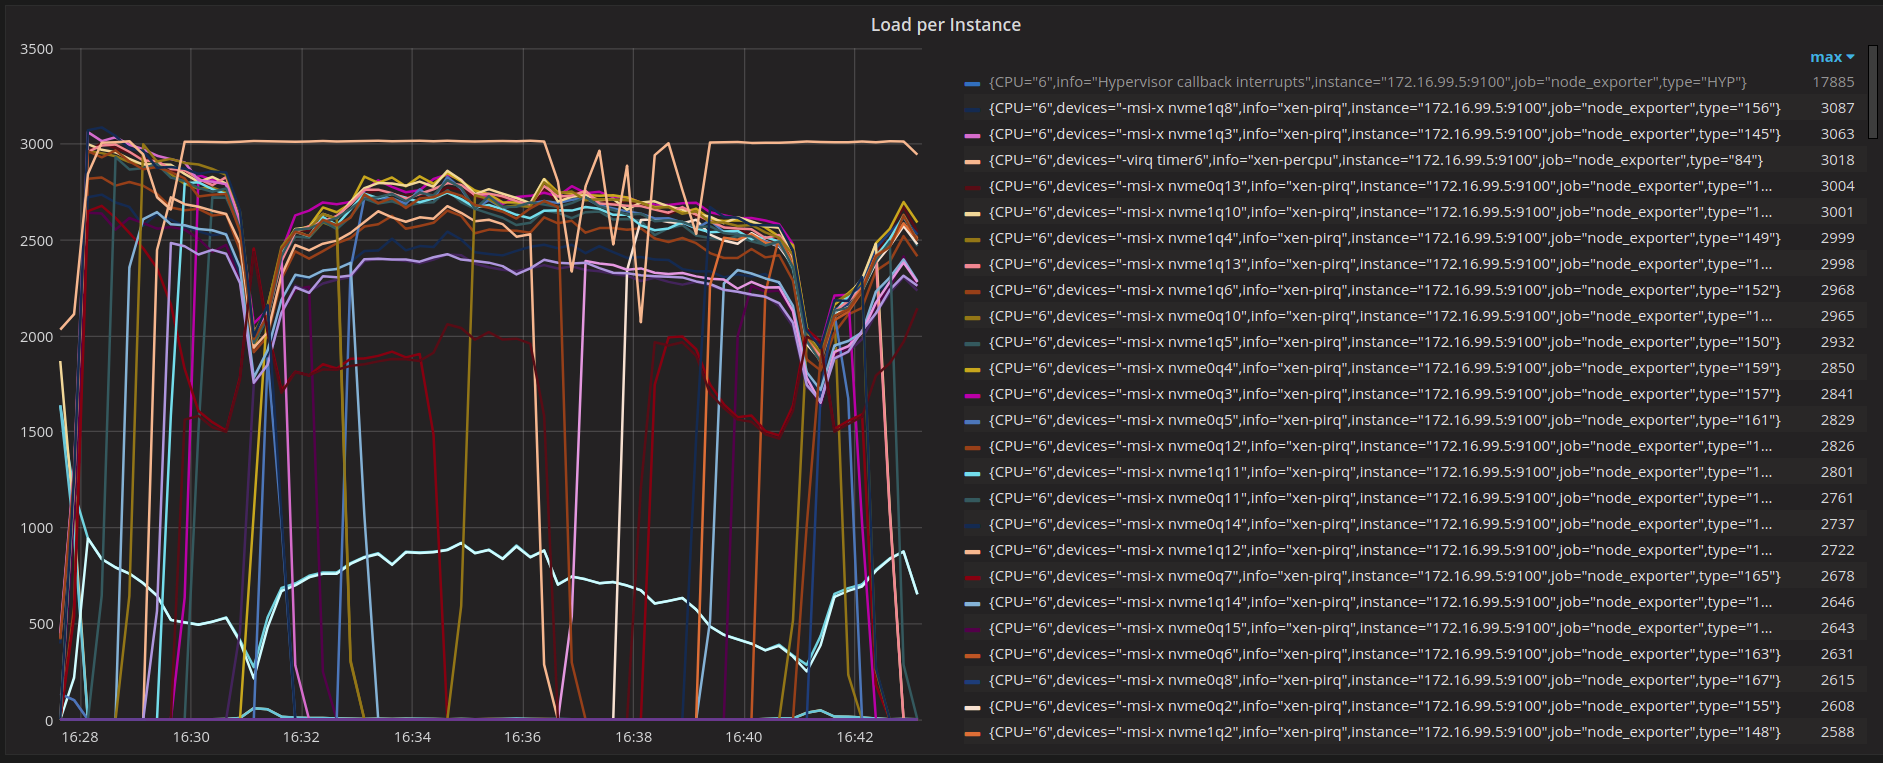
(link: http://35.230.159.54:3001/dashboard/db/scylla-per-server-metrics-2-3?refresh=30s&orgId=1&from=1534861658000&to=1534862593000&panelId=6&fullscreen&edit&var-monitor_disk=xvda&var-monitor_network_interface=eth0&var-by=instance&var-node=ip-172-16-99-5.ec2.internal&var-shard=10&tab=metrics)
tgrabiec
on 4 Sep 2018
Do we have irqbalance running on those machines?
@vladzcloudius what's our nvme irq distribution policy?
avikivity
on 4 Sep 2018
@avikivity We don't tune disks IRQs at the moment although perftune.py has all relevant logic since day0. We haven't enabled it because we haven't tested it on all possible setups. However everywhere we tested it it yielded (sometimes very significant) improvement in performance.
Therefore on i3.4xlarge instances, if irqbalance is not running, all NVMe IRQs are going to be handled on CPU0 because they would have all-Fs mask in their smp_affinitys.
If the relevant perftune.py logic was enabled then NVMe interrupts were evenly distributed among all present CPUs.
 vladzcloudius
on 4 Sep 2018
vladzcloudius
on 4 Sep 2018
I can see from the metrics that interrupts shift between CPUs during the run, so it looks like irqbalance is running.
tgrabiec
on 5 Sep 2018
Possible causes for the regression:
- we didn't run irqbalance in 2.2, but we do now
- irqbalance behavior changed (unlikely)
- 2.3 has slower interrupt handling then 2.2 due to its kernel having more meltdown/spectre mitigation
Possible fixes:
- statically assign nvme interrupts, at least on aws i3
avikivity
on 5 Sep 2018
On 09/05/2018 03:32 AM, Avi Kivity wrote:
>
Possible causes for the regression:
- we didn't run irqbalance in 2.2, but we do now
I think I noticed the above too (that we run irqbalance now). This may
definitely be a cause for a regression provided our "IRQ CPUs" are not
overloaded in non-irqbalance configuration.
- irqbalance behavior changed (unlikely)
I agree that this is unlikely the case... ;)
- 2.3 has slower interrupt handling then 2.2 due to its kernel
having more meltdown/spectre mitigationPossible fixes:
- statically assign nvme interrupts, at least on aws i3
From my personal experience this is definitely going to improve scylla
performance.
When we throw all NVMe interrupts on the core0 CPUs two bad things happen:
- We get the worst configuration regarding the NVMe IPIs - all NVMe
interrupts are "remote". - The load on the "IRQ CPUs" is going to be high and sometimes very
significant. This may cause these CPUs to become a bottleneck.
So, distributing NVMe IRQs is likely going to improve the performance
compared to 2.2.
If we compare the performance of this configuration to the one where
irqbalance is responsible for NVMe IRQs - a static distribution has one
important advantage which is consistency.
In order to enable tuning of NVMe interrupts the following arguments
need to be added to perftune.py: --tune disks --dir /var/lib/scylla
Shlomi, please, let me know if you want me to send the corresponding
patches.
—
You are receiving this because you were mentioned.
Reply to this email directly, view it on GitHub
https://github.com/scylladb/scylla/issues/3628#issuecomment-418628979,
or mute the thread
https://github.com/notifications/unsubscribe-auth/AF0jre3YSu7DKC-TonT-OtuBrDxVBVk6ks5uX34GgaJpZM4VfCGr.
vladzcloudius
on 5 Sep 2018
does this bug still in 2.3 release?
 wqwiii
on 19 Oct 2018
wqwiii
on 19 Oct 2018
@wqwiii Yes.
tgrabiec
on 19 Oct 2018
Patch to tune nvme interrupts was merged (check #3816) closing this issue
slivne
on 6 Apr 2020
Related issues
 dimaqq
·
6Comments
dimaqq
·
6Comments
 veramine
·
5Comments
vladzcloudius
·
5Comments
veramine
·
5Comments
vladzcloudius
·
5Comments
 duarten
·
5Comments
duarten
·
5Comments
 hellowaywewe
·
3Comments
hellowaywewe
·
3Comments