Screwdriver: CPU load increases and API response worsens @APIv4
What happened:
When I updated the API from v0.5.969 to v4.0.10, the CPU load became so high that it caused frequent processing timeouts. Sometimes it fails to receive webhooks, sometimes pages in the pipeline are slow to appear, and numerous other failures occur. In some cases, the load on the cpu reached 100% and the webhook process took more than 9 seconds.
{"level":"error","message":"Failed to decorateCommit: CircuitBreaker timeout","stack":"Error: CircuitBreaker timeout\n at CircuitBreaker.handleTimeout (/usr/src/app/node_modules/screwdriver-node-circuitbreaker/lib/circuit-breaker.js:76:17)\n at listOnTimeout (internal/timers.js:551:17)\n at processTimers (internal/timers.js:492:7)","timestamp":"2020-09-17T02:09:19.844Z"}
I tried increasing the number of cpu's but it didn't work as the load on just one core was at 100%.
I am currently investigating and have yet to determine what is the primary cause of the problem.
What you expected to happen:
This is a fatal Issue for us. I hopefully this can be resolved ASAP.
How to reproduce it:
Upgrading the API to v4.0.10
I use MySQL for DB.
 wahapo
All 15 comments
I could reproduce the slow response of the API when using SD-in-a-box (with MySQL as DB).
/v4/metrics API for displaying a collection, and /v4/webhooks API for PR were slow to respond.
wahapo
on 17 Sep 2020
we are noticing the same well in our env.
 jithine
on 18 Sep 2020
jithine
on 18 Sep 2020
We noticed it across API calls. Build detail page, Pipeline page, Collections page etc were not loading.
cc @pritamstyz4ever @parthasl
jithine
on 18 Sep 2020
I looked increasing a number of Slow log detected logs. But I'm not sure it's caused or related.
 tk3fftk
on 18 Sep 2020
tk3fftk
on 18 Sep 2020
Likely a result of hapi.js upgrades, we did jump several major versions. Need to to a performance profiling to narrow down what could be going on.
jithine
on 19 Sep 2020
This is what happened in our cluster when API@4 was rolled out, thanks to metrics exposed via #2115 Spike is for the brief window during which the new API was live before we rolled back.
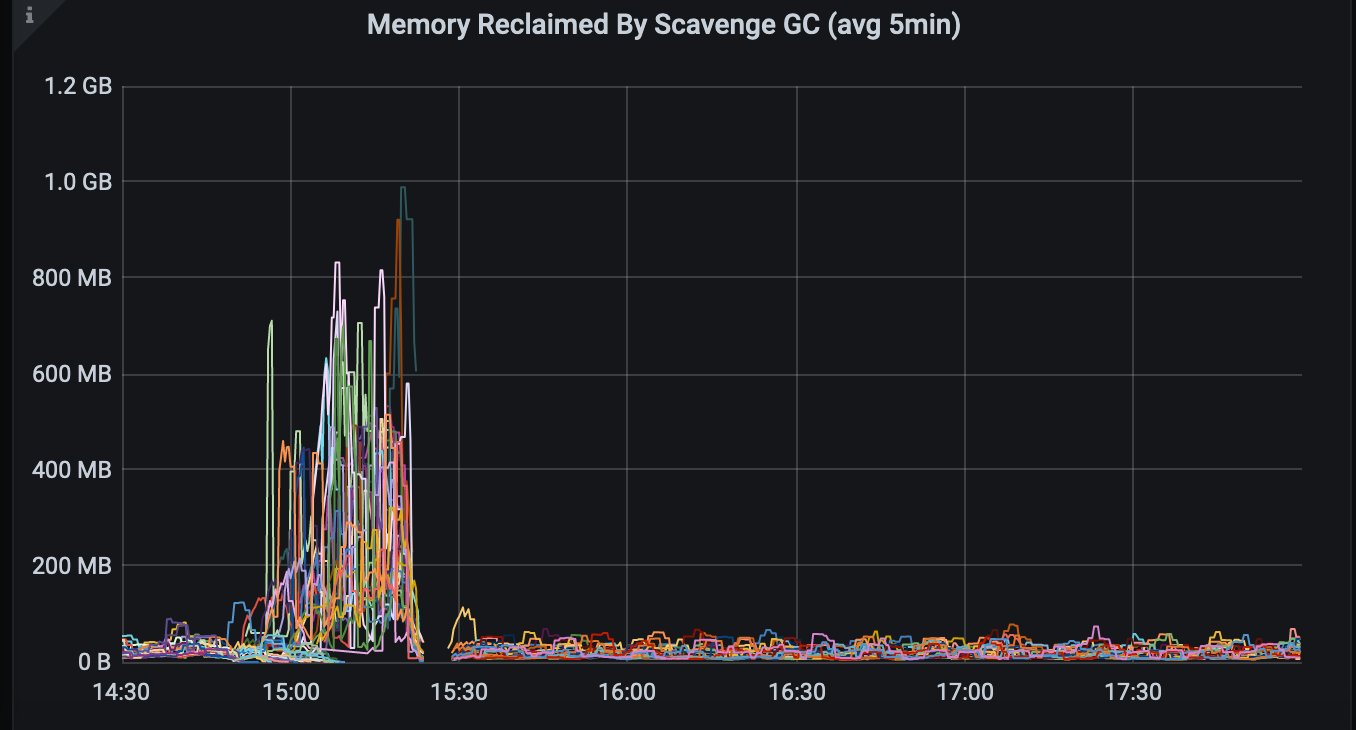
GC collection spiked up. That suggests our ORM model might be creating and destroying too many short lived objects. We need to take a deeper look into if anything changed at interaction between models <-> sequalize
jithine
on 22 Sep 2020
I downgraded the version of sequelize from 6 to 5. Does this also have some impact? It might be worthwhile to verify if upgrading to version 6 would solve the problem.
https://github.com/screwdriver-cd/datastore-sequelize/pull/76
wahapo
on 23 Sep 2020
@pritamstyz4ever made some progress on profiling it, and we are in the middle of creating few PRs. We are focusing fixes around joi usage. Will update results here soon.
jithine
on 23 Sep 2020
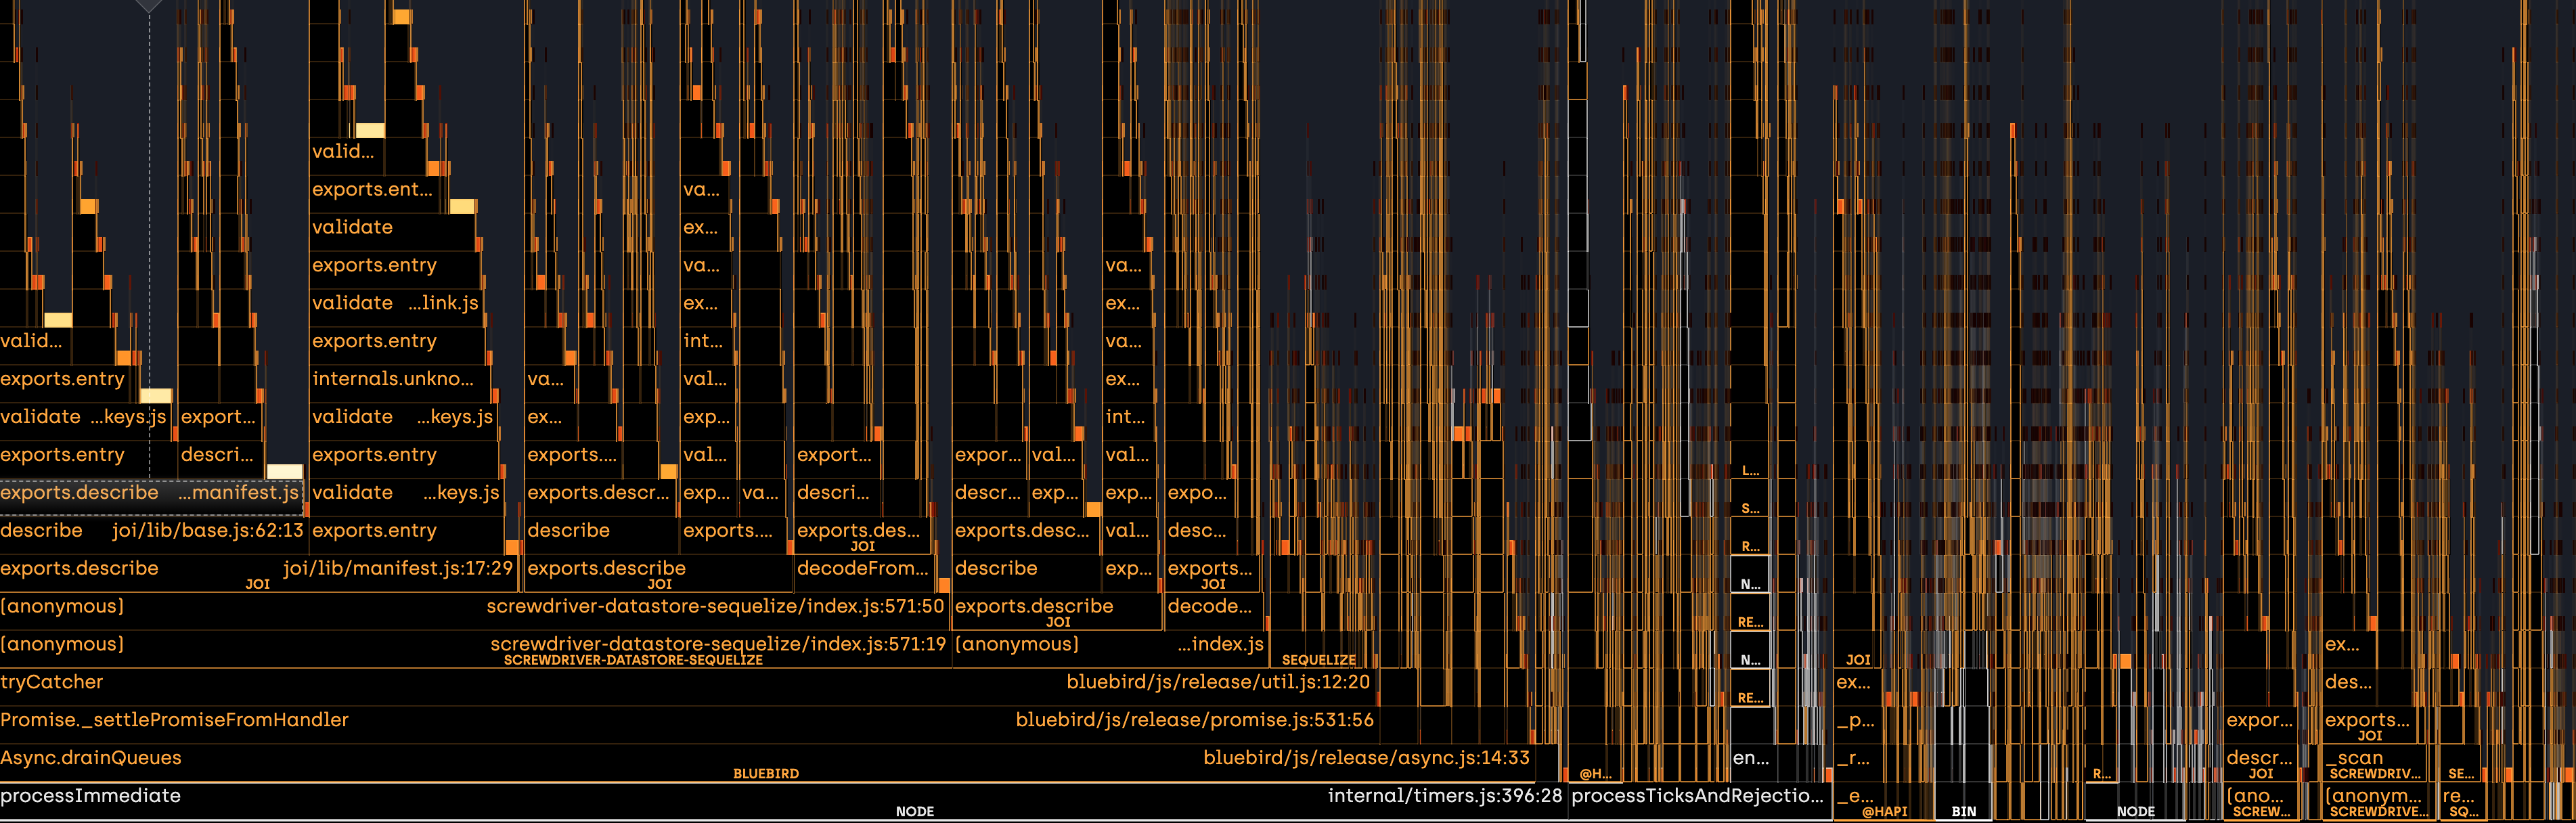
Profiling the SD api showed some hot functions that are taking a lot of the processing time. Validation in joi library is slow in general for all SD models.
These are the top 4 hits:
- ../node_modules/joi/lib/validator.js
- https://github.com/screwdriver-cd/datastore-sequelize/blob/b4609dc1ccb38888b26afc2f048f5f9cec6b6bb5/index.js#L27
- https://github.com/screwdriver-cd/models/blob/master/lib/baseFactory.js#L215
- ../node_modules/circuit-fuses/index.js
PR's are raised to fix 2 & 3. 1 is not something we can fix directly we should consider revisiting our overall schema and validation in general. 4 is basically an effect of retries on scm, we can consider checking the retries and delays settings.
 pritamstyz4ever
on 23 Sep 2020
pritamstyz4ever
on 23 Sep 2020
@wahapo v4.0.14 should be the one with the fixes in. Please help in verifying this.
jithine
on 24 Sep 2020
@jithine Thank you very much for your great work! I have other big work for today:sob:, so please wait until at least tomorrow:bow:
wahapo
on 24 Sep 2020
As far as I've checked a few things, the response is light and looks good. But I won't know if there will be a catastrophic failure until we deploy it in our production environment. I'll probably try in the next week or so.
The following is the response time to view the collection page.
Before:
[response,api,pipelines,metrics] http://localhost:9001: get /v4/pipelines/3/metrics {"count":20,"page":1,"sort":"descending"} 200 (140ms)
[response,api,pipelines,metrics] http://localhost:9001: get /v4/pipelines/1/metrics {"count":20,"page":1,"sort":"descending"} 200 (267ms)
[response,api,pipelines,metrics] http://localhost:9001: get /v4/pipelines/4/metrics {"count":20,"page":1,"sort":"descending"} 200 (339ms)
[response,api,pipelines,metrics] http://localhost:9001: get /v4/pipelines/5/metrics {"count":20,"page":1,"sort":"descending"} 200 (341ms)
After:
[response,api,pipelines,metrics] http://localhost:9001: get /v4/pipelines/3/metrics {"count":20,"page":1,"sort":"descending"} 200 (38ms)
[response,api,pipelines,metrics] http://localhost:9001: get /v4/pipelines/1/metrics {"count":20,"page":1,"sort":"descending"} 200 (87ms)
[response,api,pipelines,metrics] http://localhost:9001: get /v4/pipelines/4/metrics {"count":20,"page":1,"sort":"descending"} 200 (91ms)
[response,api,pipelines,metrics] http://localhost:9001: get /v4/pipelines/5/metrics {"count":20,"page":1,"sort":"descending"} 200 (94ms)
I found that the DB needed to be migrated and could not try in out production environment immediately. So, I need a little time again to update the DB.
https://github.com/screwdriver-cd/data-schema/pull/408/files#diff-e33e1bc5cd8e622af4a0785d63beed7aR108
wahapo
on 28 Sep 2020
We modified our deployment to do a canary release, right now 4.0.14 is serving 25 % production traffic. Will be using Prometheus data to monitor API latency and throughput, if all goes well, we will move canary to 100% traffic
jithine
on 1 Oct 2020
I deployed it in our production environment. The problem was completely solved. Thanks a lot.
wahapo
on 15 Oct 2020
Related issues
 catto
·
4Comments
catto
·
4Comments
 jweingarten
·
3Comments
jweingarten
·
3Comments
 yoshwata
·
5Comments
yoshwata
·
5Comments
 yokawara
·
5Comments
wahapo
·
7Comments
yokawara
·
5Comments
wahapo
·
7Comments
Most helpful comment
Profiling the SD api showed some hot functions that are taking a lot of the processing time. Validation in joi library is slow in general for all SD models.
These are the top 4 hits:
PR's are raised to fix 2 & 3. 1 is not something we can fix directly we should consider revisiting our overall schema and validation in general. 4 is basically an effect of retries on scm, we can consider checking the retries and delays settings.