Scikit-image: threshold_li changed from version 0.14.0 to version 0.14.1
Description
The code for threshold_li in filters/thresholding.py changed from version 0.14.0 to 0.14.1. The new method does not work at all for my images.
Example data (test.npy must be unzipped): test.zip
import matplotlib.pylab as plt
import numpy as np
from skimage.filters import threshold_li
image = np.load("test.npy")
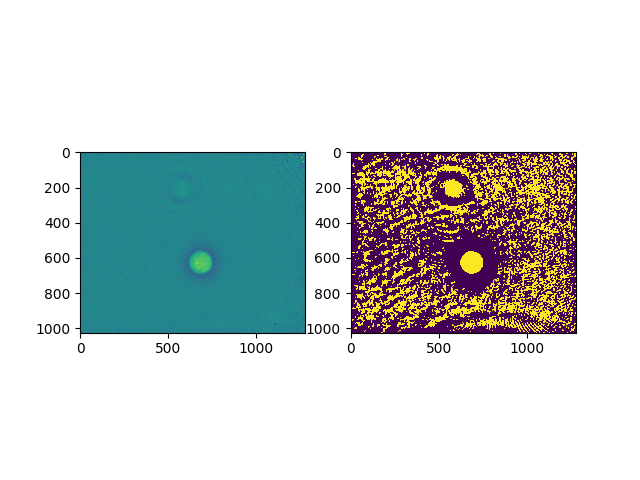
thresh = threshold_li(image)
ax1 = plt.subplot(121)
ax1.imshow(image)
ax2 = plt.subplot(122)
ax2 = plt.imshow(image > thresh)
plt.savefig("result.png")
Old code (0.14.0):
https://github.com/scikit-image/scikit-image/blob/v0.14.0/skimage/filters/thresholding.py#L519-L533

New code (0.14.1):
https://github.com/scikit-image/scikit-image/blob/v0.14.1/skimage/filters/thresholding.py#L594-L604
Not sure whether this change is intended. The while loop in the new code seems to be different. For one, the parameter threshold is not used there.
 paulmueller
All 39 comments
@jni This is something you changed in this commit... Do you remember? https://github.com/scikit-image/scikit-image/commit/f328085c6d2771fdffc13822b9c135cd089b1c00#diff-3d45990596f953f3e60ccfb305cf8924
 sciunto
on 18 Dec 2018
sciunto
on 18 Dec 2018
@sciunto @paulmueller yep, I changed this in https://github.com/scikit-image/scikit-image/pull/3402 and I remember it well, because I spent a long time reviewing the code and the original paper. Long story short: unless I am severely mistaken, our implementation of Li thresholding was incorrect before and it was just a coincidence that it gave good results for your use case.
How to test my hypothesis:
from skimage.filters.thresholding import _cross_entropy- try all possible threshold values and measure the cross entropy with
_cross_entropy(image, threshold). This is the measure thatthreshold_litries to minimise. - Check whether the returned value by
threshold_limatches the above-found threshold
More practically, maybe another thresholding method like threshold_otsu would work better on your image?
I intend to try all these things out later today myself but thought I'd get you started if you have time. Sorry about breaking your pipeline!
 jni
on 19 Dec 2018
jni
on 19 Dec 2018
Ach, I take it back! What's changed is something about our tolerance and how it interacts with this image.
Here is the cross-entropy vs threshold plot:
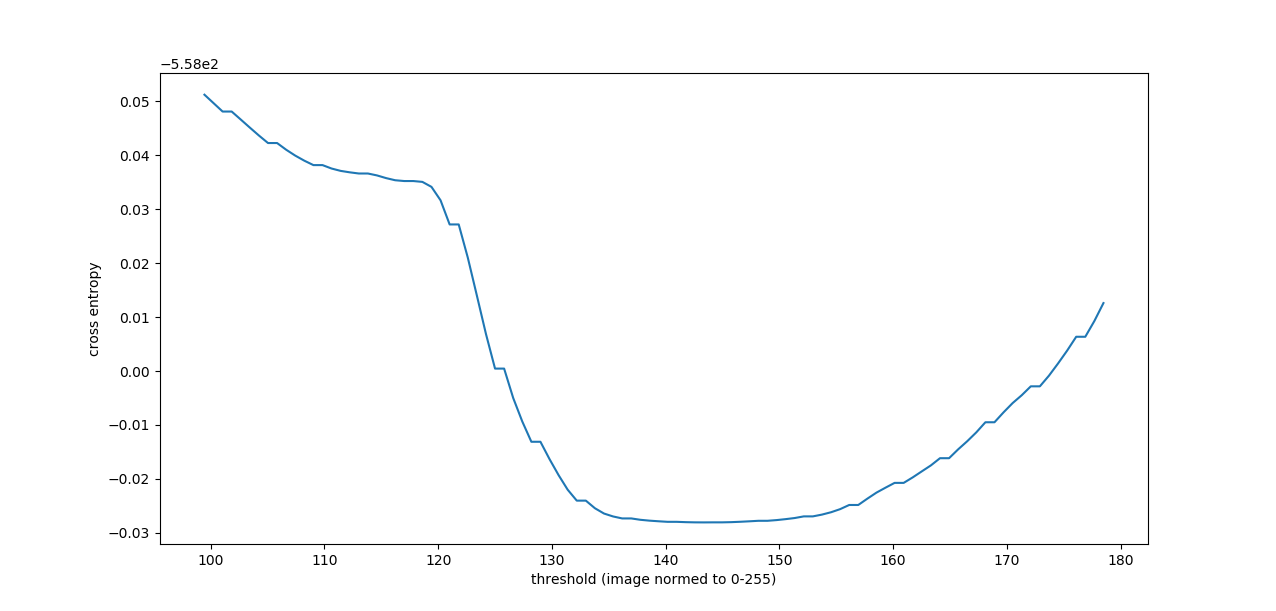
And here is what threshold_li finds:
In [38]: threshold_li(image)
Out[38]: 118.14975555282838
So it looks like the optimization iteration got stuck in that local minimum/low gradient region. Here's what happens when we decrease the tolerance:
In [39]: threshold_li(image, tolerance=0.0001)
Out[39]: 143.45882223438937
What I don't understand is why the default tolerance no longer works, because that condition hasn't changed, as far as I can tell. We didn't actually backport the tolerance keyword argument to 0.14.x so you can't try it out on that release. @paulmueller are you on Python 3.x or 2.7? If 3.x then this problem would be solved (for you at least) if we release 0.15.0. The next few days are a good candidate for this since hopefully we'll have some cool stuff merged after the ongoing Paris sprint.
Anyway, I'll keep investigating why there would be a difference to see whether we need to change the default tolerance value or something. Sorry again! And sorry for my earlier unwarranted confidence! Is there a humble pie emoji?
jni
on 19 Dec 2018
Ok so here is the old code:
vs the new code
Notice how in the old code, the threshold gets updated twice in the iteration: first, the threshold used inside the while loop is threshold + tolerance, rather than threshold. This pushes the threshold along in the positive direction. Then in the update, tolerance gets added to t_next again. So, in effect, in the old code, the iteration was massively biased towards moving in the increasing direction. This makes sense in many images because most of the image is dark/background, so the mean will be lower than the desired threshold, and the iteration will indeed "want" to move rightward. But it's not Li thresholding, it's something more akin to "biased accelerated Li thresholding".
Through trial and error (with binary search) I found that I could get away with 1/60th of the current default tolerance, which is 1/2 * 1/256 * im_range. So probably we should use something along those lines as the new default, maybe 1/128 * 1/256 * im_range?
jni
on 19 Dec 2018
@jni Thanks for your replies. I am on Python 3.6, so I will just stick to 0.14.0 for now.
paulmueller
on 19 Dec 2018
@paulmueller
these changes were not mentioned in the release notes
a very good point! Sorry about that, I don't know how or why I missed that PR when compiling the notes. I'll aim to fix that also.
@scikit-image/core any comments on changing the default tolerance?
jni
on 20 Dec 2018
My opinion: Keep the new version that sticks to the original implementation. Change the default tolerance (It's not problematic since we changed the implementation). Backport in 0.14.2. Add all this in the notes :)
sciunto
on 20 Dec 2018
On Wed, 19 Dec 2018 22:37:17 -0800, François Boulogne wrote:
My opinion: Keep the new version that sticks to the original
implementation. Change the default tolerance (It's not problematic
since we changed the implementation). Backport in 0.14.2. Add all this
in the notes :)
Changing public API in a point release is problematic. Even if we
consider this a bug-fix of sorts, I recommend a warning to the user.
 stefanv
on 20 Dec 2018
stefanv
on 20 Dec 2018
@stefanv the public API was not changed before and will not change now. The tolerance is an internal parameter.
jni
on 20 Dec 2018
But we are changing behavior. I.e., the same API call gives different results between 0.14.0 and 0.14.1.
stefanv
on 20 Dec 2018
Our policy has always been to do this silently when it was a bug fix. Running scikit-image would be a warning salad if we warned every time we changed some internal thing. It was definitely a mistake not to mention anything in the release notes, but other than that I think fixing an algorithm should be silent. And anyway, the goal of changing the tolerance now is for the behavior in 0.14.2 to match 0.14.0 (minus a 1/255 offset which again was buggy before).
jni
on 20 Dec 2018
If 0.14.2 will match 0.14.0, that sounds right.
stefanv
on 20 Dec 2018
@paulmueller could we have your permission to use your image in our documentation and testing? For this we would need it to be licensed as CC0 (public domain) or CC-BY (attribution) (@stefanv can you confirm that we could include CC-BY?).
jni
on 23 Dec 2018
@jni: CC0 is fine, use it!
paulmueller
on 23 Dec 2018
Awesome, thanks! What should we call it? data.beads()? =) If you have any additional information, e.g. the pixel spacing, that would be nice-to-have (obviously not essential).
jni
on 24 Dec 2018
It should be called data.cells() or data.cells_phase()/data.cells_qpi() (more accurate, "qpi" stands for quantitative phase imaging).
Though, I just realized that the data are preprocessed with another filter. I will dig out a better picture (also with more cells) that reproduces the bug and upload it here with a more detailed description.
paulmueller
on 24 Dec 2018
Here is the new dataset: cells_qpi_zipped.zip
Meta data (include as much as seems necessary):
This is a quantitative phase image retrieved from a digital hologram using the Python library qpformat. The data show two cells (left and right) with high phase values and an imaging artifact of the optical system (center) with phase values close to the background phase.

sample: HL60/S4 cells
medium: phosphate buffered saline (PBS, n=1.335)
imaging wavelength: 633nm
pixel size: 0.107µm
phase units: radians
imaging technique: digital holography
date of acquisition: 2015/10/29

context:
These data were part of a comparison between several refractive index retrieval
techniques for spherical objects as part of the publication (figure 5d):

  Paul Müller, Mirjam Schürmann, Salvatore Girardo, Gheorghe Cojoc,
  and Jochen Guck
  "Accurate evaluation of size and refractive index for spherical
  objects in quantitative phase imaging,"
  Optics Express 26(8): 10729-10743, 2018.
  doi:10.1364/OE.26.010729

license: CC0
These data are dedicated to the public domain. You can copy, modify,
or distribute them without asking permission.
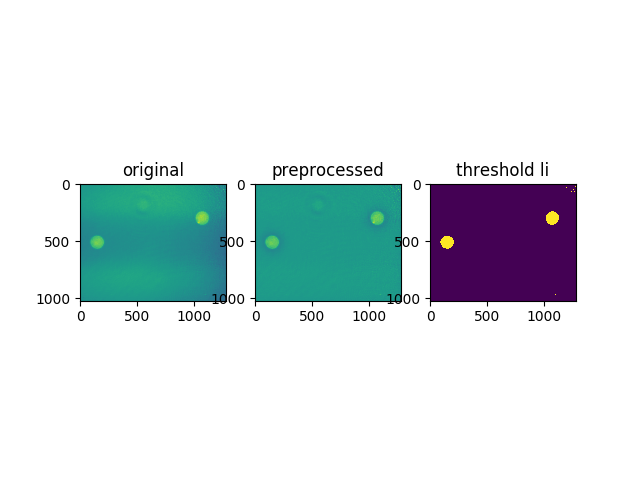
In order to test threshold_li, the data have to be preprocessed with threshold_local.
This breaks it down pretty much:
import matplotlib.pylab as plt
import numpy as np
from skimage.filters import threshold_li, threshold_local

# load original phase data
data = np.load("cells_qpi.npz")
phase = np.array(data["arr_0"], dtype=float)

# apply local threshold
locthr = threshold_local(phase, block_size=331)
phaset = phase - locthr

# reproduce li threshold
thresh = threshold_li(phaset)
assert thresh > 1  # I got 1.0479158553337644


plt.subplot(131, title="original")
plt.imshow(phase)

plt.subplot(132, title="preprocessed")
plt.imshow(phaset)


plt.subplot(133, title="threshold li")
plt.imshow(phaset > thresh)


plt.savefig("thresh.png")
plt.show()
paulmueller
on 27 Dec 2018
Thanks Paul! This is great!
jni
on 28 Dec 2018
@scikit-image/core how do we feel about adding this image (1.8MB) to our data? It's large, but imho this will be in for one release before we implement remote data. Or do we want to wait until remote data is implemented? If the latter, then I think #3622 should be merged before tests and a gallery example are implemented, because it is a regression bug fix, so I'd like it to be in the next release.
jni
on 18 Feb 2019
are we planning to just host data on github?
Files are currently at 20MB+. I feel like adding 2MB is not insignificant. Any way to compress the data? or to drop the resolution/quality. at least temporarily? PNG compression maybe?
 hmaarrfk
on 18 Feb 2019
hmaarrfk
on 18 Feb 2019
I would also prefer a more conservative approach to this especially if a long term solution would make this obsolete.
 lagru
on 18 Feb 2019
lagru
on 18 Feb 2019
@hmaarrfk I agree with you, which is why I stopped myself before adding the data. The data is already compressed. The problem is that the problem happens when you have a very different magnitude between the range of the data and the min diff between two values. So there's no simple way to test this.
But, I'll point out, in #3622 the current tests pass, the coverage is the same, and the issue is fixed, so I'm strongly in favour of merging that but keeping this issue open to add the regression test once the new data machinery is in place.
jni
on 18 Feb 2019
I'm going to reopen this as a reminder to add regression tests.
jni
on 4 Mar 2019
(Of course it'll need to be reopened again after #3781 but oh well.)
jni
on 4 Mar 2019
Just re-reviewed this issue and not sure why I was objecting originally; not an API change, so seems like all the correct steps were taken.
What happened to the data in the end? We should make sure that doesn't get lost.
stefanv
on 6 May 2019
@stefanv
Just re-reviewed this issue and not sure why I was objecting originally
I think you just love to contradict me, especially if it gives me more work to do. =P
What happened to the data in the end? We should make sure that doesn't get lost.
Agreed, that's why I kept this issue open. It should be fixed in 0.15.0 and the upcoming 0.14.3, but without a regression test, because I couldn't find a small enough test case. We can revisit when we add support for remote data, or we can work harder to get a tiny test case.
jni
on 6 May 2019
Probably more valuable to work hard on data and keep it easy for the test rather than working hard on both sides.
sciunto
on 11 May 2019
import matplotlib.pylab as plt
import numpy as np
from skimage.filters import threshold_li
from skimage import img_as_ubyte
import skimage
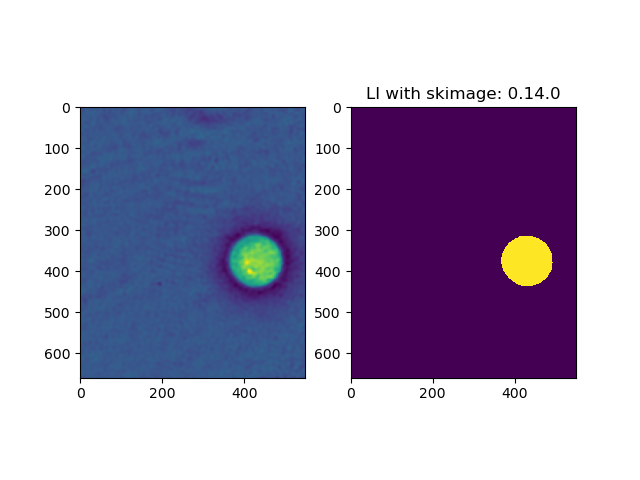
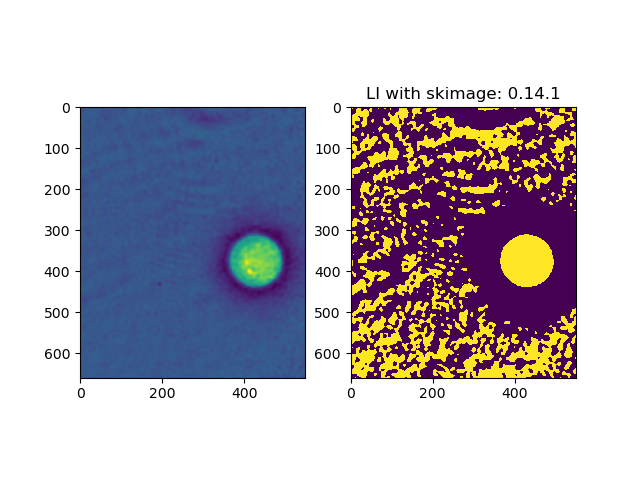
size = (660, 550)
origin = (250, 256)
image = np.load("test.npy")[origin[0]:(origin[0]+size[0]), origin[1]:(origin[1]+size[1])]
image = img_as_ubyte((image - image.min()) / (image.max() - image.min()))
thresh = threshold_li(image)
ax1 = plt.subplot(121)
ax1.imshow(image)
ax2 = plt.subplot(122)
ax2.imshow(image > thresh)
ax2.set_title(f'LI with skimage: {skimage.__version__}')
print(f"Size in memory: {image.size * image.dtype.itemsize / 1024 / 1024} MB")
plt.savefig(f"result_{skimage.__version__.replace('.', '_')}.png")
plt.show()
- Size in memory: 0.34618377685546875 MB
- Size on disk: 74kB (png).`
test_smaller.zip
hmaarrfk
on 11 May 2019
@hmaarrfk that's wonderful! If no one objects I'll submit this to our data dir and add a test for Li. I might even add a "developer example" with my gradient example from above.
jni
on 16 May 2019
Sounds good to me.
stefanv
on 16 May 2019
Great! +1.
sciunto
on 16 May 2019
I'll update the issue in the next few days with details, but I have to wrap up now and I wanted to ping people: @hmaarrfk has skillfully found an even more pathological crop of the original image, and it now fails even on master! :man_facepalming:
@paulmueller just to double check, on your original data, 0.15/master are working fine?
Here is the update in zulip: https://skimage.zulipchat.com/#narrow/stream/181448-development/topic/threshold_li/near/166074326
Fun times!
jni
on 20 May 2019
@jni For some reason I thought that this issue was resolved by 0.14.3, but I think it was only resolved for one example. 0.15.0 and master are already better than 0.14.3, but I still get false thresholds in some cases. I double-checked with 0.14.0 and everything works there.
paulmueller
on 20 May 2019
Ok, so here's a cute story about Li thresholding.
As expounded on above, Li thresholding is all about optimizing a function of the image and the threshold, called cross-entropy. In his '93 paper, Li simply proposes the measure as providing good thresholds. In the '98 paper, he describes a simple iteration rule that optimizes the function through gradient descent.
If you know anything about gradient descent, your ears are ringing. But wait, you say, how do we know that the function is convex!?
Indeed we don't, and @hmaarrfk found a cute example of an image having two minima for cross-entropy (unlike @paulmueller's original image, which had one minimum but a low gradient).
It gets better though: our starting point for optimization could start either in the basin of one minimum, or the other, right?
WRONG! Here's a plot of the cross-entropy (blue), the gradient update (red), the starting point for iteration, which is the mean intensity (vertical dashed line), and the zero gradient points (aka stationary points, horizontal dashed line):
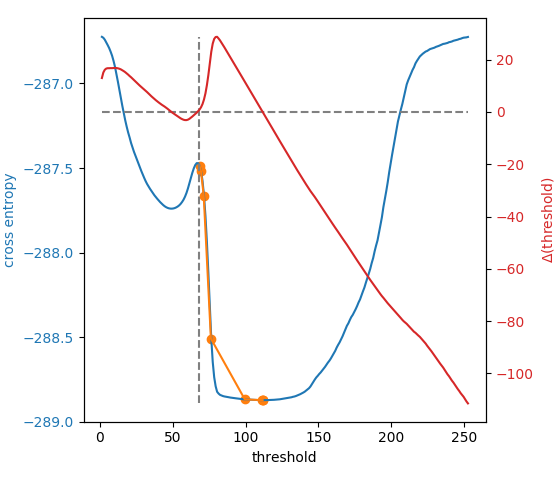
For @hmaarrfk's example image, we start right on the knife's edge between the two basins, and just sit there. :joy: :man_facepalming: :joy:
But wait, it gets even better! What is this optimization line (orange) you see?
It is an implementation detail that we start not at the mean intensity, but at the mean intensity plus two times the tolerance. With a tiny tolerance (as in 0.14.2+), this is equivalent to the mean, and we stay at the stationary point, enjoying the view from the top. With a large-ish tolerance (as in 0.14.1), we start on the right side of the peak, but the tolerance exceeds the gradient, and we stop at the first iteration. With an intermediate tolerance (0.25, in this case), we get a small kick to the right side of the peak and our updates are big enough to exceed the tolerance, so we tumble down to the optimum, as intended.
Fun times!
How to fix this? @hmaarrfk suggested allowing a start= keyword argument that determines the starting point. I think if that argument is smart enough, that could be the right solution. Here are some of the smarts I've considered, and am hereby requesting for opinions from @scikit-image/core as to which, if any, to implement, or other options altogether:
- start = float for a specific start point
- start = callable, that takes in the image intensities and returns a number (e.g. start at the median, or the average between min and max, or quantile 0.75)
- start = True to try several different start points, and pick the lowest
- start = True to try several different start points, and pick the lowest endpoint
- start = False (default) to stay with the mean.
Looking forward to your thoughts!
Whatever we implement, I would like to preserve the capacity to create this plot, as I think it will make a nice developer example for the gallery.
jni
on 22 May 2019
Thanks for writing this up @jni!
hmaarrfk
on 22 May 2019
I'd say add an x0 which, if None, means starting at various random positions and settles on the lowest result (options 1, 4). By default, x0 is None.
stefanv
on 4 Jun 2019
And maybe those positions shouldn't be random but calculated according to a known rule.
stefanv
on 4 Jun 2019
@stefanv thanks for chiming in!
(a) I think x0 is pretty jargony to people familiar with optimization. My suggestion for the keyword argument, thinking more about it, would be initial_guess=.
(b) In order to maintain the current behaviour (which should be the default), I need either 2 or 5. Possibly both. I like 2 because it is strictly more flexible, but I like 5 because it provides symmetry to 4 and obviously looks better as a default argument.
- An iterable of floats also makes sense. :man_facepalming:
I'll submit a PR and we can discuss there.
jni
on 4 Jun 2019
Sorry, I wasn't trying to suggest a parameter name. Initial guess sounds OK.
I suggest making it non-random if at all possible. The callable seems like too complicated a solution.
stefanv
on 4 Jun 2019
Related issues
hmaarrfk
·
36Comments
 carandraug
·
29Comments
carandraug
·
29Comments
 paugier
·
35Comments
jni
·
33Comments
paugier
·
35Comments
jni
·
33Comments
 ghost
·
37Comments
ghost
·
37Comments
Most helpful comment
Ok, so here's a cute story about Li thresholding.
As expounded on above, Li thresholding is all about optimizing a function of the image and the threshold, called cross-entropy. In his '93 paper, Li simply proposes the measure as providing good thresholds. In the '98 paper, he describes a simple iteration rule that optimizes the function through gradient descent.
If you know anything about gradient descent, your ears are ringing. But wait, you say, how do we know that the function is convex!?
Indeed we don't, and @hmaarrfk found a cute example of an image having two minima for cross-entropy (unlike @paulmueller's original image, which had one minimum but a low gradient).
It gets better though: our starting point for optimization could start either in the basin of one minimum, or the other, right?
WRONG! Here's a plot of the cross-entropy (blue), the gradient update (red), the starting point for iteration, which is the mean intensity (vertical dashed line), and the zero gradient points (aka stationary points, horizontal dashed line):
For @hmaarrfk's example image, we start right on the knife's edge between the two basins, and just sit there. :joy: :man_facepalming: :joy:
But wait, it gets even better! What is this optimization line (orange) you see?
It is an implementation detail that we start not at the mean intensity, but at the mean intensity plus two times the tolerance. With a tiny tolerance (as in 0.14.2+), this is equivalent to the mean, and we stay at the stationary point, enjoying the view from the top. With a large-ish tolerance (as in 0.14.1), we start on the right side of the peak, but the tolerance exceeds the gradient, and we stop at the first iteration. With an intermediate tolerance (0.25, in this case), we get a small kick to the right side of the peak and our updates are big enough to exceed the tolerance, so we tumble down to the optimum, as intended.
Fun times!
How to fix this? @hmaarrfk suggested allowing a
start=keyword argument that determines the starting point. I think if that argument is smart enough, that could be the right solution. Here are some of the smarts I've considered, and am hereby requesting for opinions from @scikit-image/core as to which, if any, to implement, or other options altogether:Looking forward to your thoughts!
Whatever we implement, I would like to preserve the capacity to create this plot, as I think it will make a nice developer example for the gallery.