Scanpy: Issue with repeated variables in rank_genes_groups_stacked_violin
Thanks for all the work in developing this package, it's truly fantastic.
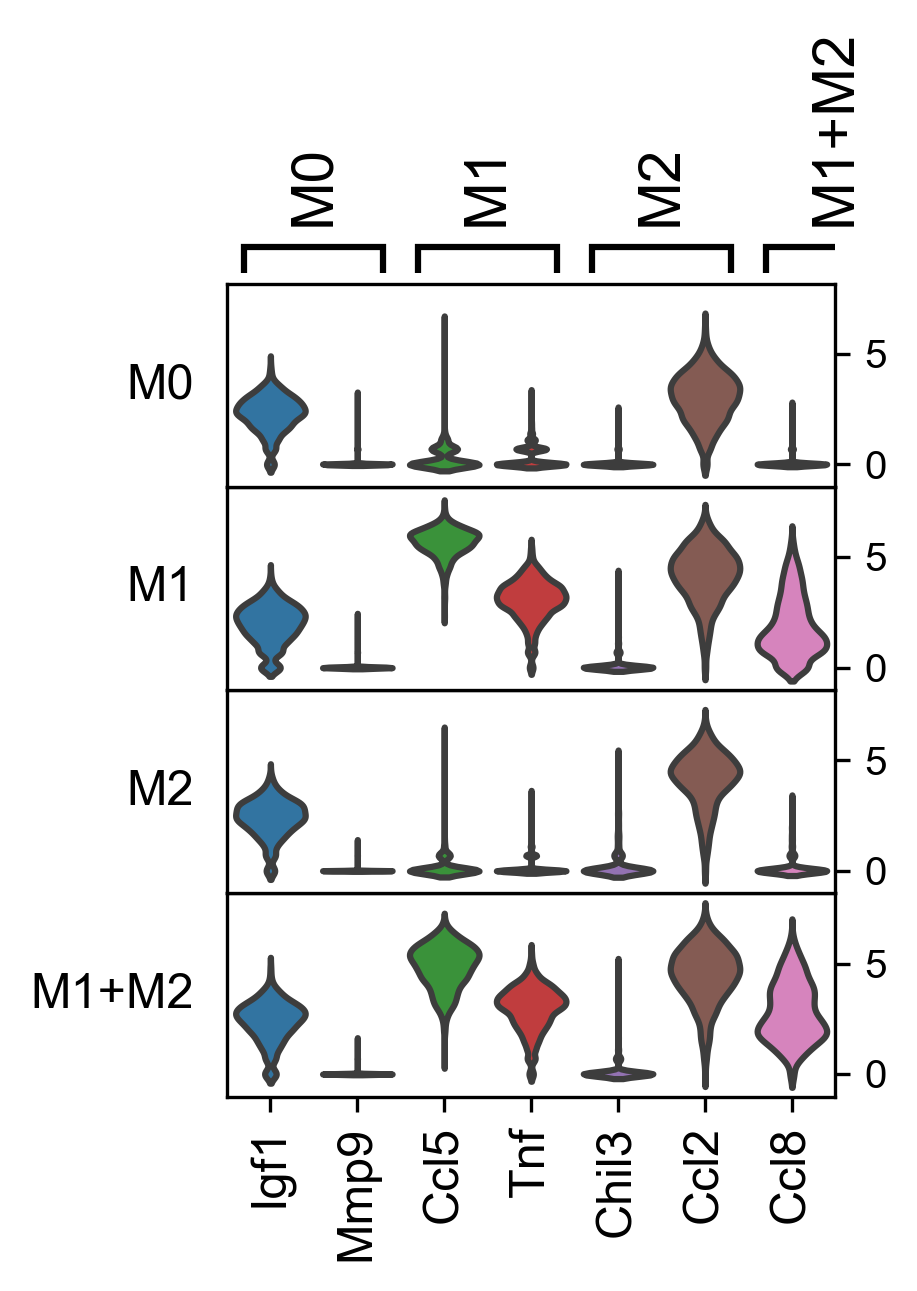
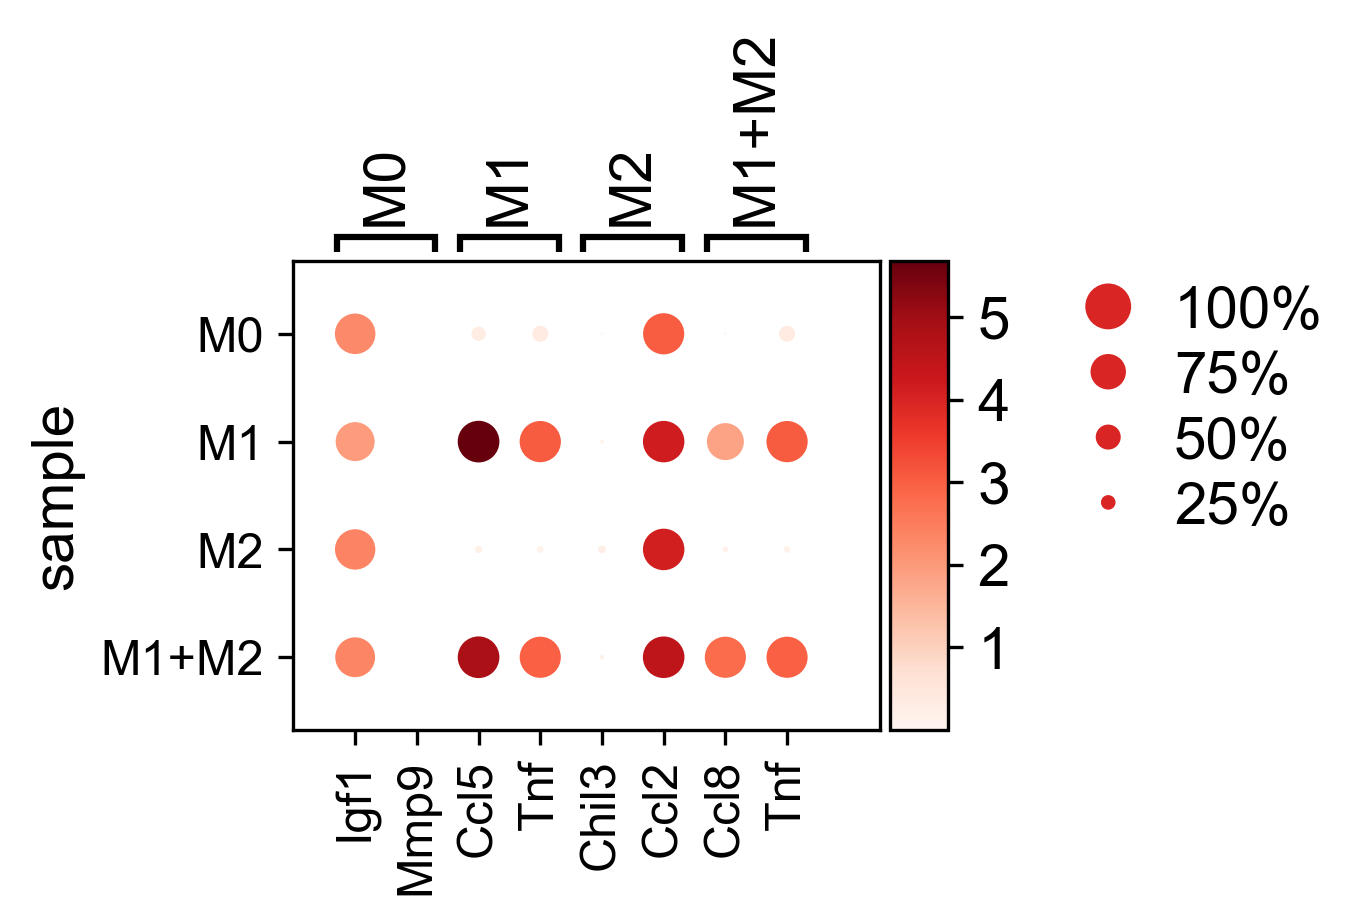
I ran into what seems like a bug in the new plotting function sc.pl.rank_genes_groups_stacked_violin. It seems that when the ranked genes between 2 groups are similar (e.g. 'Tnf' is a highly ranked gene between two groups), then 'Tnf' is only plotted once on the first group, and any following groups with the same gene are truncated. You can see this in the toy example image I attached - when comparing groups M1 and M1+M2, 'Tnf' should be plotted for each group, but it is only plotted on group M1, therefore truncating group M2. When I plot the same data using rank_genes_groups_dotplot, this error doesn't happen and 'Tnf' is correctly plotted twice.
I know this is a small bug that most people will probably not run across, but just in case you're comparing expression across similar groups this might be a useful fix. Thanks!
 a-munoz-rojas
All 6 comments
does the problem also happen in matrixplot or heatmap? seems to me like an
issue with the underlying seaborn violin plot.
On Fri, Aug 31, 2018 at 6:25 PM a-munoz-rojas notifications@github.com
wrote:
Thanks for all the work in developing this package, it's truly fantastic.
I ran into what seems like a bug in the new plotting function
sc.pl.rank_genes_groups_stacked_violin. It seems that when the ranked genes
between 2 groups are similar (e.g. 'Tnf' is a highly ranked gene between
two groups), then 'Tnf' is only plotted once on the first group, and any
following groups with the same gene are truncated. You can see this in the
toy example image I attached - when comparing groups M1 and M1+M2, 'Tnf'
should be plotted for each group, but it is only plotted on group M1,
therefore truncating group M2. When I plot the same data using
rank_genes_groups_dotplot, this error doesn't happen and 'Tnf' is correctly
plotted twice.I know this is a small bug that most people will probably not run across,
but just in case you're comparing expression across similar groups this
might be a useful fix. Thanks![image: stacked_violin_global]
https://user-images.githubusercontent.com/37122760/44924265-bd353000-ad18-11e8-84d0-a0136083dbdd.png[image: dotplot_global]
https://user-images.githubusercontent.com/37122760/44924244-aa226000-ad18-11e8-9351-4b28d11a7ee5.png—
You are receiving this because you are subscribed to this thread.
Reply to this email directly, view it on GitHub
https://github.com/theislab/scanpy/issues/252, or mute the thread
https://github.com/notifications/unsubscribe-auth/AEu_1Z1BA7WgQycvMb5E4fHkMuW1p1idks5uWWNxgaJpZM4WVgcM
.
 fidelram
on 1 Sep 2018
fidelram
on 1 Sep 2018
No, the problem also happens in the stacked violins. Matrix plot and heat map are both fine - you're right it's probably something with seaborn then.
a-munoz-rojas
on 1 Sep 2018
I will take a look
fidelram
on 3 Sep 2018
Thanks!
On Mon, Sep 3, 2018 at 3:55 AM Fidel Ramirez notifications@github.com
wrote:
I will take a look
—
You are receiving this because you authored the thread.
Reply to this email directly, view it on GitHub
https://github.com/theislab/scanpy/issues/252#issuecomment-418032207,
or mute the thread
https://github.com/notifications/unsubscribe-auth/AjZyyOz23rdOlRGyBCCMqB_uoeSfpdr4ks5uXOB8gaJpZM4WVgcM
.
--
Andrés Muñoz-Rojas, Ph.D.
Postdoctoral Associate
Department of Biomedical Engineering
Yale University
a-munoz-rojas
on 4 Sep 2018
I am also running into the same error. Thank you!
 apblair
on 16 Sep 2018
apblair
on 16 Sep 2018
This will be fixed as part of PR #244
fidelram
on 1 Oct 2018
Related issues
 MichaelPeibo
·
6Comments
MichaelPeibo
·
6Comments
 wflynny
·
6Comments
wflynny
·
6Comments
 picciama
·
4Comments
picciama
·
4Comments
 juugii
·
3Comments
juugii
·
3Comments
 sjfleming
·
3Comments
sjfleming
·
3Comments
Most helpful comment
I will take a look