Salt: EventPublisher consuming 4.6 GB memory
Hi,
in my setup i have 6k minions connected to a single master. The master is a 16GB RAM, built of a variant of CENTOS based OS.
I have a automated script to bring the minions up.The script brings provisions 200 minions in one cycle with an hour gap between each cycle until it provisions 6k minions.
In between this, we have some operations triggered on the minion like collecting some stats and installing some softwares.
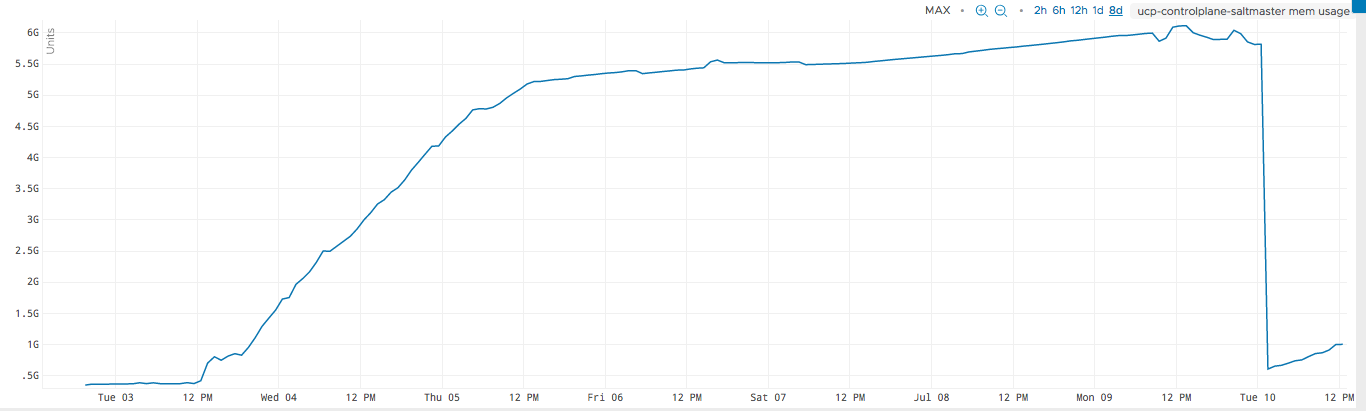
we are seeing that the memory slowly increases to about 5.8 GB and then stabilizes at that. At this point there are no events being posted on the event bus. Yet after 5-6 hrs salt does not seem to release the memory allocated.
Following this i restarted the salt master services. The memory consumption came down to 500 MB and stabilized at 900MB ~ 1GB.
I have attached here a snapshot of the memory profile of salt master process.
doing a strace on the eventpublisher process which was consuming 4.6GB of memory before, i only see epoll_wait and not other processing.
Salt Version:
Salt: 2017.7.2
Dependency Versions:
cffi: 1.9.1
cherrypy: Not Installed
dateutil: Not Installed
docker-py: Not Installed
gitdb: Not Installed
gitpython: Not Installed
ioflo: Not Installed
Jinja2: 2.9.5
libgit2: Not Installed
libnacl: Not Installed
M2Crypto: Not Installed
Mako: Not Installed
msgpack-pure: Not Installed
msgpack-python: 0.4.8
mysql-python: Not Installed
pycparser: 2.17
pycrypto: 2.6.1
pycryptodome: Not Installed
pygit2: Not Installed
Python: 2.7.13 (default, Apr 18 2018, 12:23:00)
python-gnupg: Not Installed
PyYAML: 3.12
PyZMQ: 16.0.2
RAET: Not Installed
smmap: Not Installed
timelib: Not Installed
Tornado: 4.5.2
ZMQ: 4.1.4
System Versions:
dist:
locale: ANSI_X3.4-1968
machine: x86_64
release: 4.4.130-2.ph1
system: Linux
version: Not Installed
 jvrahav
All 29 comments
ping @DmitryKuzmenko any ideas here?
also @jvrahav can you share a sanitized version of your master/minion config?
 Ch3LL
on 10 Jul 2018
Ch3LL
on 10 Jul 2018
Master Config
keep_jobs: 1
job_cache: False
external_auth:
pam:
admin:
- '@wheel'
- '@runner'
- '@jobs'
- .*
rest_tornado:
port: 8553
ssl_crt: /etc/pki/tls/certs/localhost.crt
ssl_key: /etc/pki/tls/certs/localhost.key
webhook_url: /hook
websockets: True
disable_ssl: False
debug: False
log_level_logfile: error
max_open_files: 100000
salt_event_pub_hwm: 128000
event_publisher_pub_hwm: 64000
loop_interval: 600
jvrahav
on 11 Jul 2018
Minion config
master: salt
random_reauth_delay: 180
recon_default: 10000
recon_max: 170000
jvrahav
on 11 Jul 2018
@Ch3LL let me know if the above posted configs are sufficient for analysis
jvrahav
on 13 Jul 2018
i tried kill -10
======== Salt Debug Stack Trace =========
  File "/usr/bin/salt-master", line 22, in <module>
    salt_master()
  File "/usr/lib/python2.7/site-packages/salt/scripts.py", line 92, in salt_mastt
er
    master.start()
  File "/usr/lib/python2.7/site-packages/salt/cli/daemons.py", line 208, in starr
t
    self.master.start()
  File "/usr/lib/python2.7/site-packages/salt/master.py", line 554, in start
    chan.pre_fork(self.process_manager)
  File "/usr/lib/python2.7/site-packages/salt/transport/zeromq.py", line 802, inn
 pre_fork
    process_manager.add_process(self._publish_daemon)
  File "/usr/lib/python2.7/site-packages/salt/utils/process.py", line 335, in add
d_process
    process.start()
  File "/usr/lib/python2.7/multiprocessing/process.py", line 130, in start
    self._popen = Popen(self)
  File "/usr/lib/python2.7/multiprocessing/forking.py", line 126, in __init__
    code = process_obj._bootstrap()
  File "/usr/lib/python2.7/multiprocessing/process.py", line 258, in _bootstrap
    self.run()
@Ch3LL Further to this, when the memory was slowly increasing i ran a command on the master to get a list of jobs that are executed. After this call the memory went up by 700 MB and stayed there even after the execution.
jvrahav
on 15 Jul 2018
@jvrahav how do you trigger that operations on minions? Do you use cmdline or rest_tornado?
 DmitryKuzmenko
on 16 Jul 2018
DmitryKuzmenko
on 16 Jul 2018
@DmitryKuzmenko I used command line for this test. For the previous tests i used tornado.
This is the latest memory consumption per process as per "ps auxf"
root        18  0.0  0.1 279088 18444 ?        S    Jul10   0:09 /bin/python /usr/bin/salt-master -d ProcessManager
root        19  0.0  0.0 275876 13084 ?        S    Jul10   0:00  \_ /bin/python /usr/bin/salt-master -d MultiprocessingLoggingQueue
root        21  0.0 16.1 4262964 2656092 ?     Sl   Jul10   3:48  \_ /bin/python /usr/bin/salt-master -d ZeroMQPubServerChannel
root        22  0.0  7.9 1568896 1305992 ?     S    Jul10   0:32  \_ /bin/python /usr/bin/salt-master -d EventPublisher
root        25  0.2  0.4 1103100 66880 ?       Sl   Jul10  21:52  \_ /bin/python /usr/bin/salt-master -d Reactor
root        27  0.0  0.3 302408 61424 ?        S    Jul10   2:00  \_ /bin/python /usr/bin/salt-master -d Maintenance
root        28  0.0  0.1 279088 19036 ?        S    Jul10   0:09  \_ /bin/python /usr/bin/salt-master -d ReqServer_ProcessManager
root        29  0.0  0.6 582212 100124 ?       Sl   Jul10   0:27      \_ /bin/python /usr/bin/salt-master -d MWorkerQueue
root        30  0.0  0.3 458364 53552 ?        Sl   Jul10   1:09      \_ /bin/python /usr/bin/salt-master -d MWorker-0
root        37  0.0  0.3 460952 55096 ?        Sl   Jul10   1:08      \_ /bin/python /usr/bin/salt-master -d MWorker-1
root        38  0.0  0.4 460324 66284 ?        Sl   Jul10   1:10      \_ /bin/python /usr/bin/salt-master -d MWorker-2
root        39  0.0  0.3 459800 65076 ?        Sl   Jul10   1:10      \_ /bin/python /usr/bin/salt-master -d MWorker-3
root        40  0.0  0.3 459080 65108 ?        Sl   Jul10   1:08      \_ /bin/python /usr/bin/salt-master -d MWorker-4
Anyone have any suggestions here on what can be done to manage salt memory
jvrahav
on 18 Jul 2018
@jvrahav sorry for late response. There is an issue related to how ZeroMQ publisher works: if a client is subscribed and don't read the messages the server side publisher keeps that messages in memory. Probably this is the issue you're seeing.
We had memory issues related to this in the past but now all known issues are resolved. So this is why I'm asking how do you contact master to trigger operations.
Can you please share the sanitized script or the command-line sequence that reproduces the memory issue?
DmitryKuzmenko
on 18 Jul 2018
@DmitryKuzmenko , thanks for the reply.
Can you please let me know the version in which the memory issue you are referring to was fixed.
Unfortunately, i dont have the script with me at the moment. But the script itself does this
- install salt minion in the endpoint
- Once the minion connects to the master, reactor kicks in to apply a state on the endpoint
- At this point there is a rise in salt master memory usage
- After a cool off period, apply a state file on the endpoint sequentially.
- At this point, there is a rise in salt master memory. After a cool off period, it relents about 300 MB memory on the master
- Run any command for instance list of jobs on the master
- At this point, the memory on master increases
- When master is left idle after previous step, the memory is stable and does not reduce even after couple of hours.
jvrahav
on 18 Jul 2018
@jvrahav I've wrote about this PRs:
https://github.com/saltstack/salt/pull/36024
https://github.com/saltstack/salt/pull/36720
I don't try to say your issue is the same. It's just an assumption. It could be if you use LocalClient or SaltEvent in a wrong manner. For instance probably you create LocalClient, send a command, read an event (here client subscribes to events) and don't read events anymore and don't destroy the client.
But probably problem is somewhere else. If you'd be so kind to try to figure out a minimal reproduction procedure I'd investigate it deeper.
DmitryKuzmenko
on 19 Jul 2018
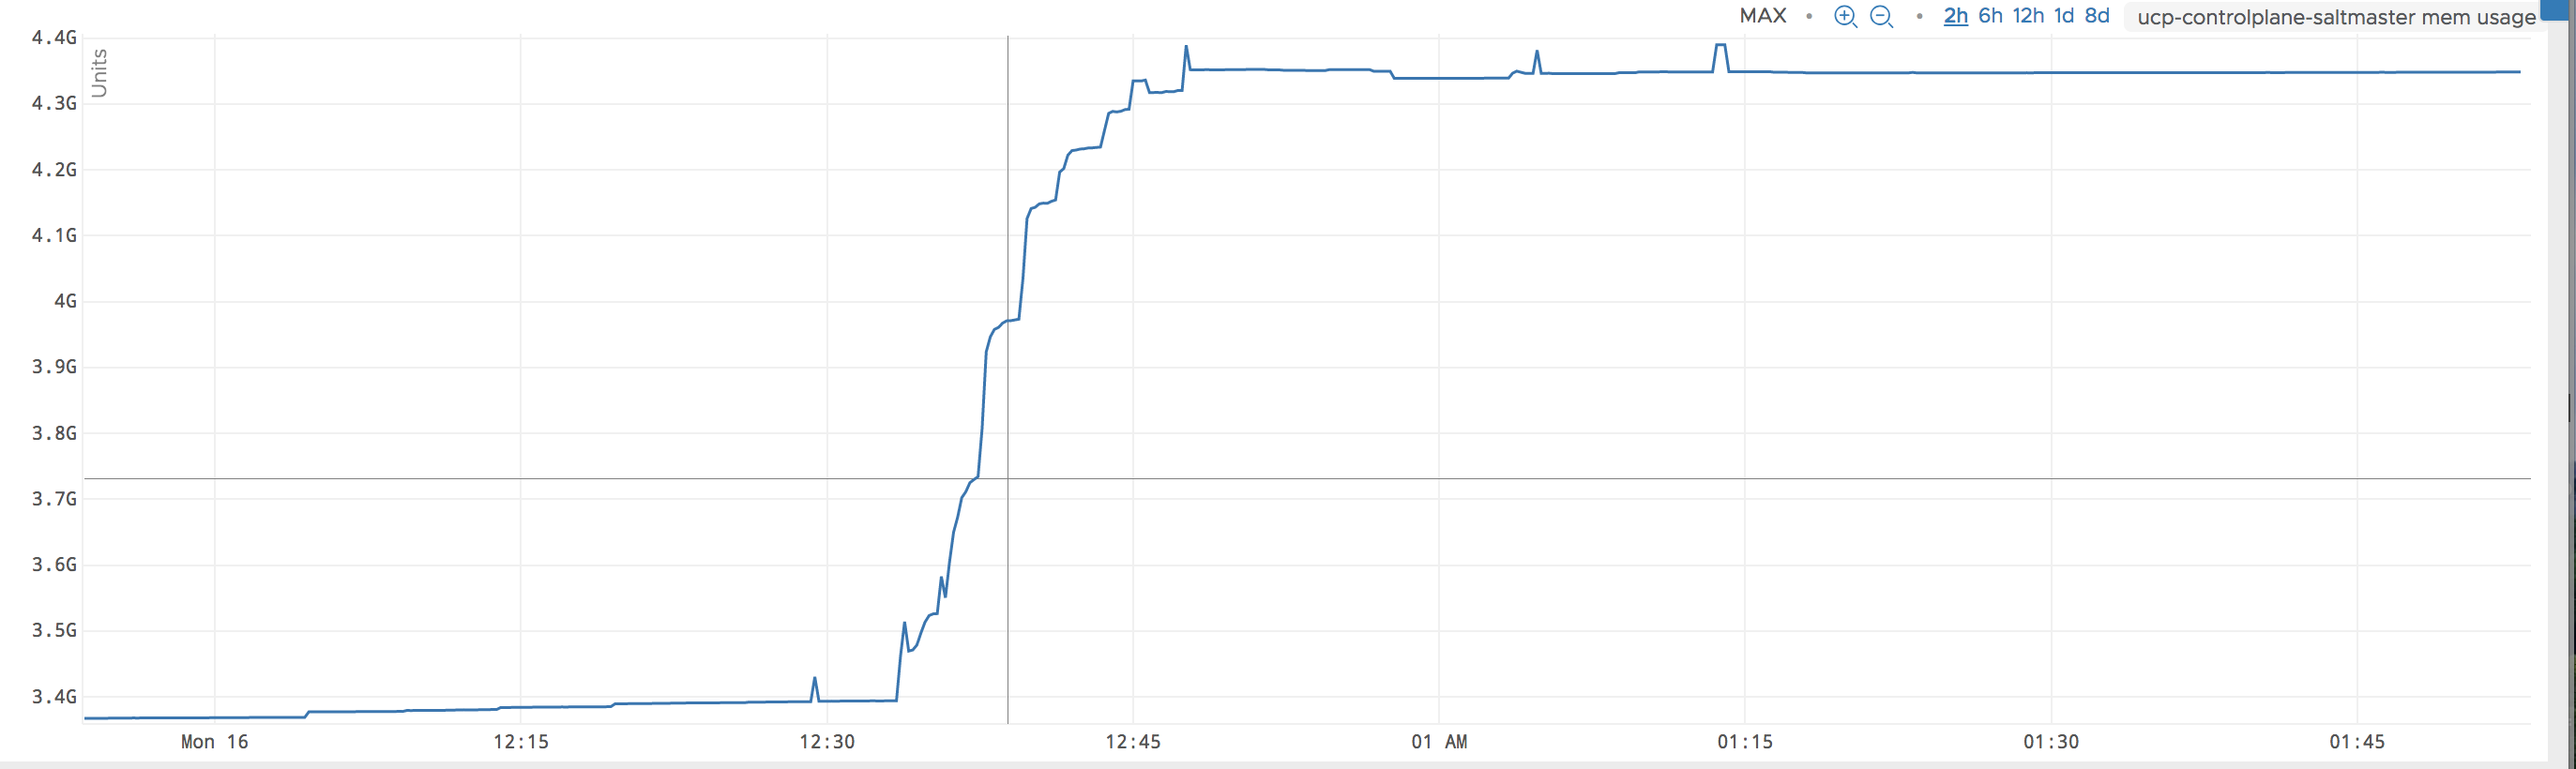
@DmitryKuzmenko
the procedure is
- start salt master with the settings mentioned above in this conversation
- start the minions on the vms - 5000 t0 6000. All minions are using the configuration specified above in this thread
- notice the master memory shooting up.
- after some time invoke sls operations via salt-api based out of tornado
- After this eventpublisher memory shoots up to to 5.5 GB.
jvrahav
on 30 Jul 2018
Thank you for descriptions. I can take this and try to reproduce and analyze the issue. But I can't start work on it now. It would be later, closer to the end of Aug.
@rallytime does that sound good?
DmitryKuzmenko
on 30 Jul 2018
@DmitryKuzmenko Yeah, that sounds good. Thanks!
 rallytime
on 30 Jul 2018
rallytime
on 30 Jul 2018
Thanks Andreas, I will try it out
On Sat, Oct 20, 2018 at 1:32 AM Andreas Tsaridas notifications@github.com
wrote:
the memory leak exists in msgpack library version.
https://github.com/msgpack/msgpack-python/blob/0.4.8/msgpack/fallback.py#L238
The specific version does not clear buffer and by default the buffer is
unlimited.Upgrading to the latest version of msgpack should help.
—
You are receiving this because you were mentioned.
Reply to this email directly, view it on GitHub
https://github.com/saltstack/salt/issues/48498#issuecomment-431482681,
or mute the thread
https://github.com/notifications/unsubscribe-auth/AaiaeOtKPYa2WQr8tbncwMCgbS_cCKW8ks5umi_IgaJpZM4VI6tO
.
jvrahav
on 22 Oct 2018
@jvrahav
I deleted the previous comment because it needs more investigation.
https://github.com/msgpack/msgpack-python/issues/283
https://github.com/saltstack/salt/blob/develop/salt/transport/ipc.py#L171
To my understanding its normal that python does not release memory and as long as there is free memory the OS will always try to give it more. This should not be a problem as long as the OS does not swap. I tested trying to allocate some memory with another process and the OS did release memory from the EventListener.
Saying that, you should have no problem even if memory goes high and let the OS deal with it in case it needs more.
An easy way to test this is to run the master in a server with low memory (512MB) and you will notice that EventListener memory does decrease by itself.
The only way I was able to make EventPublisher not increase memory is by adding a buffer (max_buffer_size=32000) to the Unpacker (latest msgpack) and doing garbage collection in an interval with periodCallback. The buffer size is tested with a low load and I'm not sure how much it should be increased for higher loads. Having a buffer can have negative impacts though. Messages might get lost of buffer is full. I'm not even sure if a buffer is needed since I imagine messages are never the same.
I was worried myself when I saw high memory usage on EventListener but until now I haven't seen any negative effects.
Another way to have python automatically do the garbage collection for the unpacker would be to create a new one inside the loop and delete the object at the end.
        while not stream.closed():
            try:
                wire_bytes = yield stream.read_bytes(4096, partial=True)
                self.add_callback(wire_bytes, encoding, stream)
            except tornado.iostream.StreamClosedError:
                log.trace('Client disconnected from IPC %s', self.socket_path)
                break
            except socket.error as exc:
                # On occasion an exception will occur with
                # an error code of 0, it's a spurious exception.
                if exc.errno == 0:
                    log.trace('Exception occured with error number 0, '
                              'spurious exception: %s', exc)
                else:
                    log.error('Exception occurred while '
                              'handling stream: %s', exc)
            except Exception as exc:
                log.error('Exception occurred while '
                          'handling stream: %s', exc)

    def add_callback(self, wire_bytes, encoding, stream):

        @tornado.gen.coroutine
        def _null(msg):
            raise tornado.gen.Return(None)

        def write_callback(stream, header):
            if header.get('mid'):
                @tornado.gen.coroutine
                def return_message(msg):
                    pack = salt.transport.frame.frame_msg_ipc(
                        msg,
                        header={'mid': header['mid']},
                        raw_body=True,
                    )
                    yield stream.write(pack)
                return return_message
            else:
                return _null

        unpacker = msgpack.Unpacker(encoding=encoding)
        unpacker.feed(wire_bytes)
        for framed_msg in unpacker:
            body = framed_msg['body']
            self.io_loop.spawn_callback(self.payload_handler, body, write_callback(stream, framed_msg['head']))
The above solution would work with lower versions of msgpack too but I noticed performance issues.
The unpacker is used the same way in other parts of the saltstack code so if changed lower memory footprints should be noticed.
I am not from SaltStack team though so I would suggest @DmitryKuzmenko takes a look at this.
 tsaridas
on 22 Oct 2018
tsaridas
on 22 Oct 2018
@jvrahav
I deleted the previous comment because it needs more investigation.https://github.com/saltstack/salt/blob/develop/salt/transport/ipc.py#L171
To my understanding its normal that python does not release memory and as long as there is free memory the OS will always try to give it more. This should not be a problem as long as the OS does not swap. I tested trying to allocate some memory with another process and the OS did release memory from the EventListener.
Saying that, you should have no problem even if memory goes high and let the OS deal with it in case it needs more.
An easy way to test this is to run the master in a server with low memory (512MB) and you will notice that EventListener memory does decrease by itself.
The only way I was able to make EventPublisher not increase memory is by adding a buffer (max_buffer_size=32000) to the Unpacker (latest msgpack) and doing garbage collection in an interval with periodCallback. The buffer size is tested with a low load and I'm not sure how much it should be increased for higher loads. Having a buffer can have negative impacts though. Messages might get lost of buffer is full. I'm not even sure if a buffer is needed since I imagine messages are never the same.
I was worried myself when I saw high memory usage on EventListener but until now I haven't seen any negative effects.
Another way to have python automatically do the garbage collection for the unpacker would be to create a new one inside the loop and delete the object at the end.
        while not stream.closed():
            unpacker = msgpack.Unpacker(encoding=encoding)
            try:
                wire_bytes = yield stream.read_bytes(4096, partial=True)
                unpacker.feed(wire_bytes)
                for framed_msg in unpacker:
                    body = framed_msg['body']
                    self.io_loop.spawn_callback(self.payload_handler, body, write_callback(stream, framed_msg['head']))
            except tornado.iostream.StreamClosedError:
                log.trace('Client disconnected from IPC %s', self.socket_path)
                break
            except socket.error as exc:
                # On occasion an exception will occur with
                # an error code of 0, it's a spurious exception.
                if exc.errno == 0:
                    log.trace('Exception occured with error number 0, spurious exception: %s', exc)
                else:
                    log.error('Exception occurred while handling stream: %s', exc)
            except Exception as exc:
                log.error('Exception occurred while handling stream: %s', exc)
            del unpacker
The above solution would work with lower versions of msgpack too but I noticed performance issues.
The unpacker is used the same way in other parts of the saltstack code so if changed lower memory footprints should be noticed.I am not from SaltStack team though so I would suggest @DmitryKuzmenko takes a look at this.
Thanks @tsaridas for your inputs. For now i have limited resource to salt master and that seems to do the trick with consuming less memory. However i would like to hear from @DmitryKuzmenko as well on your findings.
jvrahav
on 24 Oct 2018
Hi
Please note that minion responses larger than max_buffer_size will cause exception there and in the other approach (creating a new Unpacker inside the while loop) any response larger than 4096 bytes will not work (which is obvious from looking at this code), so this may not be the best solution.
I scrutinised msgpack source and can't really understand why it leaks memory with no buffer set, meaning the Cython version will default to the maximum buffer of INT_MAX.
When the code above is switched to use msgpack.fallback.Unpacker (without any max_buffer_size) it uses very little memory at the cost of being slightly (~10% in my tests) slower.
 szjur
on 24 Oct 2018
szjur
on 24 Oct 2018
@szjur I'll look at that right when I'll have more time.
DmitryKuzmenko
on 25 Oct 2018
@DmitryKuzmenko it actually seems that the main reason of leaks are forgotten event consumers (https://github.com/saltstack/salt/issues/34215). It is easy to overlook this when you have a client with a dedicated event listener but then also use the LocalClient to start some async jobs.
msgpack using Cython code does seem to have some tiny leak or otherwise under very heavy testing that process slowly grows to at least 230+ MB. I've just done 800 iterations of a massive test running jobs on 1650 minions with 16k response and with msgpack.fallback.Unpacker the memory usage hovers around 45 MB at the tradeoff of using a bit more CPU.
szjur
on 25 Oct 2018
This issue has been automatically marked as stale because it has not had recent activity. It will be closed if no further activity occurs. Thank you for your contributions.
If this issue is closed prematurely, please leave a comment and we will gladly reopen the issue.
![stale[bot] picture](https://avatars.githubusercontent.com/in/1724?v=4&s=40) stale[bot]
on 9 Jan 2020
stale[bot]
on 9 Jan 2020
Bump
On 9 Jan 2020, at 15:56, stale[bot] notifications@github.com wrote:
This issue has been automatically marked as stale because it has not had recent activity. It will be closed if no further activity occurs. Thank you for your contributions.If this issue is closed prematurely, please leave a comment and we will gladly reopen the issue.
—
You are receiving this because you are subscribed to this thread.
Reply to this email directly, view it on GitHub, or unsubscribe.
 simmel
on 11 Jan 2020
simmel
on 11 Jan 2020
Thank you for updating this issue. It is no longer marked as stale.
stale[bot]
on 11 Jan 2020
This issue has been automatically marked as stale because it has not had recent activity. It will be closed if no further activity occurs. Thank you for your contributions.
If this issue is closed prematurely, please leave a comment and we will gladly reopen the issue.
stale[bot]
on 10 Feb 2020
Wow, every month huh?
On Mon, 2020-02-10 at 04:38:40 -0800, stale[bot] wrote:
This issue has been automatically marked as stale because it has not had recent activity. It will be closed if no further activity occurs. Thank you for your contributions.
If this issue is closed prematurely, please leave a comment and we will gladly reopen the issue.
--
You are receiving this because you are subscribed to this thread.
Reply to this email directly or view it on GitHub:
https://github.com/saltstack/salt/issues/48498#issuecomment-584102803
simmel
on 10 Feb 2020
Thank you for updating this issue. It is no longer marked as stale.
stale[bot]
on 10 Feb 2020
ping @simmel this should not go stale again, let me know otherwise
ping @DmitryKuzmenko any update here?
Ch3LL
on 13 Feb 2020
@Ch3LL unfortunately not. It's in my todos
DmitryKuzmenko
on 17 Feb 2020
Related issues
 layer3switch
·
3Comments
layer3switch
·
3Comments
 sagetherage
·
3Comments
sagetherage
·
3Comments
 Arguros
·
3Comments
Arguros
·
3Comments
 zieba88
·
3Comments
zieba88
·
3Comments
 Oloremo
·
3Comments
Oloremo
·
3Comments