Salesforcedx-vscode: Apex extension High CPU Load
Summary
Every time I open VS Code, CPU usage goes to 100%. Starts normally but as each second pasts Zulu proccess is raising the percentage of cpu use. I figured out that it happens because of the apex extension. It started after clicking some vs code communicate that appeared in bottom right corner. I think it was something with sObjects. There was button "enable" and after that it's working like this. I can end task in manager which stops the problem but then I'm not able to run tests (option is missing) from vs code. I tried to wait for the proccess to finish but it seems nothing else happens.
Steps To Reproduce:
- Open VS code
- Wait for CPU to run high
Expected result
Works fine, cpu usage is normal, you can run tests after some time
Actual result
cpu usage is 100%, you cannot run tests when ending proccess or waiting like 20 minutes.
Additional information
_Feel free to attach a screenshot_.


VS Code Version:
1.47.3
SFDX CLI Version:
APEX 49.4.0 also checked on 49.2.0 but same reason
OS and version:
windows 10 education 1909
 ReviverAce
All 17 comments
I am also experiencing super high CPU usage. I can vouch for this bug. I'm posting here as well as the previous issue I commented on was closed.

_Originally posted by @johnpanos in https://github.com/forcedotcom/salesforcedx-vscode/issues/968#issuecomment-671737141_
 johnpanos
on 11 Aug 2020
johnpanos
on 11 Aug 2020
@johnpanos I've been dealing with this Java issue too. At first I disabled the Apex Language Server extension, which fixes the issue, but then you don't have any syntax highlighting and let's face it, we all need that.
So whenever I start VS Code or change workspaces (which is rare now because of this issue), I kill the Java process. It restarts, but if you kill it five times in less than three minutes, it won't restart. Then you'll have your syntax highlighting and your processing power, but you'll sacrifice other features like clicking the Run Test button to run tests directly from the code.
FAR FAR from ideal, but it's getting me through.
 romnus
on 19 Aug 2020
romnus
on 19 Aug 2020
Hi Everyone - Thanks for raising this. As to the original issue, it sounds like you chose to run the SFDX: Refresh SObject Definitions command. We have a new prompt to help surface this option as many users weren't away and missing out on code completion goodness. When you refresh SObject definitions, the extension uses the default org to generate Apex classes. These classes represent the standard and custom objects that the current user has access to. This gives you the best code completion for Apex. However, it can take awhile for large orgs or large projects. Can you share more details about the size of each in your case?
You can also hit issues if language server process is not assigned enough memory by the Java JVM. By default, Java would assign up to one quarter of the machine's physical memory (RAM). To see if this is what's causing the issue, you can use the salesforcedx-vscode-apex.java.memory setting to assign more memory to the process. Here's the documentation on how that setting works.
 smaddox-sf
on 24 Aug 2020
smaddox-sf
on 24 Aug 2020
Thanks for the reply! I have 296 classes, and very little custom objects, 203 to be exact. I think my org is fairly tiny when compared to others.
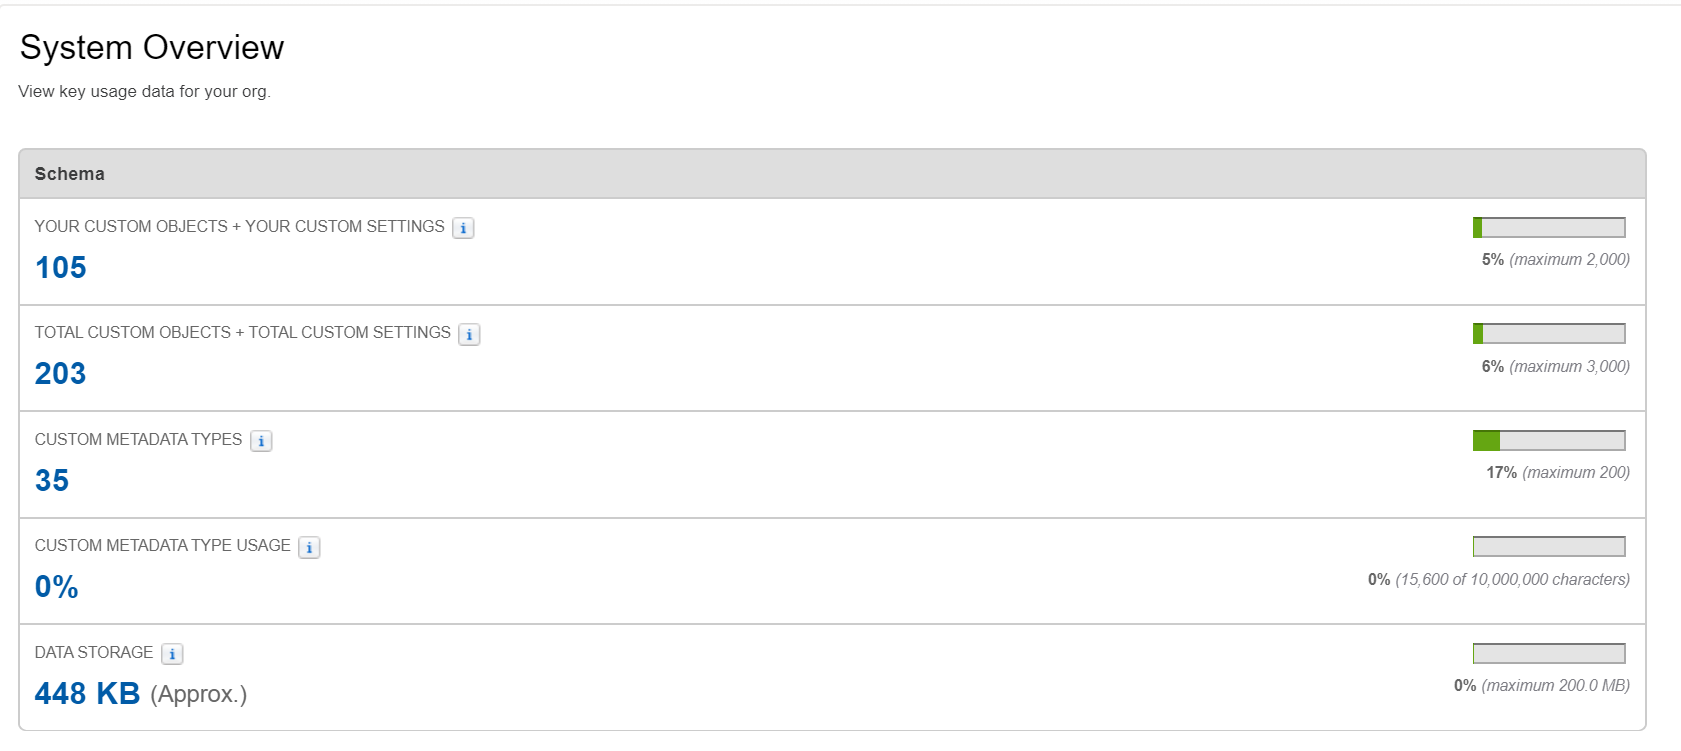
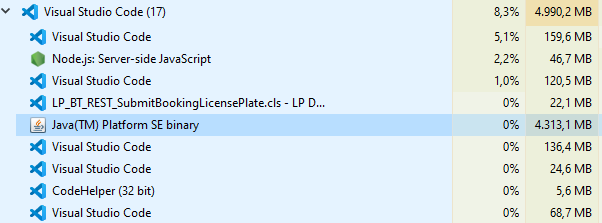
Also the JVM already takes up 13.2% of RAM (on a good day) out of my total 32gb. That means it's using ~4gb of RAM for 448kb of objects and ~2960kb of classes (which is all that was reserved for it, you can verify on the RES tab in top). Also check out the virt tab, why does it use 13gb of virtual memory? What files does it have open that are that huge? To me that's kind of insane.

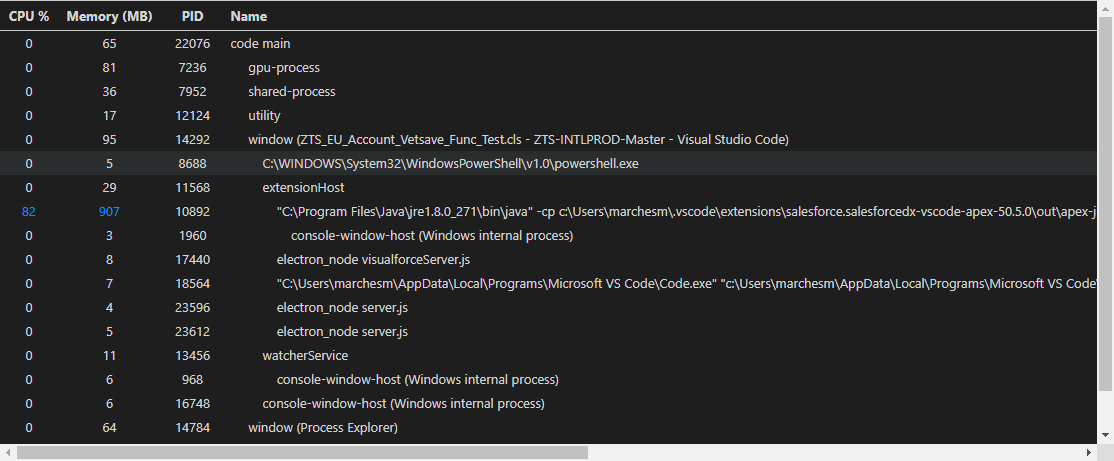
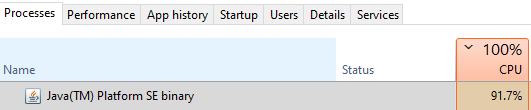
Let me know if you need me to provide any more information. The memory isn't that much of a problem, it's just the CPU usage as it makes my fans crank even when they don't really need to. This is annoying because I can literally do arguably more complicated development on this system without the fans turning on (Android dev with emulator).
Edit: I know that screenshot shows 0% CPU usage, but that's only if I'm not typing anything for a while, once I type something and the auto completion tries to kick in, the CPU get's pegged to 100%, which is pretty much the whole time because I'm programming.
johnpanos
on 24 Aug 2020
@smaddox-sf Yes, thank you for following up. The org I have this issue with is very large; its SFDX project is almost 1gb. I don't have this issue with another, much smaller org.
My laptop has 16gb of RAM, meaning I would have 4gb of RAM dedicated to Java. That should be enough, no? And like John, my issue is more with the CPU usage.
romnus
on 25 Aug 2020
This issue has been automatically closed because there has been no response to our request for more information from the original author. Currently, there is not enough information provided for us to take action. Please reply and reopen this issue if you need additional assistance.
![no-response[bot] picture](https://avatars.githubusercontent.com/u/26350515?v=4&s=40) no-response[bot]
on 31 Aug 2020
no-response[bot]
on 31 Aug 2020
I understand it's a bot was the one that closed this, however I do believe we provided the requested information.
Maybe we could keep this open?
johnpanos
on 31 Aug 2020
We are working on a fix for this.
The root problem is that SObject definitions were refreshed via the new prompt that was recently added. In general, you want SObject definitions as they give you code smartness. However, for many machines, there isn't enough horsepower. As a workaround until we have a fix, try the following:
Check if your project's .sfdx/tools/sobjects folder exists. If it does, delete its contents and restart VSCode to see if that helps lower the amount of memory consumed by the Apex language server. When VS Code restarts, say NO to the prompt to refresh SObject Definitions and don't run the SFDX: Refresh SObject Definitions command
smaddox-sf
on 1 Sep 2020
I have (I think) the same problem, but with slightly different results. My Java process also goes super high in CPU values, but after a minute or so it stops. However, the problem is that after it's done it keeps taking up about 4 gigs of ram.
 spavunaleaseplan
on 23 Oct 2020
spavunaleaseplan
on 23 Oct 2020
Hi @spavunaleaseplan - Thanks for the additional details. How much metadata is in the org you are connected to? The flow you are describing is because we are gathering the details of the metadata from the org to provide code smartness. However, for those with machines that don't have enough horsepower, sometimes the metadata is too much. We're working to improve the architecture on this. In the meantime, you can try this workaround:
Check if your project's .sfdx/tools/sobjects folder exists. If it does, delete its contents and restart VSCode to see if that helps lower the amount of memory consumed by the Apex language server. When VS Code restarts, if you say YES to the prompt to refresh SObject Definitions, it will pull a limited set of metadata. If you run the SFDX: Refresh SObject Definitions command, it will pull ALL metadata.
https://developer.salesforce.com/tools/vscode/en/apex/writing/#code-smartness-for-sobjects
smaddox-sf
on 27 Oct 2020
Please fix this. It makes the IDE completely useless. Salesforce is pushing VS Code w/ this extension pack as _THE Standard_ for Salesforce DX development and future enhancements to the Dev platform, but at the moment this extension leaves a lot to be desired.
Programs like The Welkin Suite and Sublime Text w/ MavensMate had no issues handling this stuff, doing code completion, storing and accessing metadata, etc. You're telling me my only option for accurate field and code completion functionality (pulling SObject definitions from the org) comes at the expense of pinning my CPU to 100% and eating 50% of my RAM?
I can't control the power of the machine given to me to do my job, and now this issue makes it nearly impossible to do my job effectively. Where is this in the priority list?
 MorganMarchese
on 3 Dec 2020
MorganMarchese
on 3 Dec 2020
MorganMarchese
on 3 Dec 2020
Hi @MorganMarchese - Thanks for reaching out. We're actively working on this and have been releasing some incremental improvements with more coming soon. Based on the data we have, we think there's a couple areas affecting the performance and causes these issues. More details on when folks see the issues are helpful since it's an occasional occurrence for many users.
For you, is it happening on all projects?
Can you tell me the size of the project(s) when you see these issues? (for example, details like number of files and number of apex classes)
You may have seen this suggestion earlier in this thread, but I'll repost it here in case it is helpful to you: _You can also hit issues if language server process is not assigned enough memory by the Java JVM. By default, Java would assign up to one quarter of the machine's physical memory (RAM). To see if this is what's causing the issue, you can use the salesforcedx-vscode-apex.java.memory setting to assign more memory to the process. Here's the documentation on how that setting works._
smaddox-sf
on 3 Dec 2020
Hi @smaddox-sf - I am working with a git repo for a large international Salesforce org, pulling down the master from git, creating new branches, working on items, and then pushing them to the remote repo. The total size of my force-app/main/default folder is 705 MB, and the full size of the classes folder is 11.5 MB. There are 2,469 files in the classes folder. Assuming half of those are meta.xml's, I'm working with roughly 1,235 classes.
Code completion functionality works for me very sporadically, often times I can't even get the IDE to output the list of methods available on the System class, like debug, or things like String don't show any methods like isBlank, equalsIgnoreCase, etc. I tried the steps mentioned above to delete all of the content in the .sfdx > tools > sobjects folders and then not to run a full SObject Definition refresh, instead opting to use the prompt to pull a limited set of data. However, issue persists.
I can try to assign more RAM, but my machine only has 8 GB of usable RAM. Unfortunately, between Chrome and Java being RAM hogs, I'm already at 78% memory capacity on my machine as well. Java is (at this moment) using 532 MB of RAM, Chrome is using 600 MB, Teams is using 200 MB, VS Code 220 MB, and so on and so on until I'm ultimately at 78-80% capacity at any given time just at rest.
Part of me feels like my machine is underpowered for this work (ThinkPad T490, Intel Core i5-8365U @ 1.90 GHz with 8.00 GB of RAM (7.72 GB usable)) running Windows 10 Enterprise x64, but then I look at the Requirements for VS Code and I see that they recommend at least a 1.6 GHz processor and 1 GB of available RAM, and say that the program is very lightweight and should run on todays hardware without issue. I just recently started here at this new org so I can't really request a new laptop unless I've exhausted all other options and as of right now this experience is severely crushing my ability to work effectively. I mean honestly I could go on and on for hours about all of the things that DON'T work for me in this extension pack, but the most important is the CPU issue.
MorganMarchese
on 4 Dec 2020
This is still happening. I tried Sun JRE and Azul JRE on both the same issue. High CPU load for very long time.
For me it is happening on two computers with the same large project open. Always after opening VSCode with that project.
 PawelWozniak
on 2 Feb 2021
PawelWozniak
on 2 Feb 2021
Issue also reported on #3308. Closing that one as a duplicate, but adding the CPU profile here: https://github.com/forcedotcom/salesforcedx-vscode/files/6628487/salesforce.salesforcedx-vscode-apex-unresponsive.cpuprofile.txt
smaddox-sf
on 10 Jun 2021
Hey, not sure if this would be helpful, but I am affected by that issue randomly as well, and here are some details:
- I have a local git repository tracking the Salesforce project in VSC
- typically, the issue occurs when I retrieve all items from the package.xml from the development org, then I believe some processing is run within VSC, most often the CPU usage goes up for a moment, and then goes down, but sometimes it stays up, using all CPU power without a clear need.
 mkrzych
on 21 Jun 2021
mkrzych
on 21 Jun 2021
Related issues
 randi274
·
3Comments
randi274
·
3Comments
 quangxvu
·
5Comments
quangxvu
·
5Comments
 ntotten
·
4Comments
ntotten
·
4Comments
 StanZha
·
4Comments
StanZha
·
4Comments
 jpoonam4
·
5Comments
jpoonam4
·
5Comments