Salesforcedx-vscode: Unable to open file with Apex Interactive Debugger when the path to the file contains spaces (%20)
Summary
I got "Path must be string. Received undefined" error when attempting to start debugger (green Play button)
Steps To Reproduce:
i followed all the steps using below link
https://marketplace.visualstudio.com/items?itemName=salesforce.salesforcedx-vscode-apex-debugger
here is my Launch.json file:
{
        "version": "0.2.0",
        "configurations": [
        {
            "name": "Launch Apex Debugger",
            "type": "apex",
            "request": "launch",
            "sfdxProject": "${workspaceRoot}"
        }
        ]
    }
Expected result
Debugg session should be start
Actual result
"TypeError:Path must be string. Received undefined" error
Additional information

VS Code Version:
1.20
SFDX CLI Version:
CLI version --- sfdx-cli/6.2.1-9477838 (windows-x64) node-v8.9.4
Apex debugger vscode extension version --- 42.2.0
sfdx force version --- v42.0
OS and version:
Windows 7 enterprise SP1
 kristualdandamudi
All 16 comments
@kristualdandamudi , did you also install this extension? https://marketplace.visualstudio.com/items?itemName=chuckjonas.apex-debug
If yes, could you disable that extension while using Salesforce's official Apex Debugger extension?
 DatGuyJonathan
on 13 Feb 2018
DatGuyJonathan
on 13 Feb 2018
Thank you @DatGuyJonathan after Disable the Apex-debugger Extension, launch.json file make the Apex debug session. but my break point doesn't hit. Here is my steps:
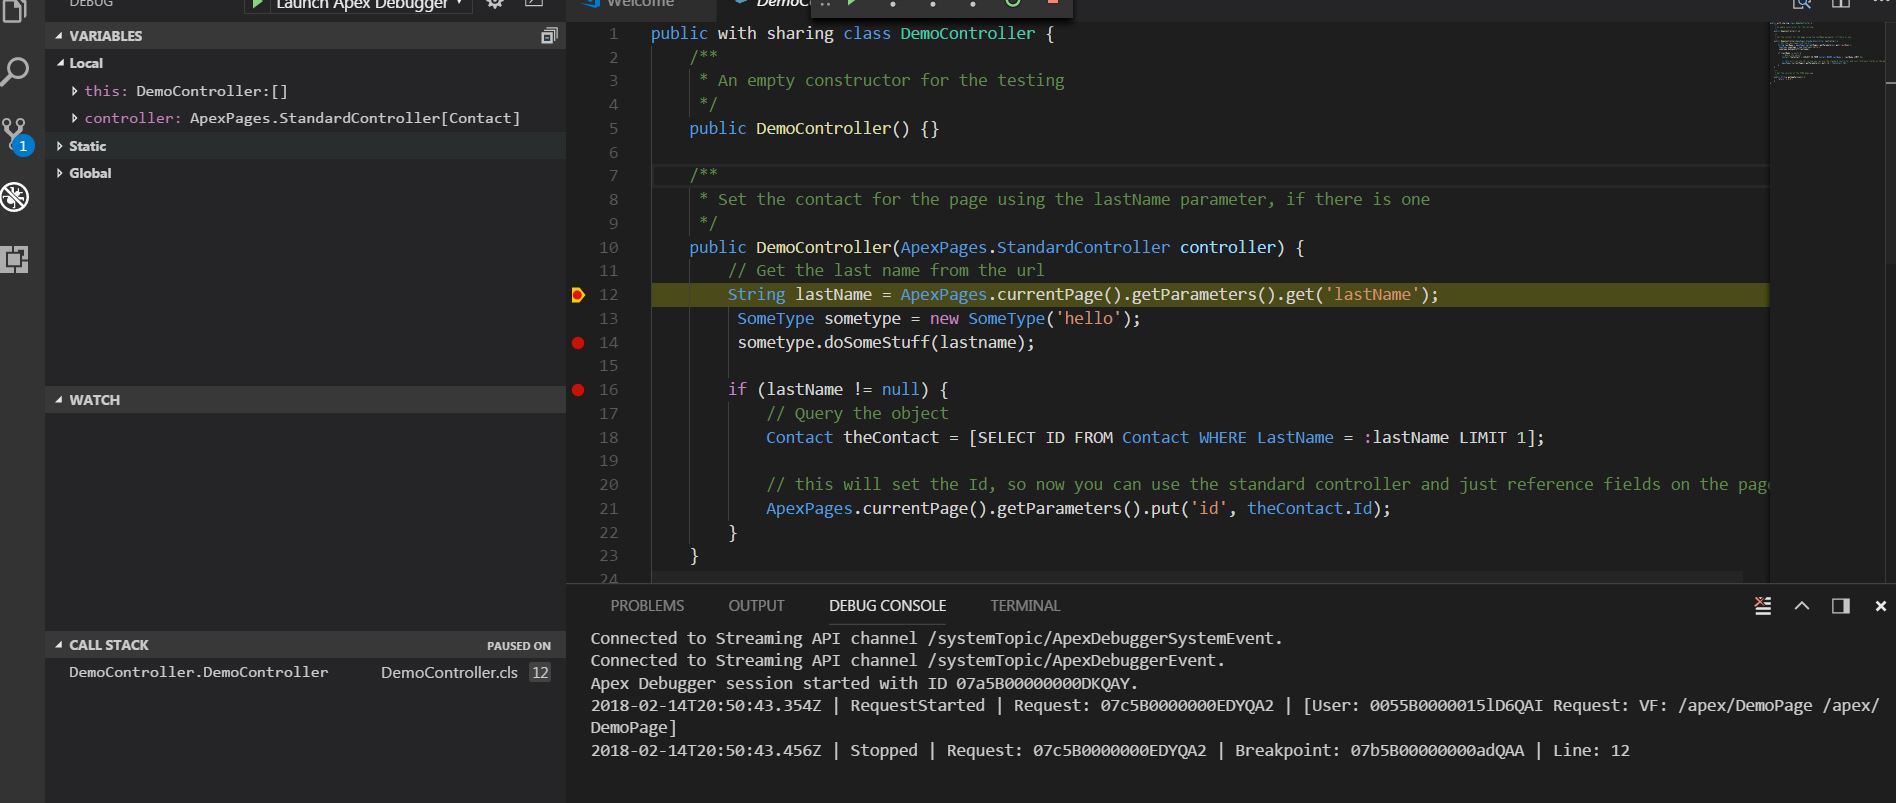
after click start Debugging(green Play) button, Apex debugger session started with Id "07a5B00000000ClQAI"

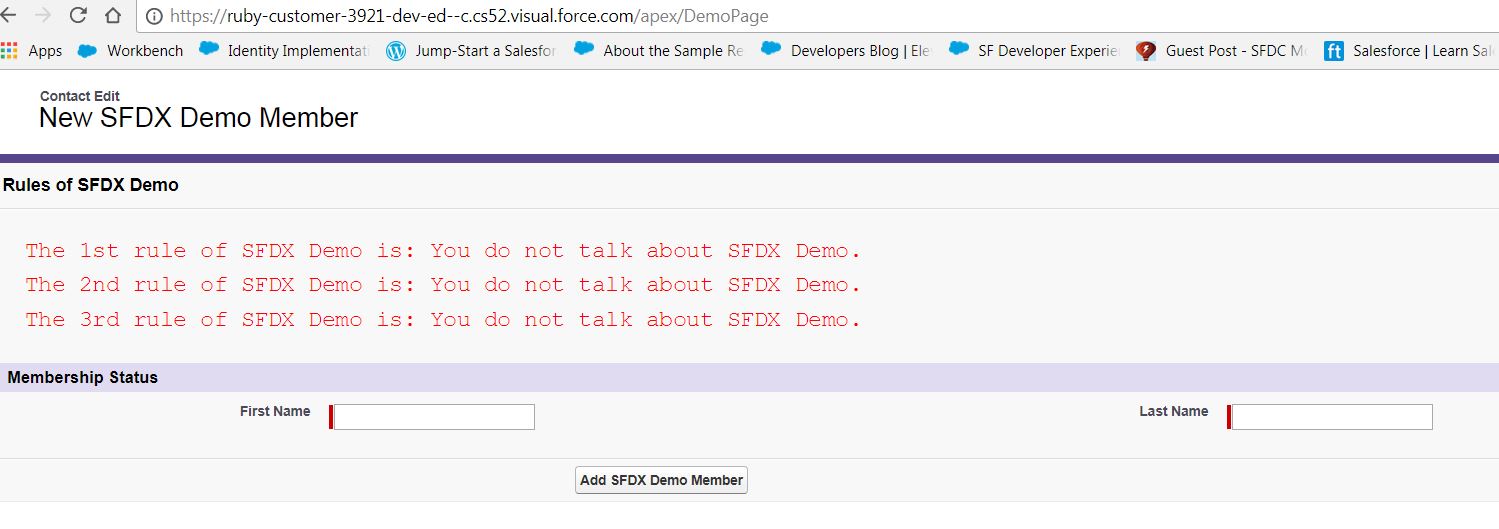
2) i entered VF page url in Browser then i expect to hit Break point but it didn't happened.
3)i saw Disconnected From Streaming API channel /systemTopic/ApexDebuggerEvent message in Debug Console. i didn't understand why it happens.
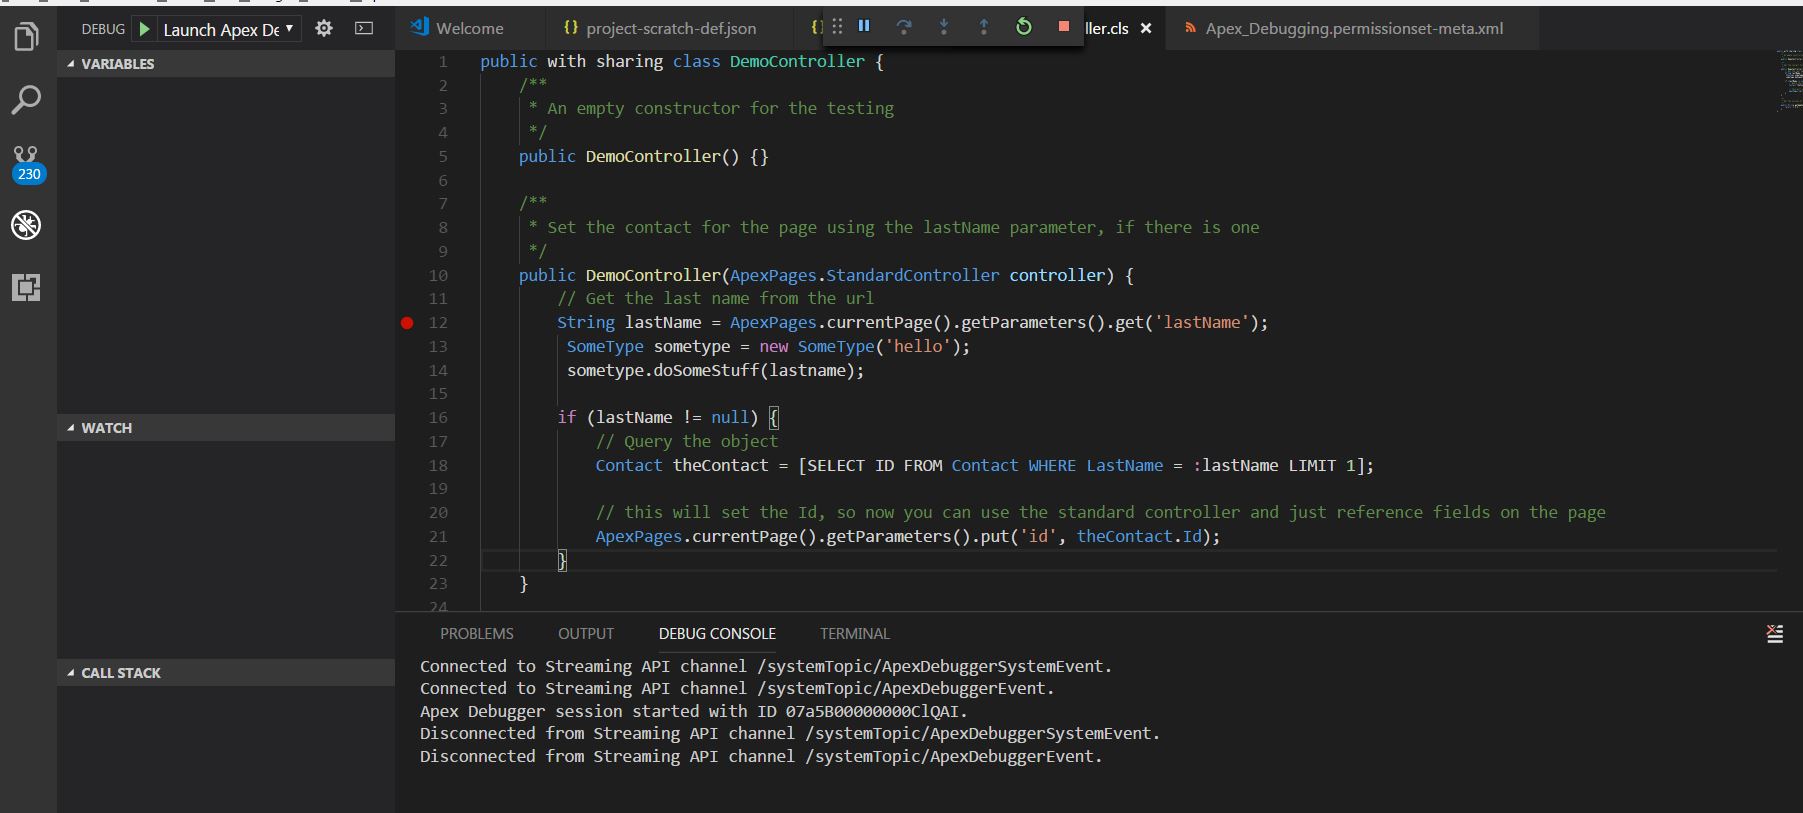
4) then my VF loads with out hitting Break Point.
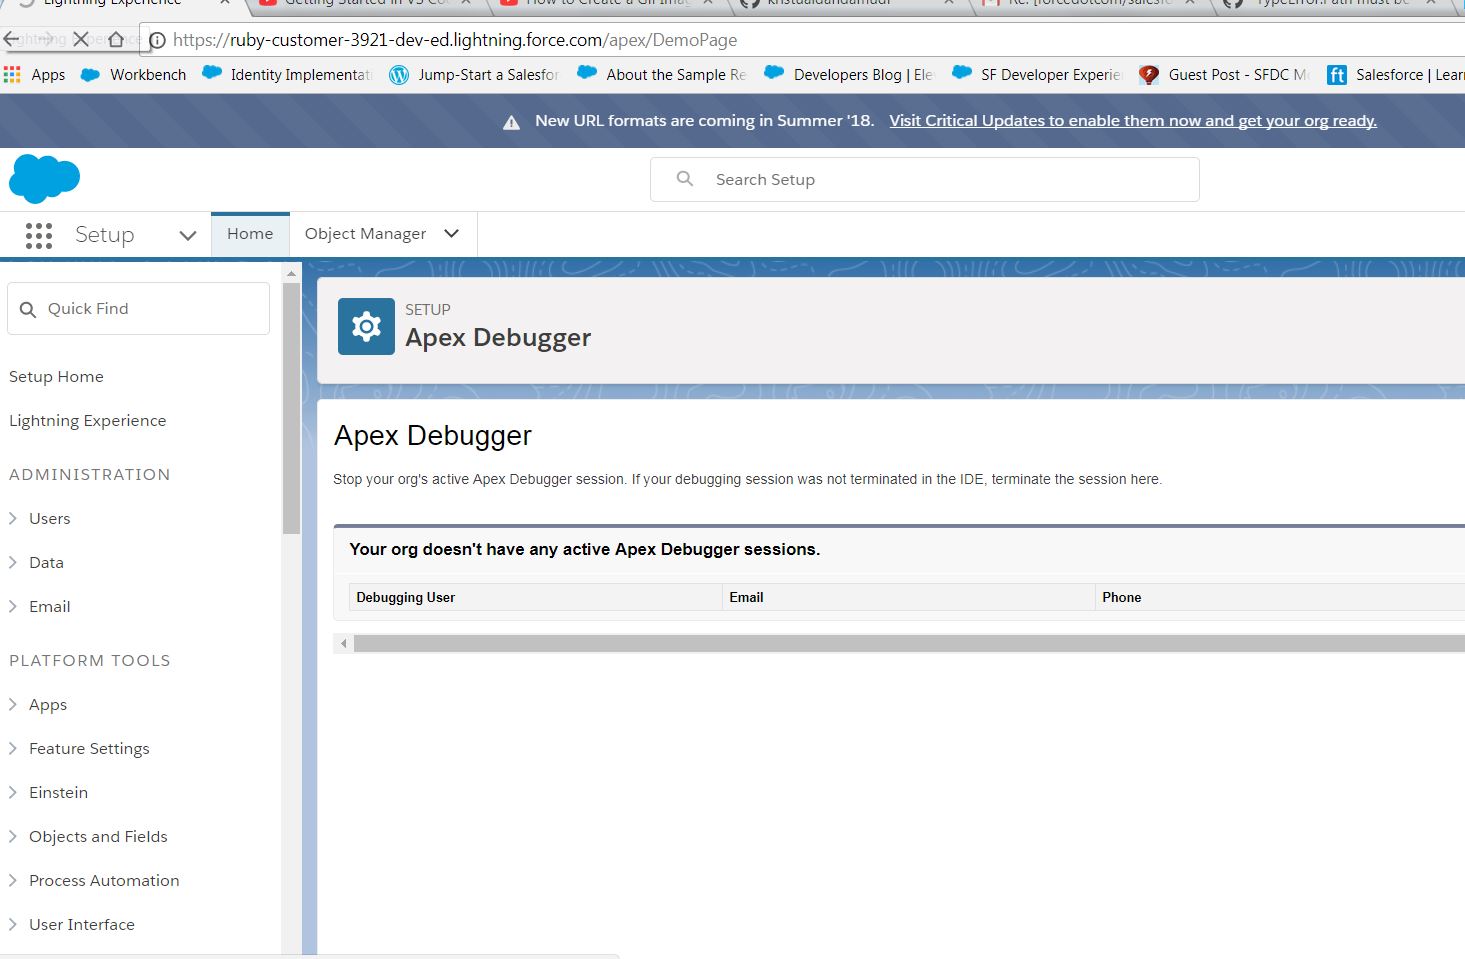
Note: if i try to reproduce the same issue immediately after kill the Apex debugger session in scratch org.
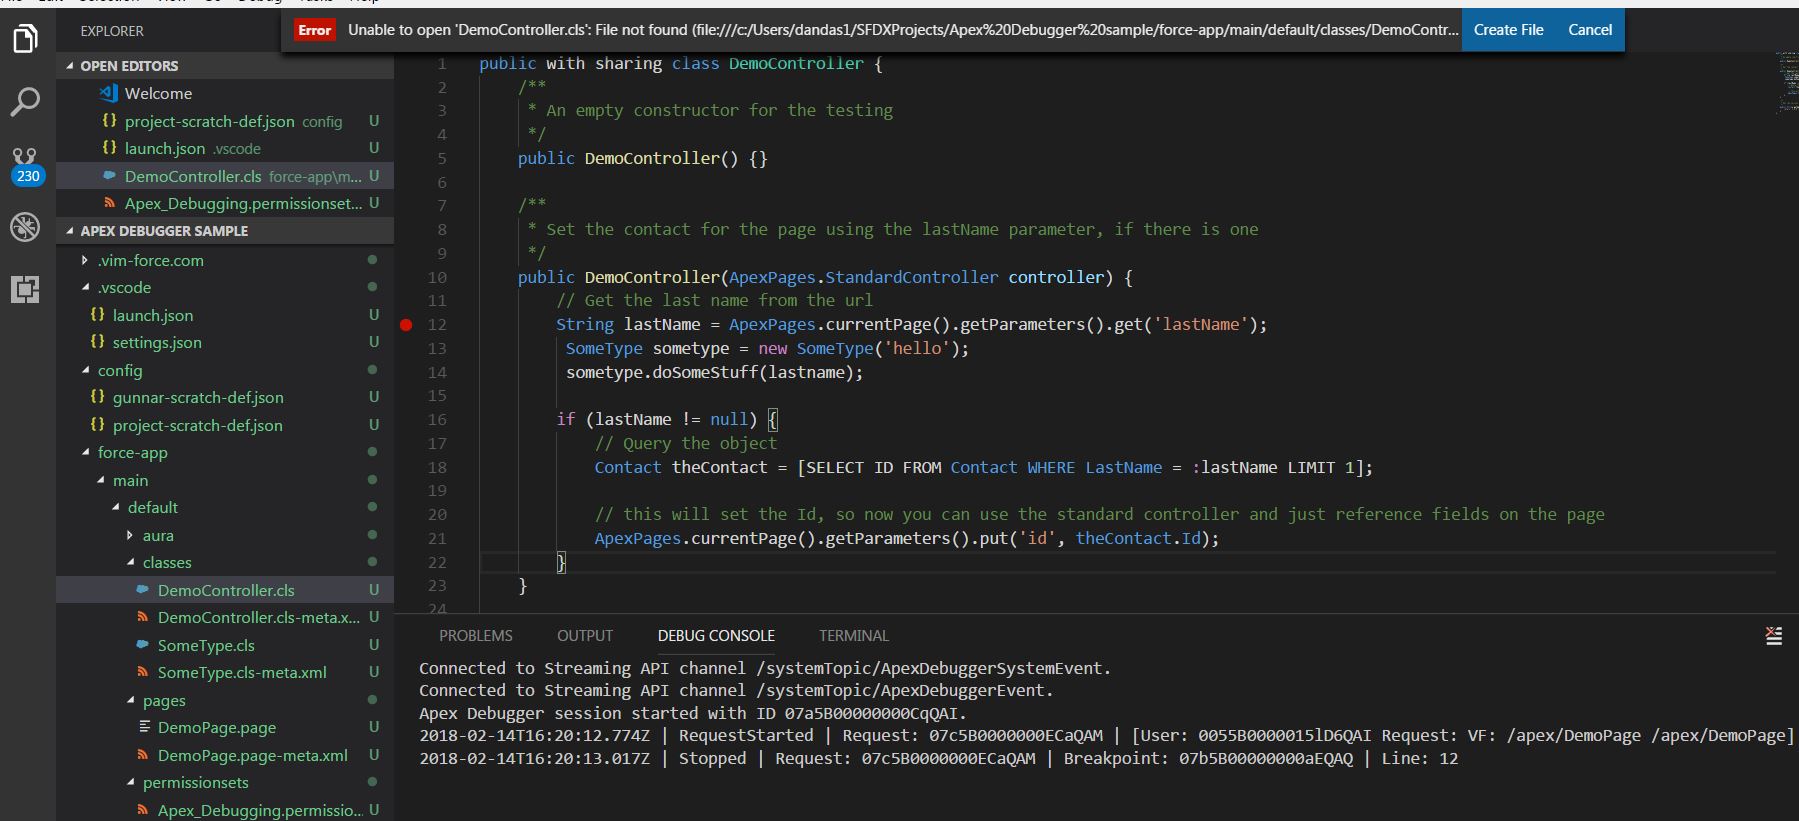
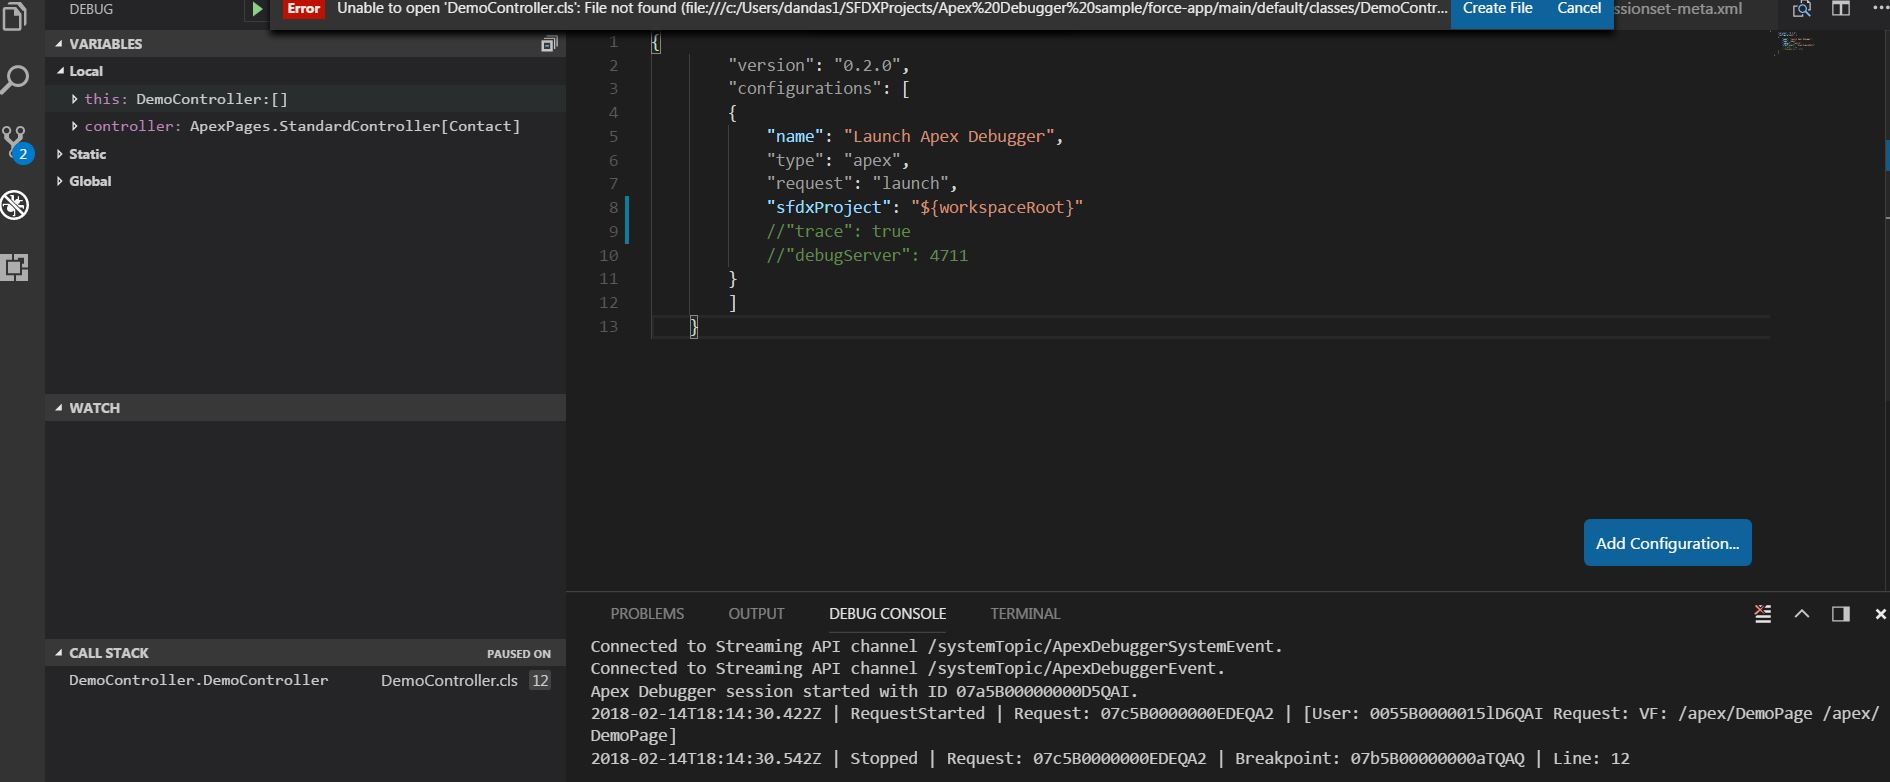
Some times Unable to open 'DemoController.cls':file not found, demoController.cls is the Demopage Custom controller.
Today Update: i added "trace":true in launch.json file configuration array. i got same file not found error. but it gives more details in debug console widow
12276: launchRequest: sfdxProject=C:\Users\dandas1\SFDXProjects\Apex Debugger sample
Connected to Streaming API channel /systemTopic/ApexDebuggerSystemEvent.
Connected to Streaming API channel /systemTopic/ApexDebuggerEvent.
Apex Debugger session started with ID 07a5B00000000CvQAI.
12276: setBreakPointsRequest: uri=file:///c:/Users/dandas1/SFDXProjects/Apex%20Debugger%20sample/force-app/main/default/classes/DemoController.cls
12276: setBreakPointsRequest: uri=file:///c:/Users/dandas1/SFDXProjects/Apex%20Debugger%20sample/force-app/main/default/classes/DemoController.cls args.lines=12 verified=12 unverified=
2018-02-14T16:43:34.701Z | RequestStarted | Request: 07c5B0000000ECpQAM | [User: 0055B0000015lD6QAI Request: VF: /apex/DemoPage /apex/DemoPage]
12276: handleStopped: clearing variable cache
2018-02-14T16:43:34.827Z | Stopped | Request: 07c5B0000000ECpQAM | Breakpoint: 07b5B00000000aJQAQ | Line: 12
12276: stackTraceRequest: args threadId=1 startFrame=0 levels=20
12276: stackTraceRequest: args threadId=1 startFrame=0 levels=20
12276: stackTraceRequest: state={"locals":{"frameNumber":0,"local":[{"name":"controller","declaredTypeRef":"com/salesforce/api/ApexPages/StandardController","nameForMessages":"ApexPages.StandardController","ref":0,"value":"ApexPages.StandardController[Contact]","slot":1},{"name":"this","declaredTypeRef":"DemoController","nameForMessages":"DemoController","ref":1,"value":"DemoController:[]","slot":0}]},"statics":{"typeRef":"DemoController"},"globals":{},"stack":{"stackFrame":[{"typeRef":"DemoController","fullName":"DemoController.DemoController","lineNumber":12,"frameNumber":0}]},"references":{"references":[{"type":"object","id":0,"typeRef":"com/salesforce/api/ApexPages/StandardController","nameForMessages":"ApexPages.StandardController"},{"type":"object","id":1,"typeRef":"DemoController","nameForMessages":"DemoController"}]}}
12276: populateReferences: new object reference: 1000 for 0 ApexPages.StandardController
12276: populateReferences: new object reference: 1001 for 1 DemoController
12276: scopesRequest: scope name=Local variablesReference=1002
12276: scopesRequest: scope name=Static variablesReference=1003
12276: scopesRequest: scope name=Global variablesReference=1004
12276: variablesRequest: getting variable for variablesReference=1002 start=undefined count=undefined
12276: resolveApexIdToVariableReference: resolved apexId=0 to variableReference=1000
12276: resolveApexIdToVariableReference: resolved apexId=1 to variableReference=1001
12276: stackTraceRequest: state={"locals":{"frameNumber":0,"local":[{"name":"controller","declaredTypeRef":"com/salesforce/api/ApexPages/StandardController","nameForMessages":"ApexPages.StandardController","ref":0,"value":"ApexPages.StandardController[Contact]","slot":1},{"name":"this","declaredTypeRef":"DemoController","nameForMessages":"DemoController","ref":1,"value":"DemoController:[]","slot":0}]},"statics":{"typeRef":"DemoController"},"globals":{},"stack":{"stackFrame":[{"typeRef":"DemoController","fullName":"DemoController.DemoController","lineNumber":12,"frameNumber":0}]},"references":{"references":[{"type":"object","id":0,"typeRef":"com/salesforce/api/ApexPages/StandardController","nameForMessages":"ApexPages.StandardController"},{"type":"object","id":1,"typeRef":"DemoController","nameForMessages":"DemoController"}]}}
please figure out where i did wrong.
Thanks
Dandamudi
kristualdandamudi
on 14 Feb 2018
@kristualdandamudi
- Are you behind any proxy/firewall? In the past, we noticed some issues with the streaming API when it's used behind proxies. I noticed that you don't see that issue anymore in your "Update today" section above.
- Also, looking at https://user-images.githubusercontent.com/28848782/36215300-b2f96dee-1179-11e8-9254-07fada3934c3.JPG it seems like you have 200+ git changes. That seems a bit unusual. Do you have multiple copies of file
 vazexqi
on 14 Feb 2018
vazexqi
on 14 Feb 2018
@vazexqi
1.Are you behind any proxy/firewall? In the past, we noticed some issues with the streaming API when it's used behind proxies. I noticed that you don't see that issue anymore in your "Update today" section above.
Ans: today updates only i did in behind the firewall. what ever i tried in before today updates at home network. so home network also it didn't hit the break point.
- now i commit all other changes except my debugger project, even though still i am facing same issue.
can you please have look and find where i did wrong.
Thanks
Dandamudi
kristualdandamudi
on 14 Feb 2018
@kristualdandamudi - What happens if you did this again, but don't put spaces in your file path? From your screenshot, it seems like your path contains spaces (Apex%20Debugger%20Sample). Could you try this again in a project that doesn't have spaces in the name?
I think the connection is all working is just it is not able to open that file. I am not in front of a windows box to try this.
vazexqi
on 14 Feb 2018
Thank you @vazexqi after i remove the spaces in Path, it's working fine, now it's hit the Break Point. Appreciate for your Prompt response.
can you please answer for below my question on sfdx:
- why some of commands not working in corporation firewall, at out of office (home network )all of them are working fine. like sfdx forc:org:open -u mysctratchorg1 it 'll give
Waiting to resolve the Lightning Experience-enabled custom domain...
ERROR running force:org:open: The Lightning Experience-enabled custom domain is unavailable. message at Corporation network, even i set SFDX_DOMAIN_RETRY = 300 env variable also.
but same Command works fine at home network it'll open the org in browser.
this issue not only for scratch org, all my TPO and Debhub orggs also.
kristualdandamudi
on 14 Feb 2018
@kristualdandamudi - As for the "...some of commands not working in corporation firewall", I'll rope in @amphro to give you some insights on that. Thomas, feel free to recommend a different way to continue the conversation of sfdx force:org:open if you feel that this thread is too long.
@DatGuyJonathan - I will file a bug internally for white spaces in path so that we can handle this. I suspect we need to decode the uri to change the %20 into proper paths.
vazexqi
on 15 Feb 2018
Looking at the CLI code, I'm not entirely sure the lightning domain check supports proxies... I would need to manually test. If so, I'll file a bug and work on getting it resolved.
In the meantime, if you set SFDX_DOMAIN_RETRY=0, then it will skip the domain check and go straight to the browser. If you get the page saying "domain not found" then you will have to keep refreshing until the domain is resolved.
 amphro
on 15 Feb 2018
amphro
on 15 Feb 2018
Just to close the loop on this
@kristualdandamudi , did you also install this extension? https://marketplace.visualstudio.com/items?itemName=chuckjonas.apex-debug
If yes, could you disable that extension while using Salesforce's official Apex Debugger extension?
VS Code itself doesn't allow for multiple extensions to be registered for the same type. Both ours and chuckjonas.apex-debug define it using type:apex. See https://github.com/forcedotcom/salesforcedx-vscode/blob/develop/packages/salesforcedx-vscode-apex-debugger/package.json#L79 and https://github.com/ChuckJonas/vscode-apex-debug/blob/master/package.json#L61
If you have two, the one that it picks is somewhat random. That's why we recommend that you disable the other one.
vazexqi
on 15 Feb 2018
Thank you @amphro after set SFDX_DOMAIN_RETRY=0 , i tried sfdx force:org:open all orgs launched in browser successfully at corporation firewall.
Question: if i add SFDX_DOMAIN_RETRY=0 as environment variable in my system, i don't need to run always "set SFDX_DOMAIN_RETRY=0" command in windows cmd when ever i entered in to corporation firewall is it right?
kristualdandamudi
on 15 Feb 2018
Correct.
amphro
on 15 Feb 2018
Thank you @amphro. Also, @kristualdandamudi, if you set SFDX_DOMAIN_RETRY=0 in a terminal, command prompt, etc, and then launch VS Code, it should pick it up so that all the commands also inherit that parameter.
On Windows and Linux, you can already just launch code from the terminal. On the Mac, you can follow https://code.visualstudio.com/docs/setup/mac#_launching-from-the-command-line
vazexqi
on 15 Feb 2018
Opened https://github.com/Microsoft/vscode-debugadapter-node/issues/159 since it might be an issue on the adapter.
vazexqi
on 20 Feb 2018
@DatGuyJonathan - I believe that we have actually fixed this (using our own method and also waiting for the next version of the debug-protocol-adapter from Microsoft). If that is so, could you close this issue? If it is not so, what else do we need to do on our side to fix this?
vazexqi
on 20 Mar 2018
@DatGuyJonathan - Is this still relevant or has already been fixed? If so, could you close this?
vazexqi
on 26 Apr 2018
My bad, fell under my radar. The space issue on Windows path has been fixed in https://github.com/forcedotcom/salesforcedx-vscode/pull/359.
DatGuyJonathan
on 26 Apr 2018
Related issues
 StanZha
·
4Comments
StanZha
·
4Comments
 sc5148
·
4Comments
sc5148
·
4Comments
 ghost
·
5Comments
ghost
·
5Comments
 saramorgan
·
3Comments
saramorgan
·
3Comments
 simonfoden
·
6Comments
simonfoden
·
6Comments