Saleor: Website performance improvements
What I'm trying to achieve
I'm trying understand options I have to optimize my shop performance. Actually Im running this on saleor - heroku standard 2x dyno plan, storefront - heroku standard 1x dyno plan
https://developers.google.com says that first load in 'laboratory env' tooks 12.0s, quite long ...
and most suggested improvements are text compression:
/js/app.ad65d2c….js(www.) | 1567,4 KB | 1151,7 KB
/app.c5c7a00….css(www.) | 47,7 KB | 38,6 KB
https://gtmetrix.com also suggests to enable compression:
Compressing https://www./js/app.ad65d2c0d037432d8698.js could save 1.1MiB (73% reduction).
Compressing https://www./app.c5c7a004382e5f252ded.css could save 38.6KiB (80% reduction).
Compressing https://www./ could save 4.2KiB (74% reduction).
Compressing https://www./images/logo.svg could save 2.0KiB (50% reduction).
Compressing https:/www./images/favicons/manifest.json could save 1.0KiB (74% reduction).
Compressing https://www./images/user.svg could save 919B (49% reduction).
Compressing https://www./images/cart.svg could save 618B (47% reduction).
Compressing https://www./images/instagram-icon.svg could save 470B (53% reduction).
Compressing https://www./images/search.svg could save 310B (45% reduction).
Compressing https://www./images/twitter-icon.svg could save 303B (44% reduction).
Compressing https://www./images/youtube-icon.svg could save 281B (45% reduction).
Compressing https://www./images/facebook-icon.svg could save 111B (31% reduction).
Compressing https://www.*/images/carousel-arrow.svg could save 61B (24% reduction).
Additionally there is some potential in browser caching for the following cacheable resources:
https://abc.s3.amazonaws.com/__sized__/products/APWTZMWZFZXA-thumbnail-255x255.png (expiration not specified)
(...)
Compression would speed up loading but its not main factor in this case - its my observation as I compared my shop with some randomly chosen competitor (similar total size of downloaded page).
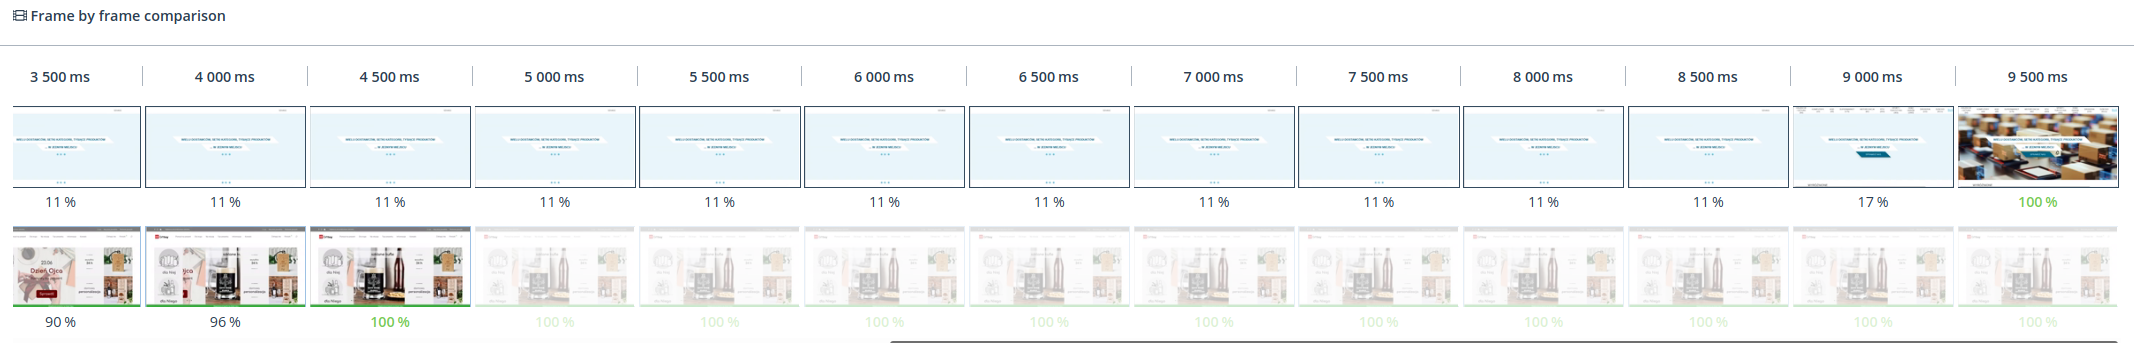
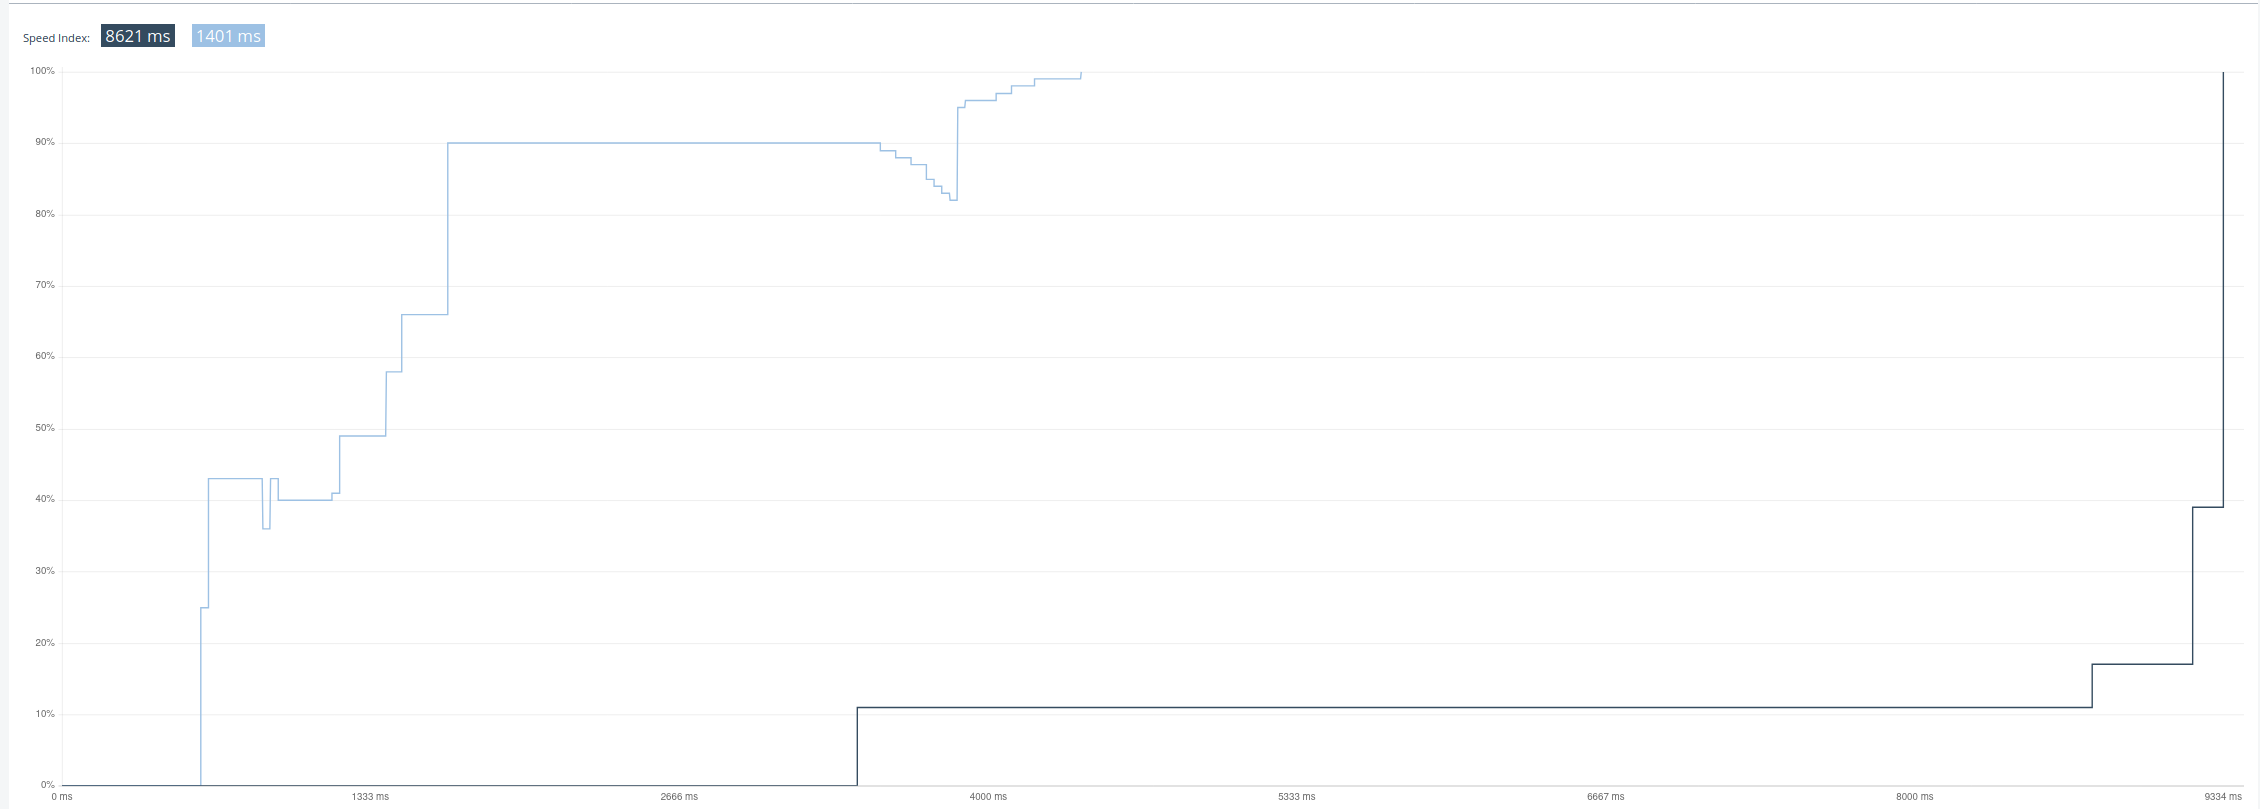
The biggest difference is that everything is loaded in one shot. 11%...11%, 17%, 100% (9.5s).
Problem is visible here:
I have some menu, 10 pictures from categories and carousel. Why its so slow? Its not because of uncompressed app, isn't it ;)?
I looked at time line:
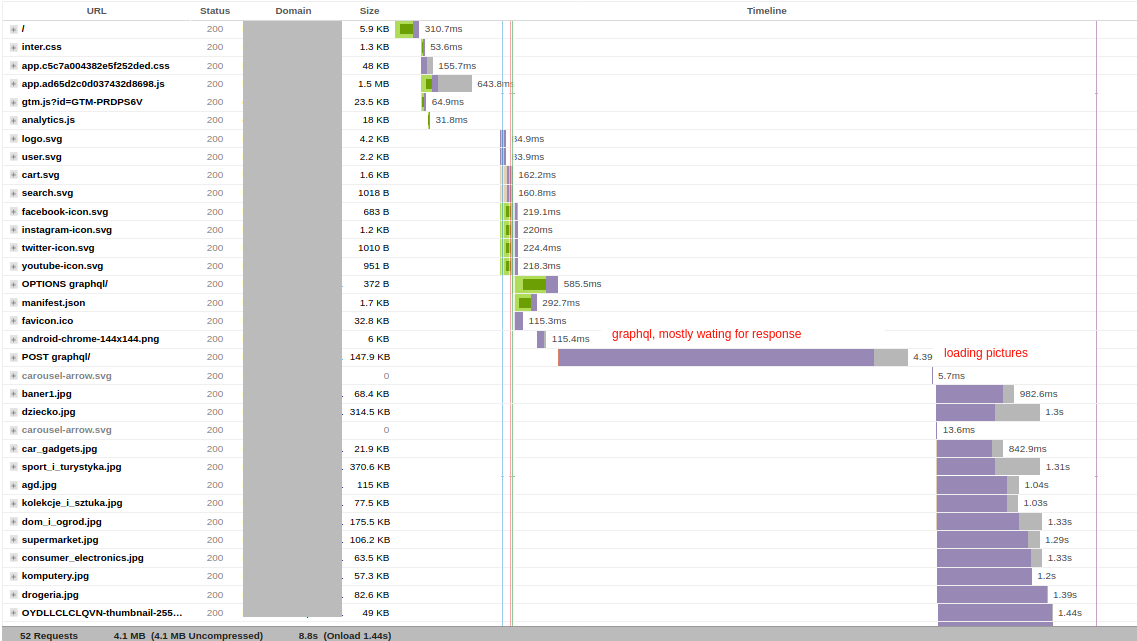
App is loading quite fast...<1s. Waiting for graphql query tooks 5s and then loading pictures tooks ~2s. That's the whole picture.
Question
Do You have some plans to introduce performance optimization package?
Maybe some hints what to do and how... to speed up shops based on saleor?
What are potential improvements?
 PiotrLaszczyk
All 12 comments
Is this the default storefront? If not, what is the GraphQL query that takes 5 seconds? I see it says it fetches 147 kB of data which seems like a lot.
 patrys
on 4 Jun 2020
patrys
on 4 Jun 2020
Storefront is only slightly changed (from graphql ifc perspective) but problem is that my db is maybe too heavy... but to be honest I was planning to make it much much bigger ;).
I added extra logging in saleor. Those are my results from loading shop. Those added earlier are from some web site that calculate performance and they have own 'laboratory conditions'.
This is graphql part: 19:41:05.17 .. 19:41:08.67: 3,5 seconds. There is additionally some time for loading app and loading pictures.. hmm ;)
2020-06-06T19:41:05.177797+00:00 app[web.1]: query GetShop {
(...)
2020-06-06T19:41:05.413976+00:00 app[web.1]: return code: 200 - 0.2s
2020-06-06T19:41:05.414008+00:00 app[web.1]: query: fragment Price on TaxedMoney {
(...)
2020-06-06T19:41:05.436454+00:00 app[web.1]: return code: 200 - 0.02s
2020-06-06T19:41:05.436473+00:00 app[web.1]: query: fragment MainMenuSubItem on MenuItem {
(...)
2020-06-06T19:41:06.844447+00:00 app[web.1]: return code: 200 - 1.4s
2020-06-06T19:41:06.844448+00:00 app[web.1]: query: fragment BasicProductFields on Product {
(...)
2020-06-06T19:41:08.578539+00:00 app[web.1]: return code: 200 - 2.8s
2020-06-06T19:41:08.578540+00:00 app[web.1]: query ProductsList {
(...)
2020-06-06T19:41:08.625774+00:00 app[web.1]: return code: 200 - 0.05s
2020-06-06T19:41:08.625802+00:00 app[web.1]: query: fragment SecondaryMenuSubItem on MenuItem {
(...)
2020-06-06T19:41:08.675088+00:00 app[web.1]: return code: 200 - 0.06s
Loading menu items and basic product fields eats 3.2s.
Issue is that storefront requires lots of information to generate view and first user impression is bad. Additionally not sure how it affects on google organic search position.
PiotrLaszczyk
on 6 Jun 2020
It should work fine with millions of records, if it does not, it's a bug and we should fix it. Can you share your slow queries so we can take a look? If you don't want to share them in public, you can send them over email to [email protected]. It would be even better If you could share some database statistics (the ones you think are relevant since you called your database "heavy").
patrys
on 8 Jun 2020
Oki, its send.
PiotrLaszczyk
on 8 Jun 2020
This is a backend issue since it is the GraphQL request that takes too long. I've already identified an issue with loading menus and will work on optimizing this. In another PR (https://github.com/mirumee/saleor/pull/5707) we're also working on optimizing queries for products availability which should also help in your case. I'm transferring this issue to the core repo and will inform you about the progress there.
 maarcingebala
on 9 Jun 2020
maarcingebala
on 9 Jun 2020
Thank You.
Last question. How about app compression. There is some potential in this also. Would You consider to add this in future?
My initial goal was to make my site working as fast as possible... to have good background for populating by new products..
PiotrLaszczyk
on 9 Jun 2020
We have our CloudFront configures to automatically compress all traffic but we're open to pull requests adding compression to Webpack.
patrys
on 9 Jun 2020
@PiotrLaszczyk We merged two PRs to master today that improve the performance of loading menus and product lists. If you're using master, you can update to the newest version and see how it performs now. There are still some queries to optimize but it should be already a bit faster.
maarcingebala
on 10 Jun 2020
I was planning to do next rebase in ~2 weeks from now as every time I need to check everything. I will give You feedback as soon as I will check it. But anyway... big thanks in advance;)
PiotrLaszczyk
on 10 Jun 2020
Sounds good. During these 2 weeks we should roll out a few more performance improvements. From what I saw your DB is pretty large so it'll be nice to test our updates with it.
maarcingebala
on 10 Jun 2020
There is list of improvements I have planned for next round with saleor, so I will do merge with master, put my changes, test it and put all under production. But need to handle actual cases so in two weeks. I will send feedback for sure.
PiotrLaszczyk
on 10 Jun 2020
This issue has been automatically marked as stale because it has not had recent activity. It will be closed if no further activity occurs. Thank you for your contributions.
![stale[bot] picture](https://avatars3.githubusercontent.com/in/1724?v=4&s=40) stale[bot]
on 9 Aug 2020
stale[bot]
on 9 Aug 2020
Related issues
 toguko
·
4Comments
toguko
·
4Comments
 flaviocolonna
·
3Comments
flaviocolonna
·
3Comments
 maltitco
·
3Comments
maltitco
·
3Comments
 ranjanprj
·
3Comments
ranjanprj
·
3Comments
 Pacu2
·
3Comments
Pacu2
·
3Comments
Most helpful comment
There is list of improvements I have planned for next round with saleor, so I will do merge with master, put my changes, test it and put all under production. But need to handle actual cases so in two weeks. I will send feedback for sure.