Sails: Memory Leak When Using REST Over Socket.io
Sails version: 0.12.13
Node version: 4.4.3
NPM version: 3.10.5
Operating system: Windows 7
I'm one of the people who has seen memory management issues periodically with Sails but never had a smoking gun to prove it might be something in the Sails core, versus my own logic or an installed module. By the time the memory leak scenario presents itself, the project has become mature and trying to isolate different components becomes difficult. I have a strong suspicion that this is where the problem is occurring in my projects, and hopefully it's going to help out others who couldn't prove their case that Sails was misbehaving with the normal test cases.
I'm using sails-hook-dev to expose the memory usage endpoint (/dev/memory) and using an external webpage to periodically poll this endpoint to track memory usage to check the effects of memory improvements in my program logic. As a bit of a shortcut due to CORS restrictions on these hook routes, I decided to use the sails.io.js client to issue REST-like requests over the WebSocket connection, which worked great. A nice Chart.js chart would plot the heap and RSS usage.
Then I noticed if I increased the polling frequency of that route, the memory usage would continually increase with very little being reclaimed by GC events (sometimes visible as small drops in heap). Each time a GC would happen, the resulting heap size was still higher than the last GC event, creating a leak that would never be handled. Over time, the process would use too much memory (>1 GB) and eventually crash.
I was able to reproduce the behavior with a fresh copy of 0.12.13 and only installing sails-hook-dev. No user code, no config changes. If I point the plotter program at the barebones Sails instance, the memory usage exhibits the same leaky behavior.
Interesting to note is that manually calling process.gc() seems to do the trick, but the incremental GC events by V8 are not keeping up with the memory allocations that occur in each request cycle. The only workaround would be to manually invoke GC which is generally considered a horrible idea in production and should never be needed.
Something in the Sails logic that translates a Socket request to a Sails route seems to be gobbling up memory so often that the GC can't keep up with all the allocations. While I didn't specifically retest this part in the latest Sails version, I remembered that I saw similar leaky behavior somewhere in the 0.11.x branch when sending REST-like WebSocket requests, and decided to send raw events over the Sails WS connection. Assuming that's still the case, this would prove that Socket.io is not the problem but rather something in the Sails logic when it translates the sails.io.js request into a virtual REST request.
The plotter tool which is just an HTML page with JS to connect to the remote Sails instance, creates the Chart.js scatterplot and polls the /dev/memory route with io.socket.get(...), adding each result to the chart. I ramped it up as high as 100ms - 1000ms and can see the growth easier. In my earlier tests I would check every 10 seconds or so, which was enough to stack up the memory (which should be a very fair load to ask of Node/Sails).
Simplified Steps:
- Run
sails new sails-memory(need a frontend only so sails.io.js is served) cd sails-memorynode app.jsto lift Sailsnpm install --save-dev sails-hook-devto get the hook installed for the Plotter to poll- Run Memory Plotter tool, which connects to Sails over WebSocket automatically
- Watch memory growth increase with time, even after GC runs the trend continues
<!DOCTYPE html>
<html lang="en">
<head>
    <meta charset="UTF-8">
    <title>Memory Plotter</title>
</head>
<body>
  <canvas id="myChart" width="800" height="800"></canvas>

  <script src="js/jquery-3.2.1.min.js"></script>
  <script src="js/Chart.bundle.min.js"></script>
  <script src="http://localhost:1337/js/dependencies/sails.io.js"></script>
  <script src="js/main.js"></script>
</body>
</html>
//direct sails.io.js to another host/port
io.sails.url = 'http://localhost:1337/';

var ctx = document.getElementById("myChart");
var myChart = new Chart(ctx, {
    type: 'line',
    data: {
        labels: [],
        datasets: [
            {
                label: 'Heap Usage (MB)',
                data: [],
                fill: false,
                backgroundColor: 'rgba(255, 99, 132, 0.2)',
                borderColor: 'rgba(255, 99, 132, 0.6)',
                borderWidth: 1
            },
            {
                label: 'Heap Total (MB)',
                data: [],
                fill: false,
                backgroundColor: 'rgba(54, 162, 235, 0.2)',
                borderColor: 'rgba(54, 162, 235, 0.6)',
                borderWidth: 1
            },
            {
                label: 'RSS Size (MB)',
                data: [],
                fill: false,
                backgroundColor: 'rgba(255, 206, 86, 0.2)',
                borderColor: 'rgba(255, 206, 86, 0.6)',
                borderWidth: 1
            }
        ]
    },
    options: {
        maintainAspectRatio: false,
        responsive: true,
        scales: {
            xAxes: [{
                type: 'linear',
                position: 'bottom'
            }],
            yAxes: [{
                ticks: {
                    beginAtZero: true
                }
            }]
        }
    }
});

function getMemoryUsage() {
    console.log('getMemoryUsage...');

    io.socket.get('/dev/memory', function (data, jwres) {
        var heapUsed = data.heapUsed.split(' (')[1];
        heapUsed = parseFloat(heapUsed.substring(0, heapUsed.length - 4));

        var heapTotal = data.heapTotal.split(' (')[1];
        heapTotal = parseFloat(heapTotal.substring(0, heapTotal.length - 4));

        var rssSize = data.residentSetSize.split(' (')[1];
        rssSize = parseFloat(rssSize.substring(0, rssSize.length - 4));

        //push onto chart dataset
        var time = Date.now() / 1000;
        myChart.data.datasets[0].data.push({x: time, y: heapUsed});
        myChart.data.datasets[1].data.push({x: time, y: heapTotal});
        myChart.data.datasets[2].data.push({x: time, y: rssSize});
        myChart.update();
    });
}

var timer;
io.socket.on('connect', function () {
    console.log('Connected!', io.socket);

    getMemoryUsage();
    if (timer) clearInterval(timer);
    timer = setInterval(getMemoryUsage, 1000);
});

 richdunajewski
All 19 comments
@richdunajewski Thanks for posting, we'll take a look as soon as possible.
For help with questions about Sails, click here. If you’re interested in hiring @sailsbot and her minions in Austin, click here.
 sailsbot
on 5 May 2017
sailsbot
on 5 May 2017
<--- Last few GCs --->

  126331 ms: Mark-sweep 1366.0 (1434.4) -> 1366.0 (1434.4) MB, 1225.3 / 0.0 ms [allocation failure] [GC in old space requested].
  127532 ms: Mark-sweep 1366.0 (1434.4) -> 1365.9 (1434.4) MB, 1201.2 / 0.0 ms [allocation failure] [GC in old space requested].
  128734 ms: Mark-sweep 1365.9 (1434.4) -> 1367.7 (1413.4) MB, 1201.0 / 0.0 ms [last resort gc].
  129932 ms: Mark-sweep 1367.7 (1413.4) -> 1369.6 (1413.4) MB, 1198.5 / 0.0 ms [last resort gc].


<--- JS stacktrace --->

==== JS stack trace =========================================

Security context: 00000299700CFB61 <JS Object>
    2: /* anonymous */ [C:\Users\smilz\Development\nodejs\fusion\node_modules\waterline\lib\waterline\query\finders\operations.js:110] [pc=00000227AF2E3310] (this=00000299700E6661 <JS Global Object>,key=0000032444694EA9 <String[9]: editstate>)
    3: arguments adaptor frame: 3->1
    4: InnerArrayForEach(aka InnerArrayForEach) [native array.js:~935] [pc=00000227AF2D5910] (this=000002997000438...

FATAL ERROR: CALL_AND_RETRY_LAST Allocation failed - JavaScript heap out of memory
I have some issues too. Even sometime during the lift.
 simonmilz
on 12 May 2017
simonmilz
on 12 May 2017
Hey @richdunajewski, sorry for the delay and thanks for the detailed post. We'll try and reproduce this using a different profiling tool (just to rule out the tool itself as an issue), and post back here once we have some results.
 sgress454
on 23 May 2017
sgress454
on 23 May 2017
@richdunajewski,@sailsbot,@simonmilz,@sgress454: Hello, I'm a repo bot-- nice to meet you!
It has been 30 days since there have been any updates or new comments on this page. If this issue has been resolved, feel free to disregard the rest of this message and simply close the issue if possible. On the other hand, if you are still waiting on a patch, please post a comment to keep the thread alive (with any new information you can provide).
If no further activity occurs on this thread within the next 3 days, the issue will automatically be closed.
Thanks so much for your help!
sailsbot
on 24 Jun 2017
Heel, @sailsbot.
sgress454
on 24 Jun 2017
@richdunajewski,@sailsbot,@simonmilz,@sgress454: Hello, I'm a repo bot-- nice to meet you!
It has been 30 days since there have been any updates or new comments on this page. If this issue has been resolved, feel free to disregard the rest of this message and simply close the issue if possible. On the other hand, if you are still waiting on a patch, please post a comment to keep the thread alive (with any new information you can provide).
If no further activity occurs on this thread within the next 3 days, the issue will automatically be closed.
Thanks so much for your help!
sailsbot
on 25 Jul 2017
Heel, @sailsbot? 😀
Can't remove the label though.
richdunajewski
on 25 Jul 2017
Would love to see results on this one
 luislobo
on 29 Jul 2017
luislobo
on 29 Jul 2017
@luislobo Working on this today <cracks knuckles>
sgress454
on 3 Aug 2017
Awesome :D let me know if you need testing or something
luislobo
on 3 Aug 2017
Ok -- so far with Node 6.11.0 on OS X, I'm unable to reproduce. See screenshot below of a 35-minute trial using the setup described above. Trying Node 4.4.3 now.
sgress454
on 4 Aug 2017
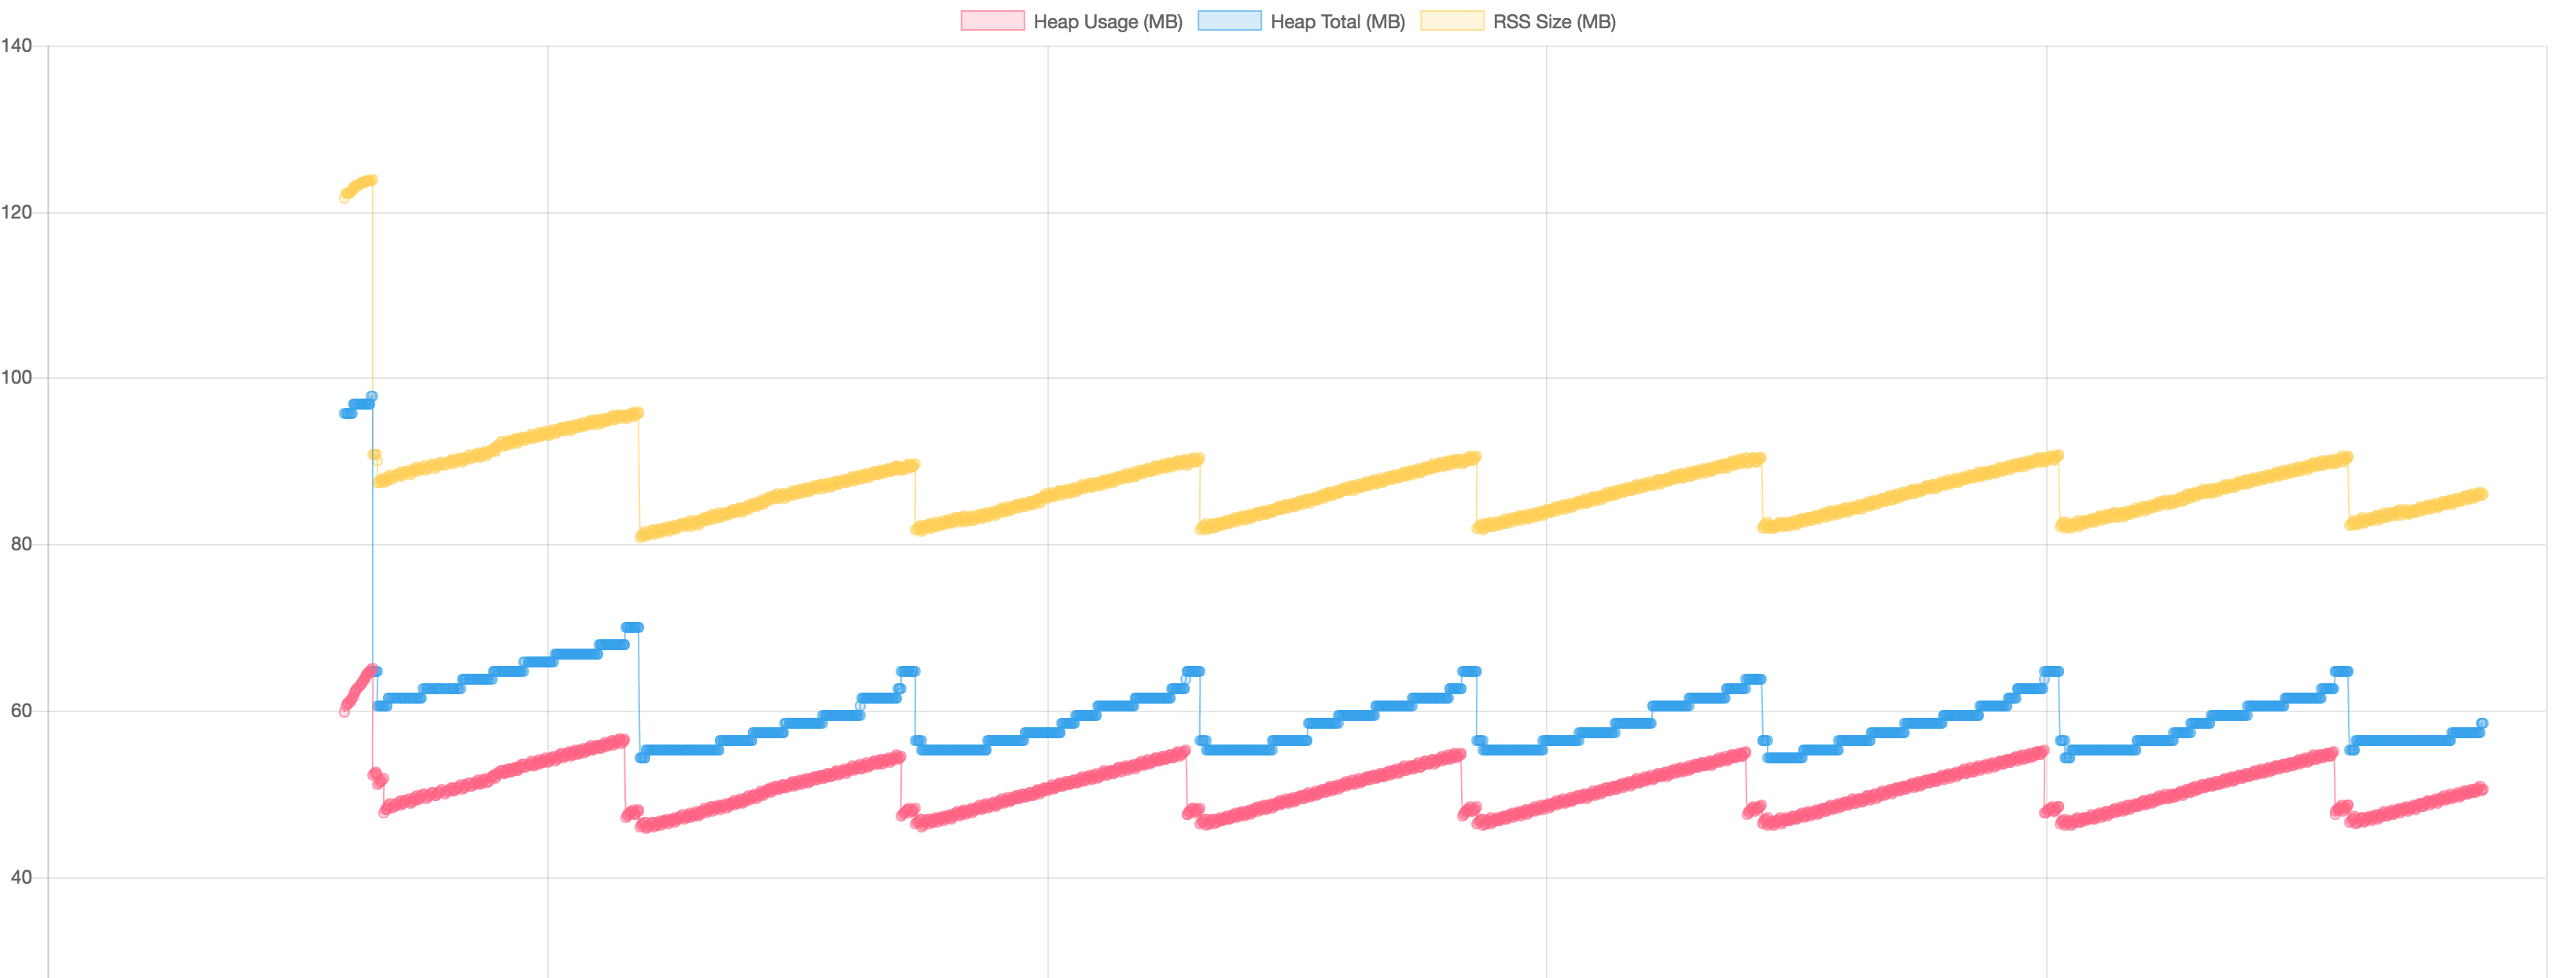
Update: the Node version does seem to factor heavily. I modified the test somewhat so that the Sails app uses sails.sockets.blast() to send down the memory info every 10 seconds, and the front end hits a /noop route every 100ms that just returns res.ok(). I did this to try to control for the process.memoryUsage() call in the test. In 6.11.0 the graph looks like this:
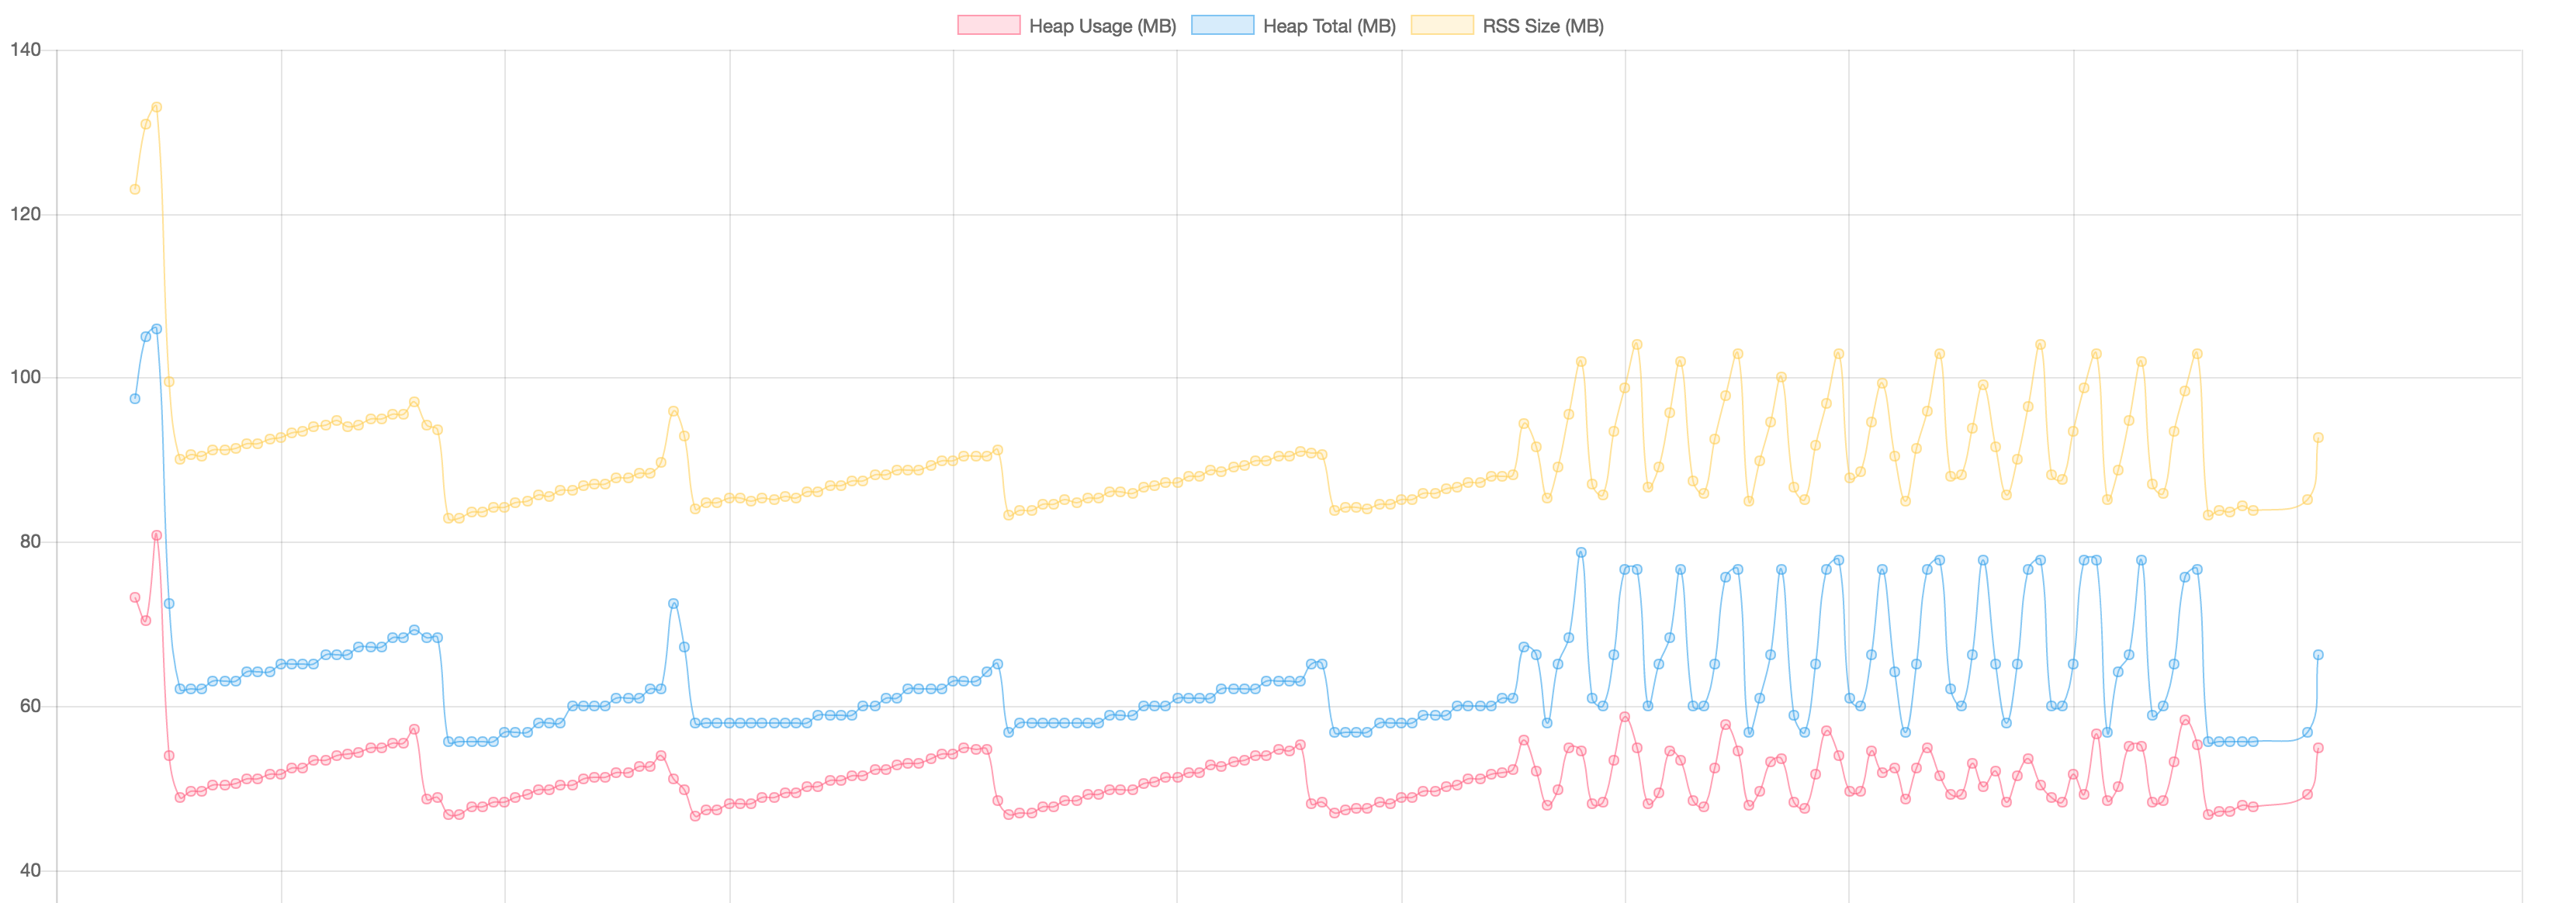
That weird rollercoaster towards the end notwithstanding, memory usage is stable. In 4.4.3, we get:

YIKES.
sgress454
on 4 Aug 2017
Hooray for not being crazy! 😁
Thanks for finally taking a look at this. Glad to see that there's hope in 6.x but we aren't there yet for production.
richdunajewski
on 4 Aug 2017
Update 2: I get a similar scary graph switching from socket requests to AJAX in 4.4.3. So I don't think this is socket related.
sgress454
on 4 Aug 2017
To me, it looked like an allocation issue first and foremost. Something in that logic is allocating a lot of memory and 4.4.3 isn't able to reclaim it, but 6.11.x seems to have no trouble. But even with Node 6, you can see the allocations are happening (steepness of the plots) but are being handled over time.
Maybe if there's evidence of that, fixing an allocation issue would make 4.4.3 behave as expected.
richdunajewski
on 4 Aug 2017
@richdunajewski After much staring at charts and twiddling of knobs, it looks like it comes down to the use of Lodash's _.bind() in the responses hook. It's being called on every custom response, during every request, and allocating memory faster than can be cleaned up, perhaps due to this v8 issue (which supposedly is worked around in Lodash, but maybe not enough?)
In any case, transitioning to native .bind fixes the issue for me, with the bonus of being about a zillion times more performant. If you have a chance, please try out the patch with:
npm install github://balderdashy/sails#0.12
Thanks again for your report, and for the chart.js script which was immensely helpful in tracking this down!
sgress454
on 8 Aug 2017
@sgress454 should we report this to lodash? Or is it already on mr. John dbl D's radar?
 snewell92
on 16 Aug 2017
snewell92
on 16 Aug 2017
@snewell92 Wellll considering we are using a forked copy of Lodash v3.10, I don't think he'd have too much interest in our issue. If someone can demonstrate the problem using Lodash 4 and Node 4.4.3, I encourage them to post about it, but having solved this for Sails I am passing the baton. @richdunajewski and I have done enough. :grimacing:
sgress454
on 17 Aug 2017
@richdunajewski,@sailsbot,@simonmilz,@sgress454,@luislobo,@snewell92: Hello, I'm a repo bot-- nice to meet you!
It has been 30 days since there have been any updates or new comments on this page. If this issue has been resolved, feel free to disregard the rest of this message and simply close the issue if possible. On the other hand, if you are still waiting on a patch, please post a comment to keep the thread alive (with any new information you can provide).
If no further activity occurs on this thread within the next 3 days, the issue will automatically be closed.
Thanks so much for your help!
sailsbot
on 17 Sep 2017
Related issues
 thomasfr
·
3Comments
thomasfr
·
3Comments
 radoslavpetranov
·
4Comments
radoslavpetranov
·
4Comments
 visitsb
·
4Comments
visitsb
·
4Comments
 edy
·
4Comments
edy
·
4Comments
 danil-z
·
3Comments
danil-z
·
3Comments
Most helpful comment
@snewell92 Wellll considering we are using a forked copy of Lodash v3.10, I don't think he'd have too much interest in our issue. If someone can demonstrate the problem using Lodash 4 and Node 4.4.3, I encourage them to post about it, but having solved this for Sails I am passing the baton. @richdunajewski and I have done enough. :grimacing: