Runtime: __pthread_mutex_lock: Assertion `mutex->__data.__owner == 0' failed. running DirectoryServices tests on Linux coreclr
Not much to go on --
Libraries Test Run release coreclr Linux x64 Debug
(Fedora.30.Amd64.Open)ubuntu.1604.amd64.[email protected]/dotnet-buildtools/prereqs:fedora-30-helix-20200512010621-4f8cef7.
    System.DirectoryServices.Protocols.Tests.DirectoryServicesProtocolsTests.TestAddUser [SKIP]
      Condition(s) not met: "IsLdapConfigurationExist"
dotnet: ../nptl/pthread_mutex_lock.c:79: __pthread_mutex_lock: Assertion `mutex->__data.__owner == 0' failed.
./RunTests.sh: line 161:  2035 Aborted                 "$RUNTIME_PATH/dotnet" exec --runtimeconfig System.DirectoryServices.Protocols.Tests.runtimeconfig.json --depsfile System.DirectoryServices.Protocols.Tests.deps.json xunit.console.dll System.DirectoryServices.Protocols.Tests.dll -xml testResults.xml -nologo -nocolor -notrait category=IgnoreForCI -notrait category=OuterLoop -notrait category=failing $RSP_FILE
~/work/B45D097D/w/B56E0989/e
----- end Tue Jul 7 05:00:01 UTC 2020 ----- exit code 134 ----------------------------------------------------------
exit code 134 means SIGABRT Abort. Managed or native assert, or runtime check such as heap corruption, caused call to abort(). Core dumped.
Looking around for any Linux dump...
... found no dump in /home/helixbot/work/B45D097D/w/B56E0989/e
@davidfowl where are we at with collecting dump files? 😃
 danmosemsft
All 52 comments
Note this was a PR job, I'm guessing the changes are not relevant, but here they are: https://github.com/dotnet/runtime/pull/38696/files
danmosemsft
on 9 Jul 2020
Uh, this assert is in glibc itself. I guess this is not actionable without a stack/dump/repro.
danmosemsft
on 9 Jul 2020
danmosemsft
on 9 Jul 2020
This is most likely caused by a memory corruption caused by directory services code. Linux implementation of System.DirectoryServices.Protocols is very recent and it has a lot of unmanaged interop.
 jkotas
on 9 Jul 2020
jkotas
on 9 Jul 2020
Ah -- good point. @joperezr .. maybe worth trying to stress these tests in this configuration?
danmosemsft
on 9 Jul 2020
Also if others hit this - please addref this issue, particularly if it's a different configuration. That could be a clue.
danmosemsft
on 9 Jul 2020
I've not seen that particular symptom, but I just got this, which could be releated if it's memory corruption:
https://dev.azure.com/dnceng/public/_build/results?buildId=723229&view=logs&jobId=73b7db51-6fbc-594d-25c9-15b2737b0bf6
/root/helix/work/workitem /root/helix/work/workitem
Discovering: System.DirectoryServices.Protocols.Tests (method display = ClassAndMethod, method display options = None)
Discovered: System.DirectoryServices.Protocols.Tests (found 343 of 369 test cases)
Starting: System.DirectoryServices.Protocols.Tests (parallel test collections = on, max threads = 2)
./RunTests.sh: line 161: 22 Segmentation fault (core dumped) "$RUNTIME_PATH/dotnet" exec --runtimeconfig System.DirectoryServices.Protocols.Tests.runtimeconfig.json --depsfile System.DirectoryServices.Protocols.Tests.deps.json xunit.console.dll System.DirectoryServices.Protocols.Tests.dll -xml testResults.xml -nologo -nocolor -notrait category=IgnoreForCI -notrait category=OuterLoop -notrait category=failing $RSP_FILE
/root/helix/work/workitem
----- end Thu Jul 9 21:07:22 UTC 2020 ----- exit code 139 ----------------------------------------------------------
exit code 139 means SIGSEGV Illegal memory access. Deref invalid pointer, overrunning buffer, stack overflow etc. Core dumped.
 stephentoub
on 10 Jul 2020
stephentoub
on 10 Jul 2020
Potentially related timeout https://helix.dot.net/api/2019-06-17/jobs/d8f40f25-1389-417c-851a-660aa67a8f23/workitems/System.DirectoryServices.Protocols.Tests/console :
/root/helix/work/correlation/dotnet exec --runtimeconfig System.DirectoryServices.Protocols.Tests.runtimeconfig.json --depsfile System.DirectoryServices.Protocols.Tests.deps.json xunit.console.dll System.DirectoryServices.Protocols.Tests.dll -xml testResults.xml -nologo -nocolor -notrait category=IgnoreForCI -notrait category=OuterLoop -notrait category=failing
popd
===========================================================================================================
/root/helix/work/workitem /root/helix/work/workitem
Discovering: System.DirectoryServices.Protocols.Tests (method display = ClassAndMethod, method display options = None)
Discovered: System.DirectoryServices.Protocols.Tests (found 343 of 369 test cases)
Starting: System.DirectoryServices.Protocols.Tests (parallel test collections = on, max threads = 4)
...
[EXECUTION TIMED OUT]
Exit Code:-3Executor timed out after 1800 seconds and was killed
Stephen's is (Alpine.312.Amd64.Open)[email protected]/dotnet-buildtools/prereqs:alpine-3.12-helix-20200602002622-e06dc59.. -- is that Ubuntu on Alpine host?
Jan's says Docker image mcr.microsoft.com/dotnet-buildtools/prereqs:alpine-3.12-helix-arm64v8-20200602002604-25f8a3e
Original is (Fedora.30.Amd64.Open)[email protected]/dotnet-buildtools/prereqs:fedora-30-helix-20200512010621-4f8cef7. I don't know how to read these.
[edit] The part after the @ is the container.
danmosemsft
on 10 Jul 2020
Still blocked on vstest support in runtime
 davidfowl
on 10 Jul 2020
davidfowl
on 10 Jul 2020
What is vstest going to do specifically to help with process crashing with segmentation fault?
jkotas
on 10 Jul 2020
That one may be as simple as needing ulimit -c unlimited. @davidfowl is championing dumps working in all cases, all OS'es. I know for hangs it needed vstest support.
danmosemsft
on 10 Jul 2020
Ah for segfaults I believe helix already sets ulimit -c. Hangs are where VSTest is needed (mostly because it has the plumbing)
davidfowl
on 10 Jul 2020
@mattgal are there instructions somewhere to help me see whether we have now gotten a dumpfile since my change?
If I click on History in AzDo I just get this, I don't see a way to get details:
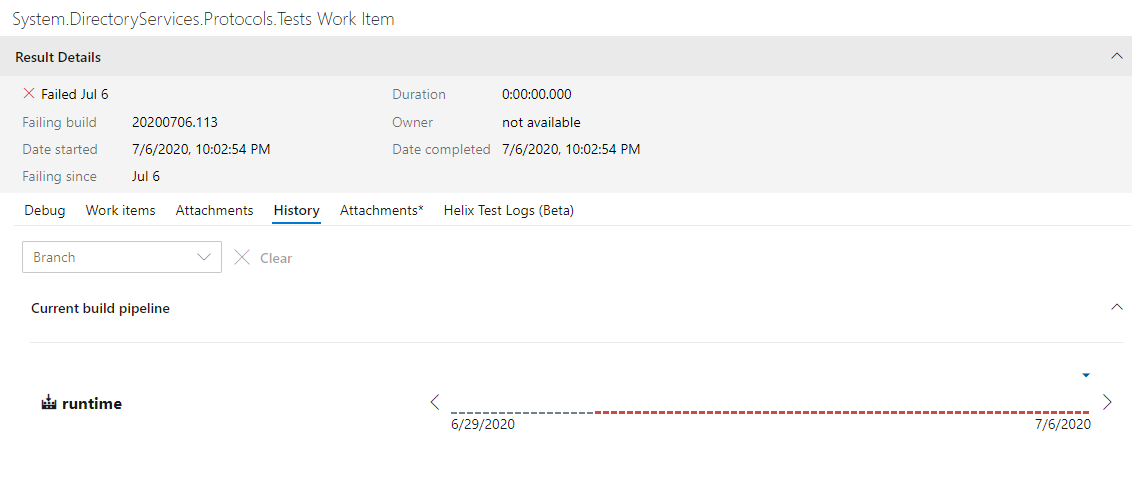
danmosemsft
on 30 Jul 2020
@danmosemsft I don't think there's specific instructions but since you have Kusto Access, this query gives you 32 dumps since 7/6
let jobs = Jobs
| where Queued > ago (24d)
| where Source == "ci/public/dotnet/runtime/refs/heads/master"
| project Name;
let instancesOfThatWorkItem = WorkItems
| where JobName in (jobs)
| where FriendlyName == "System.DirectoryServices.Protocols.Tests"
| project WorkItemId;
Files
| where WorkItemId in (instancesOfThatWorkItem)
| where FileName startswith "core." or FileName endswith ".dmp"
| order by JobId desc
I'll also email you the list of URLs from this query.
 MattGal
on 31 Jul 2020
MattGal
on 31 Jul 2020
Thanks. Do you believe it's possible to get any of this through the azdo UI itself?
danmosemsft
on 31 Jul 2020
yes, but not in bulk like we can with Kusto. All files associated with a failed work item show up on the individual run's special Helix tab.
MattGal
on 31 Jul 2020
Right, but in the Azdo UI, could I theoretically have navigated to a single recent failing "System DirectoryServices Protocols Work Item"? It felt like that should be a click away from that history graph in the pic above, and probably I'd quickly find a dump doing that.
(I can't get there right now -- getting an error from the page when I click history)
danmosemsft
on 31 Jul 2020
Still reproducing in https://github.com/dotnet/runtime/pull/41753
https://helixre107v0xdeko0k025g8.blob.core.windows.net/dotnet-runtime-refs-pull-41753-merge-2af03627976d4a0e90/System.DirectoryServices.Protocols.Tests/console.b857dc64.log?sv=2019-02-02&se=2020-09-22T23%3A41%3A08Z&sr=c&sp=rl&sig=rlEe4KUr1980kVhPuLNk3GLyPlJ17N17jB6rJcGPPuo%3D
https://dev.azure.com/dnceng/public/_build/results?buildId=799437&view=ms.vss-test-web.build-test-results-tab&runId=25303434&resultId=181787&paneView=dotnet-dnceng.dnceng-build-release-tasks.helix-test-information-tab
 ericstj
on 3 Sep 2020
ericstj
on 3 Sep 2020
For what it's worth that was on net5.0-Linux-Debug-x64-CoreCLR_release-Ubuntu.1804.Amd64.Open
danmosemsft
on 3 Sep 2020
I was able to run @MattGal's query and found 22 dumps from the 14 days after this fix went in. Can share them over mail/teams for anyone interested. My dump analysis expertise is rough on linux 😞
ericstj
on 3 Sep 2020
@ericstj is that 22 dumps where this still reproed? I believe that the querythat MattGal shared was to find dumps where the workitem failed but that isn’t necessarily for this reason.
 joperezr
on 3 Sep 2020
joperezr
on 3 Sep 2020
@MattGal I tried to modify your query to include what Queue the dump came from (since I'm also curious whether Ubuntu 1804 is ever giving us dumps) and ended up adding some joins, sorry:
| where Queued > ago (24d)
| where Source == "ci/public/dotnet/runtime/refs/heads/master"
| project Name, QueueName
| join WorkItems on $left.Name == $right.JobName
| where Status != "Pass"
| where FriendlyName == "System.DirectoryServices.Protocols.Tests"
| join Files on WorkItemId
| where FileName startswith "core." or FileName endswith ".dmp"
| order by JobId desc
That gives me only 1 and it's on ubuntu.1604.amd64.open. Does this query look right?
danmosemsft
on 3 Sep 2020
@danmosemsft that dump is from before the fix went in (8-13). Modify | where Queued to > ago (14d)
For the dumps that I spot checked most were OSX.
ericstj
on 3 Sep 2020
Interesting, so digging in more to some of these dumps and they all appear to be something else. They are all for "passed" test work items. So for some reason helix found a dump on the machine but it seems to be unrelated to the test execution. My count of 22 dumps is a false alarm. We actually have 0 from after the fix went in.
ericstj
on 3 Sep 2020
So no dumps from CI.
Starting: System.DirectoryServices.Protocols.Tests (parallel test collections = on, max threads = 2)
Assert failure(PID 26726 [0x00006866], Thread: 26743 [0x6877]): IsExecutingOnAltStack() || (curSP <= m_pFrame && m_pFrame < m_CacheStackBase) || m_pFrame == (Frame*) -1
File: /__w/1/s/src/coreclr/src/vm/threads.h Line: 1852
Image: /home/helixbot/work/A48C09B0/p/dotnet
I'm now looking at PR failures and some have dumps. So far most have different failures (either various asserts or seg faults). Trying to get some characteristic ones to follow up.
ericstj
on 3 Sep 2020
Here's a failing PR: https://github.com/dotnet/runtime/pull/41659 with dump: https://dev.azure.com/dnceng/public/_build/results?buildId=797340&view=ms.vss-test-web.build-test-results-tab&runId=25319990&resultId=181726&paneView=attachments
----- end Thu Sep 3 07:21:09 UTC 2020 ----- exit code 139 ----------------------------------------------------------
exit code 139 means SIGSEGV Illegal memory access. Deref invalid pointer, overrunning buffer, stack overflow etc. Core dumped.
Interesting, so digging in more to some of these dumps and they all appear to be something else. They are all for "passed" test work items. So for some reason helix found a dump on the machine but it seems to be unrelated to the test execution. My count of 22 dumps is a false alarm. We actually have 0 from after the fix went in.
Good point; we leave these in and upload no matter what because they add context.
MattGal
on 3 Sep 2020
@safern showed me the nifty site @jaredpar is putting up for runfo that's a bit easier to use than handcrafting kusto queries:
https://runfo.azurewebsites.net/search/tests/?bq=definition:runtime+count:1000&tq=name:%22system.directoryservices%22
We've got 3 dumps here (including one I linked above).
ericstj
on 3 Sep 2020
Good point; we leave these in and upload no matter what because they add context.
Can you say more @MattGal ? I mean, if we send a test job to a machine, don't we want that machine to be "clean"?
danmosemsft
on 4 Sep 2020
@joperezr helped look at the dump and found:
OS Thread Id: 0x29 (13)
Child SP IP Call Site
00007F14ACBAB1C0 00007f14acedce4f [InlinedCallFrame: 00007f14acbab1c0] Interop.ldap_init(System.String, Int32)
00007F14ACBAB1C0 00007f14dead23e6 [InlinedCallFrame: 00007f14acbab1c0] Interop.ldap_init(System.String, Int32)
00007F14ACBAB1B0 00007F14DEAD23E6 ILStubClass.IL_STUB_PInvoke(System.String, Int32)
00007F14ACBAB2B0 00007F14DEAD206B System.DirectoryServices.Protocols.LdapConnection.InternalInitConnectionHandle(System.String)
00007F14ACBAB300 00007F14DEAD1C35 System.DirectoryServices.Protocols.LdapConnection.Init()
00007F14ACBAB400 00007F14DEAD168D System.DirectoryServices.Protocols.LdapConnection..ctor(System.DirectoryServices.Protocols.LdapDirectoryIdentifier, System.Net.NetworkCredential, System.DirectoryServices.Protocols.AuthType)
00007F14ACBAB500 00007F14DEAD10BA System.DirectoryServices.Protocols.LdapConnection..ctor(System.DirectoryServices.Protocols.LdapDirectoryIdentifier)
00007F14ACBAB520 00007F14DEAD0819 System.DirectoryServices.Protocols.LdapConnection..ctor(System.String)
00007F14ACBAB550 00007F14DEAD21AA System.DirectoryServices.Protocols.Tests.LdapConnectionTests.SendRequest_Disposed_ThrowsObjectDisposedException()
00007F14ACBAB810 00007f1557f20de7 [DebuggerU2MCatchHandlerFrame: 00007f14acbab810]
From https://www.openldap.org/software//man.cgi?query=ldap_init&sektion=3&apropos=0&manpath=OpenLDAP+2.4-Release we see
Note: the first call into the LDAP library also initializes the global
options for the library. As such the first call should be single-
threaded or otherwise protected to insure that only one call is active.
It is recommended that ldap_get_option() or ldap_set_option() be used
in the program's main thread before any additional threads are created.
See ldap_get_option(3).
We have no affordance for this initial single-threaded call. So the current theory is that we're hitting this occasionally due to test concurrency.
So next steps will be to force a repro by trying to trigger concurrent calls, then add an a static single init call to the library (either static ctor, or lazy init static field) to ensure single threaded initialization.
ericstj
on 4 Sep 2020
Hurray for dumps from test runs. Did you end up using dotnet dump to view it?
danmosemsft
on 4 Sep 2020
Yes, but it was @joperezr that did it. I tried dotnet-dump on my windows machine and it got
Failed to load data access module, 0x80131c64
Can not load or initialize mscordaccore.dll. The target runtime may not be initialized.
@joperezr had success running on linux VM
ericstj
on 4 Sep 2020
What version of dotnet dump was that? I would expect and want that to work (opening dump on Windows with dotnet dump that was collected on Linux). cc @mikem8361
danmosemsft
on 4 Sep 2020
The latest version is 3.1.141901. You can update with dotnet tool update -g dotnet-dump. The sosstatus command is useful (to me) diagnostics for these kind of failures.
 mikem8361
on 4 Sep 2020
mikem8361
on 4 Sep 2020
What version of dotnet dump was that?
3.1.141901, https://github.com/dotnet/diagnostics/blob/master/documentation/FAQ.md gives me some indication of what I need. I suspect I need to find the windows DAC from this PR build and point to it.
sosstatuscommand is useful
Target platform: 8664 Context size 04d0
.NET Core (Unix) runtime at 00007F1557BB6000 size 006bc000
Cache: C:\Users\ericstj\AppData\Local\Temp\SymbolCache
Server: http://msdl.microsoft.com/download/symbols/
But this was a Linux dump, right? I undrestood the DAC is resolved with the symbols - or should be in the payload if you pull that down. Either way, being on Windows and Linux should give the same result, right @mikem8361 ?
danmosemsft
on 4 Sep 2020
Yes, that is probably it. The Windows cross-OS DAC is published yet to the symbol server. So you need to manually download it and use setclrpath to point to the directory it is in.
mikem8361
on 4 Sep 2020
How can we get these published with the symbols? Is there an issue tracking that?
danmosemsft
on 4 Sep 2020
I don't think symbols or the DACs (in this case the cross-OS DAC), etc. are published to the symbol servers if this is a PR CI build. They are only published at the end of an official builds. I'm not sure of the details. @hoyosjs or @sdmaclea may know.
mikem8361
on 4 Sep 2020
Can we include it as part of the testhost for PR/CI?
 safern
on 4 Sep 2020
safern
on 4 Sep 2020
Hmm, I downloaded the CoreCLR windows binaries from the PR build I extracted and setclrpath to the extracted ZIP.
Now I get
> setclrpath C:\Users\ericstj\Downloads\DS.P-dump\CoreCLRProduct__Windows_NT_x64_release
Set load path for DAC/DBI to 'C:\Users\ericstj\Downloads\DS.P-dump\CoreCLRProduct__Windows_NT_x64_release'
> clrstack
Failed to load data access module, 0x80131c4f
You can run the debugger command 'setclrpath <directory>' to control the load of mscordaccore.dll.
If that succeeds, the SOS command should work on retry.
For more information see https://go.microsoft.com/fwlink/?linkid=2135652
> sosstatus
Target platform: 8664 Context size 04d0
Runtime module path: C:\Users\ericstj\Downloads\DS.P-dump\CoreCLRProduct__Windows_NT_x64_release
.NET Core (Unix) runtime at 00007F1557BB6000 size 006bc000
Runtime directory: C:\Users\ericstj\Downloads\DS.P-dump\CoreCLRProduct__Windows_NT_x64_release
DAC file path: C:\Users\ericstj\Downloads\DS.P-dump\CoreCLRProduct__Windows_NT_x64_release\mscordaccore.dll
Cache: C:\Users\ericstj\AppData\Local\Temp\SymbolCache
Server: http://msdl.microsoft.com/download/symbols/
0x80131c4f is https://github.com/dotnet/runtime/blob/29e9b5b7fd95231d9cd9d3ae351404e63cbb6d5a/src/coreclr/src/inc/corerror.xml#L2168-L2172
Did I choose the wrong binaries?
ericstj
on 4 Sep 2020
The DAC in that directory is the Windows DAC for Windows dump not the cross-OS Linux DAC. I'm not sure where the cross-OS DAC is in the artifacts or whether it is built in a PR CI at all. @hoyosjs/@sdmaclea may know.
mikem8361
on 4 Sep 2020
cc @hoyosjs (didn't seem to highlight above)
danmosemsft
on 4 Sep 2020
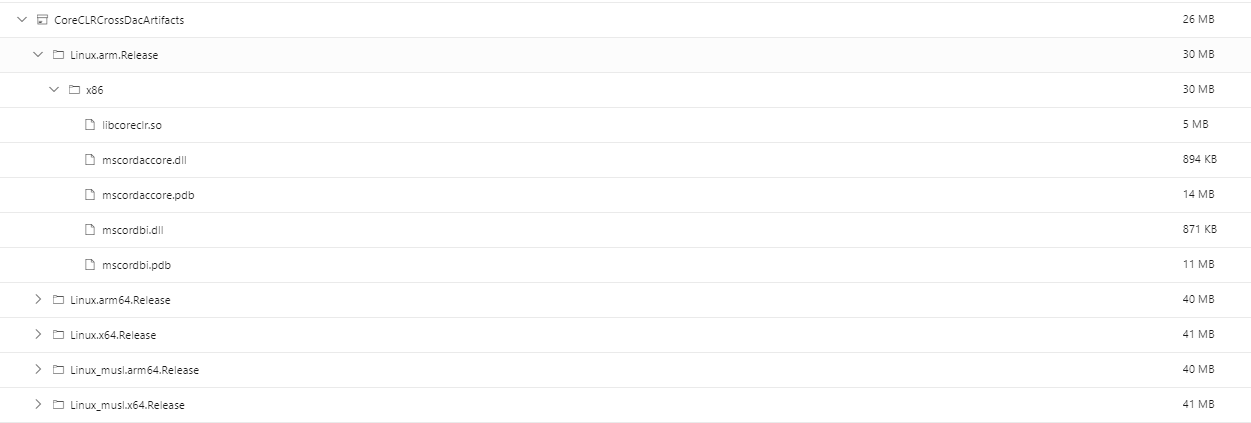
The Cross OS DAC gets built in CI, but there's nothing that uses it so I never published it on non-official builds. It just seemed like added time for PR builds and even more asset upload. Given that we could use them for things like this, I guess it was short sighted and overly optimizing. I've opened #41852 so that it ends up in the artifacts for a pipeline under a container named CoreCLRCrossDacArtifacts:
It should work as-is on WinDBG if on the same directory. Recent previews of VS should work but there was a bug (RC1 doesn't have the fix, RC2 should have it), so it will work on builds after today more or less. We do index the Cross DAC fully signed and all the symbols, but it won't help as these are PR builds.
 hoyosjs
on 4 Sep 2020
hoyosjs
on 4 Sep 2020
Can I use a “close enough” official build of it to analyze the PR dump or does it need to be exact match?
ericstj
on 4 Sep 2020
Got it to work! Close enough was good enough in this case. I went and found a daily build that was close to the hash of head for this PR. I downloaded it's CoreCLRCrossDacArtifacts zip and extracted to a folder. At first it didn't work because it had previously loaded the "wrong" windows/windows DAC and refused to reload the new windows/linux-x64 DAC. After restarting dotnet-dump I was in business:
C:\Debuggers>dotnet-dump analyze C:\Users\ericstj\Downloads\DS.P-dump\core.1000.24
Loading core dump: C:\Users\ericstj\Downloads\DS.P-dump\core.1000.24 ...
Ready to process analysis commands. Type 'help' to list available commands or 'help [command]' to get detailed help on a command.
Type 'quit' or 'exit' to exit the session.
> setclrpath C:\Users\ericstj\Downloads\DS.P-dump\CoreCLRCrossDacArtifacts\Linux.x64.Release\x64
Set load path for DAC/DBI to 'C:\Users\ericstj\Downloads\DS.P-dump\CoreCLRCrossDacArtifacts\Linux.x64.Release\x64'
> clrstack
OS Thread Id: 0x29 (13)
        Child SP               IP Call Site
00007F14ACBAB1C0 00007f14acedce4f [InlinedCallFrame: 00007f14acbab1c0] Interop.ldap_init(System.String, Int32)
00007F14ACBAB1C0 00007f14dead23e6 [InlinedCallFrame: 00007f14acbab1c0] Interop.ldap_init(System.String, Int32)
00007F14ACBAB1B0 00007F14DEAD23E6 ILStubClass.IL_STUB_PInvoke(System.String, Int32)
00007F14ACBAB2B0 00007F14DEAD206B System.DirectoryServices.Protocols.LdapConnection.InternalInitConnectionHandle(System.String)
I have to say, this is an awesome feature. I really look forward to being able to use this more.
ericstj
on 4 Sep 2020
Where we want to get to (our vision 😃 ) is that I can go to the test failure and click a link and it will essentially pull down everything and open it in the debugger for me with everything resolved. This is the experience for Microsoft devs looking at Watson bugs - after resolving symbols it even triggers !analyze for you. I would like this to work even if I'm viewing the test results on Windows, and it's a Unix failure. So this is all promising.
danmosemsft
on 4 Sep 2020
I can go to the test failure and click a link and it will essentially pull down everything and open it in the debugger for me with everything resolved.
I was thinking of the same. I love the idea. One thing I can imagine will be tricky here is the current workflow appears to require downloading and executing a binary produced by the PR build. That could be a bit sketchy as we don't typically trust executing the code in PRs on our dev machines. I wonder if we could have a workflow that was more permissive and only ran trusted code 🤔
ericstj
on 4 Sep 2020
- “close enough” official build
- Got it to work!
- One thing I can imagine will be tricky here is the current workflow appears to require downloading and executing a binary produced by the PR build.
It is not accidental that close enough worked for the cross DAC. #32331 was implemented specifically to make this work more often (as well as for the single file longer term project.)
@noahfalk has suggested that the runtime data structures this depends on change rarely, They are in tricky places in the runtime. Few people touch them....
That said, I think we would guess "close enough" should work > 99% of the time.
I went and found a daily build that was close to the hash of head for this PR
The closest daily matching build would minimize the outages..
It might be easier to use the Cross DAC's matching the current SDK the runtime is building with.
We could probably add some testing to see if the SDK signed DAC will work with libcoreclr built by the PR.
If we start using this for PR dump debugging, we get the nice dogfooding testing to help make this more reliable.
 sdmaclea
on 4 Sep 2020
sdmaclea
on 4 Sep 2020
Reopen for port to RC2
ericstj
on 8 Sep 2020
ericstj
on 9 Sep 2020
Related issues
 jamesqo
·
3Comments
jamesqo
·
3Comments
 noahfalk
·
3Comments
noahfalk
·
3Comments
 omariom
·
3Comments
omariom
·
3Comments
 jzabroski
·
3Comments
jzabroski
·
3Comments
 btecu
·
3Comments
btecu
·
3Comments
Most helpful comment
Got it to work! Close enough was good enough in this case. I went and found a daily build that was close to the hash of head for this PR. I downloaded it's CoreCLRCrossDacArtifacts zip and extracted to a folder. At first it didn't work because it had previously loaded the "wrong" windows/windows DAC and refused to reload the new windows/linux-x64 DAC. After restarting dotnet-dump I was in business:
I have to say, this is an awesome feature. I really look forward to being able to use this more.