Runtime: All IL_STUB_PInvokes end up with the same name
When profiling an app, I end up seeing a lot of "dynamicClass::IL_STUB_PInvoke" methods, and in some cases it can be difficult to discern with what DllImport they're associated:
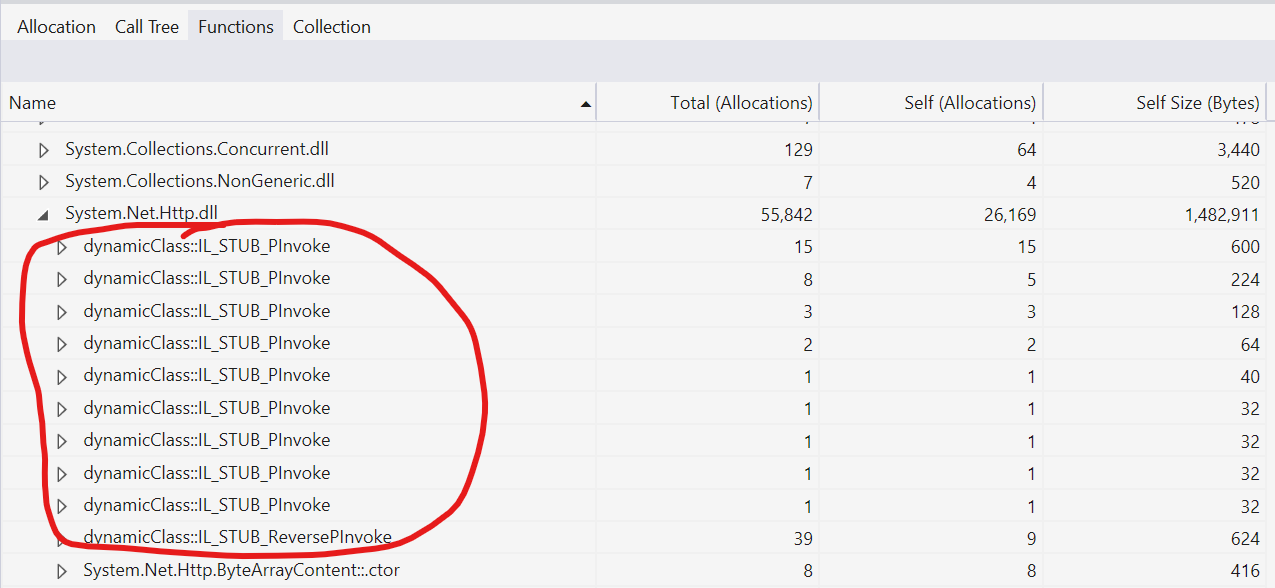
Can we do a better job at naming them, in such a way where at least some aspect of the proxied method's name is included in the stub's name?
 stephentoub
All 16 comments
They are shared by all PInvokes with the same signature in the current CoreCLR interop implementation. There is no good name to use.
We can include the signature in the name, but I am not sure whether it would help much and it would make the name really long. I assume that the signature is one click away in the profiler.
 jkotas
on 18 Feb 2020
jkotas
on 18 Feb 2020
I assume that the signature is one click away in the profiler.
Not in the VS allocation profiler. At least currently the signature is nowhere to be found.
cc: @karpinsn
stephentoub
on 18 Feb 2020
@stephentoub That should be easy for the profiler team to do if the reported JIT event contains details about the allocating frame being a P/Invoke stub. Otherwise string compare will need to ensue 😞
 AaronRobinsonMSFT
on 19 Feb 2020
AaronRobinsonMSFT
on 19 Feb 2020
@stephentoub Now that I think about this. I thought the VS Profiler would take you back to the calltree from a function entry? If I recall there was discussion about which node in the calltree to take the user back to though so we may have disabled/removed that option.
In the event there was an option to go back to the calltree do you have any thoughts on which node in the tree would be desirable?
AaronRobinsonMSFT
on 19 Feb 2020
@AaronRobinsonMSFT, there's a "View in Call Tree" option that will bring you back to the method that uses the P/Invoke. From there it's up to you to figure out which P/Invoke was called, based on things like what types it allocated (e.g. "it allocated SafeXyzHandle, so it's probably P/Invoke Abc"). If the P/Invoke method itself was shown in the call tree, that would be a good stop gap. Even better would be if the stub method were replaced by the P/Invoke in the relevant views, since "IL_STUB_Pinvoke" doesn't give you much to go on, and navigating away from a view every time you want to figure out what something is called isn't very productive.
stephentoub
on 19 Feb 2020
@stephentoub Gotcha. I'm not sure we provide the specific information about the P/Invoke name from the ETW JIT events. The VS Profiler does do some metadata scraping though so this might be yet more data that will need to be collected by them.
AaronRobinsonMSFT
on 19 Feb 2020
Thanks, @AaronRobinsonMSFT. This is all "nice to have"... I can generally figure things out, it's just not as easy as I'd hope :smile:
stephentoub
on 19 Feb 2020
PerfView does show signatures for PInvoke stubs:
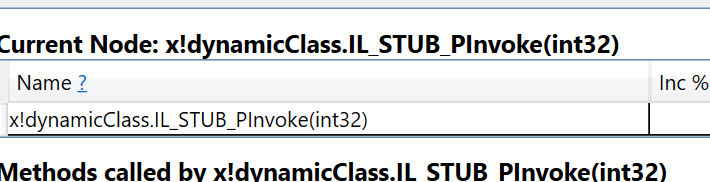
It means that the ETW trace should have the signature information.
jkotas
on 19 Feb 2020
PerfView does show signatures for PInvoke stubs
Cool. @karpinsn, consider doing the same on my request list for the tool :smile:
stephentoub
on 19 Feb 2020
Yeah, I'll add it to the backlog. We are working on switching the .NET Alloc analyzer to utilize TraceEvent instead of InfoSources, once that is done we can see what PerfView is doing to extract the signature. It would be nice if we could also just hide the PInvoke stub with the JMC case and maybe just show the native call with a [PInvoke] prefix.
 karpinsn
on 19 Feb 2020
karpinsn
on 19 Feb 2020
@karpinsn I would also consider improving the scenario by collecting the additional metadata from on-disk. As @jkotas points out, the argument type must be in the event but the real name isn't emitted and will only be known in the on-disk metadata or hidden in an internal runtime data structure - boo.
AaronRobinsonMSFT
on 19 Feb 2020
@AaronRobinsonMSFT Yeah I want to be careful about this though as we don't have that same opportunity on Linux. It would be awesome if there was some PInvoke event that emitted the DLLImport information, I haven't looked yet so maybe there is.
karpinsn
on 19 Feb 2020
@AaronRobinsonMSFT and I chatted offline and it turns out there is such an ETW event, The ILStubGenerated event. We will see what it takes to consume this and pretty up the calltree building.
karpinsn
on 19 Feb 2020
That's great, thanks! @karpinsn, you have this tracked in your own system, right? If so, since it sounds like nothing further is needed from the runtime here, I can close this.
stephentoub
on 19 Feb 2020
@stephentoub I believe this can be closed, but I think @karpinsn is going to POC just in case I am missing something with what data the VS Profiler needs to handle the issue.
AaronRobinsonMSFT
on 19 Feb 2020
Sounds good. We can always re-open this. Thanks.
stephentoub
on 19 Feb 2020
Related issues
 omariom
·
3Comments
omariom
·
3Comments
 matty-hall
·
3Comments
matty-hall
·
3Comments
 EgorBo
·
3Comments
EgorBo
·
3Comments
 omajid
·
3Comments
omajid
·
3Comments
 Timovzl
·
3Comments
Timovzl
·
3Comments
Most helpful comment
That's great, thanks! @karpinsn, you have this tracked in your own system, right? If so, since it sounds like nothing further is needed from the runtime here, I can close this.