Unfortunately my previous issue on threadpool starvation issues due to the json serializer turns out to be incorrect - the issue started happening again since the change to System.Text.Json.
This time we were able to capture dumps on 4 different occasions, and the only common thread stack trace that happens repeatedly across the dumps is something like this:
        Child SP               IP Call Site
00007F124A7FB780 00007fd5de0737ef [InlinedCallFrame: 00007f124a7fb780] Interop+Sys.WaitForSocketEvents(IntPtr, SocketEvent*, Int32*)
00007F124A7FB780 00007fd56bf3dfdb [InlinedCallFrame: 00007f124a7fb780] Interop+Sys.WaitForSocketEvents(IntPtr, SocketEvent*, Int32*)
00007F124A7FB770 00007FD56BF3DFDB ILStubClass.IL_STUB_PInvoke(IntPtr, SocketEvent*, Int32*)
00007F124A7FB800 00007FD56D77D25C System.Net.Sockets.SocketAsyncEngine.EventLoop()
00007F124A7FB850 00007FD56D77D219 System.Net.Sockets.SocketAsyncEngine+<>c.<.ctor>b__23_0(System.Object)
00007F124A7FB860 00007FD573B43AFC System.Threading.Tasks.Task.ExecuteWithThreadLocal(System.Threading.Tasks.Task ByRef, System.Threading.Thread)
00007F124A7FB8E0 00007FD563CB146B System.Threading.Tasks.ThreadPoolTaskScheduler+<>c.<.cctor>b__10_0(System.Object)
00007F124A7FB8F0 00007FD563C8544A System.Threading.ThreadHelper.ThreadStart(System.Object)
00007F124A7FBC60 00007fd5dd584d5f [GCFrame: 00007f124a7fbc60]
00007F124A7FBD30 00007fd5dd584d5f [DebuggerU2MCatchHandlerFrame: 00007f124a7fbd30]
Which when trying to investigate, lead me to this thread on twitter:
https://twitter.com/kookiz/status/1086229646872666113?lang=en

@benaadams I've seen you're part of the discussion in that thread, was there any progress / solution found for it? Or is this still a known issue of running netcore3 on Linux?
 theolivenbaum
All 17 comments
If it helps, here are the 4 stack traces we captured when the issue happened this morning:
clrstack-all-1.txt
clrstack-all-2.txt
clrstack-all-3.txt
clrstack-all-4.txt
theolivenbaum
on 10 Feb 2020
and the only common thread stack trace that happens repeatedly across the dumps is something like this:
This call is made on Linux to wait for socket events. It's expected you see this in the coredumps.
Try figuring out from the coredumps what is keeping busy the ThreadPool threads.
I've seen you're part of the discussion in that thread, was there any progress / solution found for it? Or is this still a known issue of running netcore3 on Linux?
I'm trying to understand how I/O threads and threadpool starvation are related.
Are there different priorities set for I/O threads vs threadpool threads?
 tmds
on 10 Feb 2020
tmds
on 10 Feb 2020
@benaadams I've seen you're part of the discussion in that thread, was there any progress / solution found for it? Or is this still a known issue of running netcore3 on Linux?
I see no obvious sign of threadpool starvation in your traces, but if you have doubts you can try using this custom version of the CLR: https://github.com/criteo-forks/source-build/releases/tag/v3.1.0-criteo1
It's stable (we use if in production) and it includes a fix for the starvation issue I ran into.
 kevingosse
on 10 Feb 2020
kevingosse
on 10 Feb 2020
The most suspicious stacktrace I see in your files is:
00007F1258D46218 00007fd5de46f00c [HelperMethodFrame: 00007f1258d46218]
00007F1258D46360 00007FD56EEF2C05 System.String.Ctor(System.ReadOnlySpan`1<Char>)
00007F1258D46390 00007FD573BBB07D System.Span`1[[System.Char, System.Private.CoreLib]].ToString()
00007F1258D463B0 00007FD573BBD01F System.Text.ValueStringBuilder.ToString()
00007F1258D463E0 00007FD573BC857C System.Number.FormatDouble(Double, System.String, System.Globalization.NumberFormatInfo)
00007F1258D46470 00007FD56EE7B701 System.Text.StringBuilder.AppendSpanFormattable[[System.Double, System.Private.CoreLib]](Double)
00007F1258D464E0 00007FD56EE78A6E LoggingAdvanced.Console.AdvancedConsoleLogger.WriteMessage(Microsoft.Extensions.Logging.LogLevel, System.String, System.String, System.Exception) [/src/Core.Graph/src/Logging/LoggingAdvanced/AdvancedConsoleLogger.cs @ 234]
00007F1258D46560 00007FD5764B4F14 LoggingAdvanced.Console.AdvancedConsoleLogger.Log[[Microsoft.Extensions.Logging.LoggerMessage+LogValues`2[[System.TimeSpan, System.Private.CoreLib],[System.DateTimeOffset, System.Private.CoreLib]], Microsoft.Extensions.Logging.Abstractions]](Microsoft.Extensions.Logging.LogLevel, Microsoft.Extensions.Logging.EventId, LogValues`2<System.TimeSpan,System.DateTimeOffset>, System.Exception, System.Func`3<LogValues`2<System.TimeSpan,System.DateTimeOffset>,System.Exception,System.String>)
00007F1258D465C0 00007FD5763C0A4D Microsoft.Extensions.Logging.Logger.<Log>g__LoggerLog|12_0[[Microsoft.Extensions.Logging.LoggerMessage+LogValues`2[[System.TimeSpan, System.Private.CoreLib],[System.DateTimeOffset, System.Private.CoreLib]], Microsoft.Extensions.Logging.Abstractions]](Microsoft.Extensions.Logging.LogLevel, Microsoft.Extensions.Logging.EventId, Microsoft.Extensions.Logging.ILogger, System.Exception, System.Func`3<LogValues`2<System.TimeSpan,System.DateTimeOffset>,System.Exception,System.String>, System.Collections.Generic.List`1<System.Exception> ByRef, LogValues`2<System.TimeSpan,System.DateTimeOffset> ByRef)
00007F1258D46630 00007FD576321391 Microsoft.Extensions.Logging.Logger.Log[[Microsoft.Extensions.Logging.LoggerMessage+LogValues`2[[System.TimeSpan, System.Private.CoreLib],[System.DateTimeOffset, System.Private.CoreLib]], Microsoft.Extensions.Logging.Abstractions]](Microsoft.Extensions.Logging.LogLevel, Microsoft.Extensions.Logging.EventId, LogValues`2<System.TimeSpan,System.DateTimeOffset>, System.Exception, System.Func`3<LogValues`2<System.TimeSpan,System.DateTimeOffset>,System.Exception,System.String>)
00007F1258D466A0 00007FD5764B4D97 Microsoft.Extensions.Logging.LoggerMessage+<>c__DisplayClass6_0`2[[System.TimeSpan, System.Private.CoreLib],[System.DateTimeOffset, System.Private.CoreLib]].<Define>g__Log|0(Microsoft.Extensions.Logging.ILogger, System.TimeSpan, System.DateTimeOffset, System.Exception)
00007F1258D46750 00007FD5764B4C80 Microsoft.Extensions.Logging.LoggerMessage+<>c__DisplayClass6_0`2[[System.TimeSpan, System.Private.CoreLib],[System.DateTimeOffset, System.Private.CoreLib]].<Define>b__1(Microsoft.Extensions.Logging.ILogger, System.TimeSpan, System.DateTimeOffset, System.Exception)
00007F1258D46790 00007FD5764B4C06 Microsoft.AspNetCore.Server.Kestrel.Core.Internal.Infrastructure.KestrelTrace.HeartbeatSlow(System.TimeSpan, System.DateTimeOffset)
00007F1258D467B0 00007FD56EE819BD System.Threading.ExecutionContext.RunInternal(System.Threading.ExecutionContext, System.Threading.ContextCallback, System.Object)
00007F1258D46800 00007FD56EEB88F6 System.Threading.TimerQueueTimer.CallCallback(Boolean)
00007F1258D46840 00007FD56EEB86C9 System.Threading.TimerQueueTimer.Fire(Boolean)
00007F1258D46890 00007FD56EE81D43 System.Threading.TimerQueue.FireNextTimers()
And various other callstacks all starting from a timer calling KestrelTrace.HeartbeatSlow and in turn spending time in your LoggingAdvanced.Console.AdvancedConsoleLogger.WriteMessage method. I don't know at what rate the heartbeat is triggered, but could it be that the messages are coming in faster that your logger can process them?
kevingosse
on 10 Feb 2020
It's stable (we use if in production) and it includes a fix for the starvation issue I ran into.
@kevingosse how did you fix the issue? Is there a patch/commit I can take a look at?
tmds
on 10 Feb 2020
It's stable (we use if in production) and it includes a fix for the starvation issue I ran into.
@kevingosse how did you fix the issue? Is there a patch/commit I can take a look at?
We ran into two issues because of the ways socket I/Os continuations are scheduled on Linux.
- The first one is that synchronous wait on I/Os suddenly become synchronous waits on threadpool operations, which causes starvation (whereas it was fine on Windows because it uses a dedicated threadpool for I/Os)
- The second one is a fairness issue, that I've mentioned here: https://github.com/dotnet/runtime/issues/14304#issuecomment-583272190
To fix this, we used our own dedicated threadpool to execute socket continuations: https://github.com/criteo-forks/corefx/commit/b9866614dbec8f422fe57d5e631def75b2f57a9b
It adds a bit of overhead, so I think a better solution would be to directly have the threads from the additional threadpool wait on epoll (like it's done with iocp on windows). I have yet to find the time to try that though.
I do believe it's unrelated to the issue @theolivenbaum is facing, so we probably should move to another thread if you want to discuss this further.
kevingosse
on 10 Feb 2020
The first one is that synchronous wait on I/Os suddenly become synchronous waits on threadpool operations, which causes starvation
To get in this case, the code is using an async Socket API, and then performs a synchronous wait. That's not good, but it does work on Windows.
tmds
on 10 Feb 2020
@kevingosse the logging calls are only appearing on some of the stack traces, so I don't think it's the issue - I'll investigate it nevertheless. There is no large amount of log messages being generated when this issue happens - and the heartbeat one is only triggered every second.
I'll give a try with your custom version of the CLR - is there any docs on how to switch to another CLR version?
theolivenbaum
on 10 Feb 2020
@kevingosse the logging calls are only appearing on some of the stack traces, so I don't think it's the issue - I'll investigate it nevertheless. There is no large amount of log messages being generated when this issue happens - and the heartbeat one is only triggered every second.
I'll give a try with your custom version of the CLR - is there any docs on how to switch to another CLR version?
Take the shared folder from the dotnet-runtime-3.1.0-criteo1.19565.2-centos.7-x64.tar.gz archive and merge it with the shared folder of your own dotnet installation. Then start your application with dotnet --fx-version 3.1.0-criteo1.19565.2 yourapp.dll
kevingosse
on 10 Feb 2020
don't know at what rate the heartbeat is triggered, but could it be that the messages are coming in faster that your logger can process them?
It looks like the logger output thread is waiting for messages:
OS Thread Id: 0x18
        Child SP               IP Call Site
00007FD5C775C4E0 00007fd5de46f00c [GCFrame: 00007fd5c775c4e0]
00007FD5C775C5C0 00007fd5de46f00c [HelperMethodFrame_1OBJ: 00007fd5c775c5c0] System.Threading.Monitor.ObjWait(Boolean, Int32, System.Object)
00007FD5C775C6F0 00007FD56EE8047A System.Threading.SemaphoreSlim.WaitUntilCountOrTimeout(Int32, UInt32, System.Threading.CancellationToken)
00007FD5C775C730 00007FD56EE762D0 System.Threading.SemaphoreSlim.Wait(Int32, System.Threading.CancellationToken)
00007FD5C775C7B0 00007FD56EE7FB52 System.Collections.Concurrent.BlockingCollection`1[[System.__Canon, System.Private.CoreLib]].TryTakeWithNoTimeValidation(System.__Canon ByRef, Int32, System.Threading.CancellationToken, System.Threading.CancellationTokenSource)
00007FD5C775C820 00007FD56EE7F982 System.Collections.Concurrent.BlockingCollection`1+<GetConsumingEnumerable>d__68[[System.__Canon, System.Private.CoreLib]].MoveNext()
00007FD5C775C850 00007FD566171FE5 LoggingAdvanced.Console.AdvancedConsoleLogger.OutputLoop() [/src/Core.Graph/src/Logging/LoggingAdvanced/AdvancedConsoleLogger.cs @ 49]
@tmds the wait you mention shouldn't be an issue, as this is a separate non-threadpool thread that just listens to the BlockingCollection and prints the items as they come to the console
theolivenbaum
on 10 Feb 2020
If you’re using .net core 3 you should be able to use dotnet counters to capture thread pool metrics as well.
You can also try running threadpool -wi to get a summary of the thread pool work item and queues
 davidfowl
on 10 Feb 2020
davidfowl
on 10 Feb 2020
For blocked threadpool threads the two main items in the stack trace to look for are
System.Threading.ThreadPoolWorkQueue.Dispatch and
System.Threading.TimerQueue.FireNextTimers
 benaadams
on 10 Feb 2020
benaadams
on 10 Feb 2020
Second one also have Parallel.ForEach going on which uses the threadpool; but they show up under a System.Threading.ThreadPoolWorkQueue.Dispatch stack for their parallel parts
benaadams
on 10 Feb 2020
So quick update on this - I checked the AdvancedConsoleLogger path as suggested by @kevingosse, and the only suspicious call there was a call to GC.GetTotalMemory(false) to print how much memory is currently in use. Been testing in production the without this call, and haven't hit the same issue yet, so could be a candidate for the cause.
Anyone has any idea if this method could cause this when called from multiple threads?
From the source-code, this seems to map to this call:
INT64 QCALLTYPE GCInterface::GetTotalMemory()
{
    QCALL_CONTRACT;

    INT64 iRetVal = 0;

    BEGIN_QCALL;

    GCX_COOP();
    iRetVal = (INT64) GCHeapUtilities::GetGCHeap()->GetTotalBytesInUse();

    END_QCALL;

    return iRetVal;
}
And I couldn't find the actual source for the GetTotalBytesInUse method.
theolivenbaum
on 12 Feb 2020
source for the GetTotalBytesInUse method
It is in https://github.com/dotnet/runtime/blob/master/src/coreclr/src/gc/gc.cpp
this method could cause this when called from multiple threads
This method takes locks to enumerate the GC datastructructures. If you are calling this method a lot, it can certainly slow down things significantly and block other threads in the process from making a progress.
 jkotas
on 12 Feb 2020
jkotas
on 12 Feb 2020
Thanks jkotas, that explains why ven GitHub search was not finding it :)
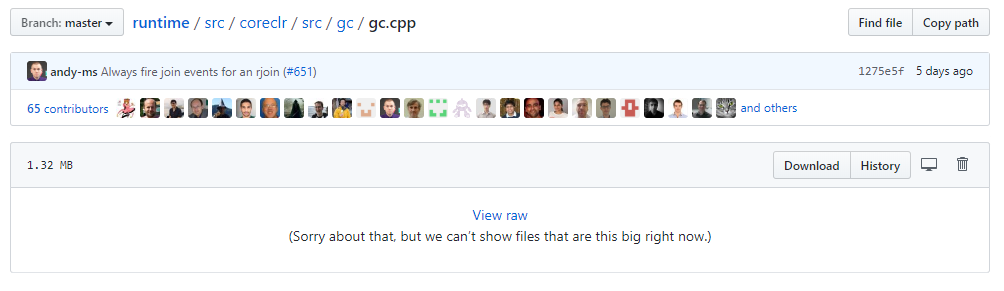
And yes, this could explain both the issue, and why I was not able to see it in any of the stack-traces, as the lock would lock the other threads at random places.
I'll close this issue for now - as we've not yet observed the issue in production since removing this call.
theolivenbaum
on 12 Feb 2020
Related issues
 matty-hall
·
3Comments
matty-hall
·
3Comments
 GitAntoinee
·
3Comments
GitAntoinee
·
3Comments
 jamesqo
·
3Comments
jamesqo
·
3Comments
 jchannon
·
3Comments
jchannon
·
3Comments
 v0l
·
3Comments
v0l
·
3Comments