Runtime: .NET Core 2.2 - HttpClient throws IOException: The server returned an invalid or unrecognized response.
This occurs to be happening on Linux (docker) and OSX on both .NET Core 2.1 and 2.2 (latest), I've heard it's also reproducible on windows but I've yet to confirm.. We have many jobs that talk to Elasticsearch and it's only this one specific one that occasionally blows up. I've brought in all the dependency source code minus the CoreCLR and have been able to get it under the debugger:
 System.Net.Http.HttpRequestException: An error occurred while sending the request. ---> System.IO.IOException: The server returned an invalid or unrecognized response.
   at System.Net.Http.HttpConnection.SendAsyncCore(HttpRequestMessage request, CancellationToken cancellationToken)
   --- End of inner exception stack trace ---
   at System.Net.Http.HttpConnection.SendAsyncCore(HttpRequestMessage request, CancellationToken cancellationToken)
   at System.Net.Http.HttpConnectionPool.SendWithNtConnectionAuthAsync(HttpConnection connection, HttpRequestMessage request, Boolean doRequestAuth, CancellationToken cancellationToken)
   at System.Net.Http.HttpConnectionPool.SendWithRetryAsync(HttpRequestMessage request, Boolean doRequestAuth, CancellationToken cancellationToken)
   at System.Net.Http.RedirectHandler.SendAsync(HttpRequestMessage request, CancellationToken cancellationToken)
   at System.Net.Http.HttpClient.FinishSendAsyncBuffered(Task`1 sendTask, HttpRequestMessage request, CancellationTokenSource cts, Boolean disposeCts)
   at Elasticsearch.Net.HttpConnection.RequestAsync[TReturn](RequestData requestData, CancellationToken cancellationToken)
The last line in the stack trace points to here: https://github.com/elastic/elasticsearch-net/blob/5.x/src/Elasticsearch.Net/Connection/HttpConnection-CoreFx.cs#L120
I've inspected the http client instance under the debugger and it looks completely normal. If I reexecute the request when it fails it works. I've enabled all the logging I can (verbose) and nothing shows up.. I've created a small sample that should be making the same request but isn't blowing up... I'm in the process of creating a better sample that uses the nest client to see if that reproduces this. If you have any ideas on how I can get better logging / inspect the raw request as Wireshark and Charles isn't helping any :.
using System;
using System.IO;
using System.Net.Http;
using System.Net.Http.Headers;
using System.Text;
using System.Threading.Tasks;

namespace ConsoleApp1
{
    class Program
    {
        private const string JSON = "{\"size\":801,\"query\":{\"bool\":{\"filter\":[{\"bool\":{\"must\":[{\"range\":{\"metaData.nextRunDateUtc\":{\"gte\":\"0001-01-01T05:51:00Z\",\"lte\":\"2019-01-29T23:45:55.436645Z\"}}},{\"term\":{\"isEnabled\":{\"value\":true}}}]}}]}}}";

        public static async Task Main(string[] args)
        {
            Console.WriteLine("Hello World!");

            var client = new HttpClient { BaseAddress = new Uri("http://localhost:9200")};
            var counter = 1;
            while (true)
            {
                try
                {
                    var response = await client.SendAsync(CreateRequestMessage());
                    Console.WriteLine($"{counter++}: {response.StatusCode}");
                }
                catch (Exception ex)
                {
                    Console.WriteLine(ex);
                }
            }
        }

        protected static HttpRequestMessage CreateRequestMessage()
        {
            var requestMessage = new HttpRequestMessage(System.Net.Http.HttpMethod.Post, "/test/test/_search?ignore_unavailable=true");
            requestMessage.Headers.Connection.Clear();
            requestMessage.Headers.ConnectionClose = false;
            requestMessage.Headers.Accept.Add(new MediaTypeWithQualityHeaderValue("application/json"));
            requestMessage.Content = new StreamContent(new MemoryStream(Encoding.UTF8.GetBytes(JSON)));
            requestMessage.Content.Headers.ContentType = new MediaTypeHeaderValue("application/json");

            return requestMessage;
        }
    }
}
I've also looked through some of the other issues here: https://github.com/dotnet/corefx/issues?utf8=✓&q=is%3Aissue+%22The+server+returned+an+invalid+or+unrecognized+response%22
 niemyjski
All 37 comments
@wfurt can you please advise on the logging?
 karelz
on 31 Jan 2019
karelz
on 31 Jan 2019
Your repro talks to loopback @niemyjski. That may prevent you from getting repro. Timing is different if the issue lives in some race condition in client and it will never happen if the server does return malformed response occasionally.
I would also suggest to add some X-header to request with counter or GUID of some form. So when it blows up, you can log it in your app and than search for it in packet capture.
There are traces can enable but I'm not sure if that will work if we fail to parse the response.
 wfurt
on 31 Jan 2019
wfurt
on 31 Jan 2019
Thanks for that, I'm hitting localhost (ssh forwarding to AWS instance) and repoing it consistently using the nest client not so much in my samples but I did get a crazy serialization error in one of 40k runs with my new sample. What do you recommend for logging of the http client instance that's abstracted. I set Microsoft and System to verbose in the logs and nothing showed up. I have no control over how this instance is created or managed. I'll add a header to my samples.
If you could let me know what traces I can enable that would be greatly appreciated. I'd love to know what's going on with this one request that keeps failing
niemyjski
on 31 Jan 2019
just to be 100% sure: you do http? 40K runs is not too bad. I would expect to hit this in few hours - days?
wfurt
on 31 Jan 2019
Yes http (not https) When I run my full console app (job) I can hit it within 5-6 http runs. My console app not so much. I'm trying to narrow down exactly what's different :\
niemyjski
on 31 Jan 2019
very good. I think you still should collect packet captures..
tcpdump -s0 -n -w http.pcap -i lo port 9200
you can do also following:
export COMPlus_EnableEventPipe=1
export COMPlus_EventPipeConfig=Microsoft-System-Net-Http:0xFFFFFFFFFFFFFFFF:5
and than run your console app from that session.
It will create .netperf trace you can load in PerfView.
when you hit the issue, log request ID and maybe time.
hit ^C to finish the packet capture. that should be sufficient. If it takes too long, sometimes I rotate the dump every hour or so to prevent it to grow too big.
In general case I use
export COMPlus_EventPipeConfig=Microsoft-System-Net-Sockets:0xFFFFFFFFFFFFFFFF:5,Microsoft-System-Net-Security:0xFFFFFFFFFFFFFFFF:5,Microsoft-System-Net-Http:0xFFFFFFFFFFFFFFFF:5
but since it does not seems to be IO related, capturing HTTP should be sufficient. (it it provides more info about the failure)
wfurt
on 31 Jan 2019
Is the a default exports I can use to revert back when I need to I had one crash show up that I reported back via the Mac dialog. Also I have a very small pcap file I can send somewhere if you'd like to look with the single request (and then I waited a few seconds and killed it).
I downloaded preview but I'm running on Mac and I did not see any other files create that I could have loaded up in preview in my vm. Is there a location that this .netperf trace will be created too?
niemyjski
on 31 Jan 2019
traces will be in current directory (cwd) That may or may not be in directory where app is. Could you please post the pcap file? you may need to zip it so github accepts it. (or post it anywhere else)
wfurt
on 31 Jan 2019
I don't see any extra files being created in the working directory or app directories. For what it's worth I'm debugging from rider on OSX.
niemyjski
on 31 Jan 2019
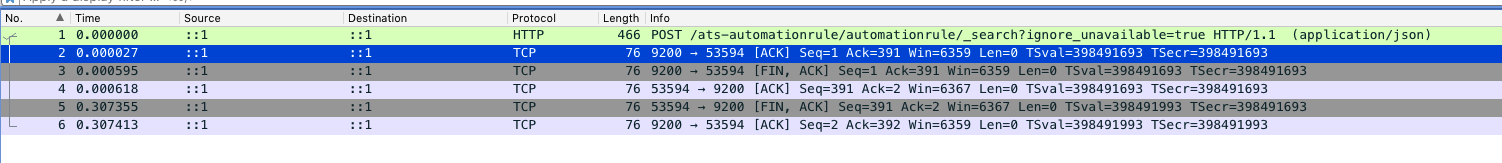
I look at the capture. In packet 3, server (src port 9200) closed TCP with FIN without sending any data. It is hard to know if this is artifact of the SSH tunnel or not.
So either server did not like the request or something abnormal happened on the server. In first case you would normally get 400 so I suspect server crash or some networking problem.
One more thing you can try is packet capture on the server e.g. between tunnel and the server.
Also I assume your connection is not idle for long time, right? We have seen problems in the past when connection is idle, some firewalls in middle would cut it down.
as far as the traces: try to run it from terminal window - at least once so you see if the trace file is being created.
wfurt
on 31 Jan 2019
This is happening without the ssh tunnel so I think we can rule that out. It's only this one process and it's a shared docker image which doesn't make sense. I'm also seeing that FIN, ACK by the server when this fails. I triggered it to happened and then inspected the elastic logs on the whole cluster. There were no errors, failures or process restarts that I can see... I'll keep digging... The connections are shored lived but connection pooling is happening with multiple http clients (I've verified in this job that there is only ever one cached http client). Is there anything I should see or logging I could enable to show connection timeouts? Like I said if this happens I can rerun the code immediately and the request will pass with the same http client. I'll see what else I can do to narrow this down.
niemyjski
on 31 Jan 2019
This is difficult problem. One similar case I was looking at while ago was caused by load-balancer/firewall between client and the server.
I don't know how much flexibility you have on the sever but you can for example add GUID to URL and cause invalid search. When it fails you can check if that request was received by the server. (of course you can do it with headers as well)
as far as the repro: did it fail with exactly same exception? I'm trying to make sure that the failure you see is exactly same as originally reported.
one more thought on networking: can you run this from cloud VM? The idea being to eliminate as many hops as possible and see if you see same rate of failures.
wfurt
on 31 Jan 2019
Yep, it's always exactly the same error. I'll see what I can do to add logging to this.
niemyjski
on 31 Jan 2019
ok. In this case you also did get ACK for the request you just sent. So it was delivered somewhere. It may or may not be actual server.
wfurt
on 31 Jan 2019
I forwarded directly to the load balancer that the app also talks to. I'd think this would be either a cluster node or the load balancer that sends back the FIN. I'm lookin into this.
niemyjski
on 31 Jan 2019
I took the AWS load balancer out of the equation and I havent been able to reproduce it . I put it back in and I hit it within a minute or two. Do you remember any of the criteria for the lb/firewall that was causing this issue. I created a smaller sample using the same nest library and am not seeing the issue against either (only the full app). Starting to wondering if I just need to gut the app down... So odd.
niemyjski
on 1 Feb 2019
I'm going to keep monitoring this but we changed from a L7 to a L4 load balancer and the issues seem to have went away (will keep this issue updated)
niemyjski
on 1 Feb 2019
That would make sense. The previous issue I was referring to was in Azure so it may not be directly applicable. From the description it seems like the device terminates TCP and than perhaps fails to connect to server and closes TCP as result.
wfurt
on 1 Feb 2019
I think the load balancer was failing either to parse the simple http response or maybe out of resources (I don't really know)? But it seems like the load balancer was just killing the request and not putting anything in the logs because it never got to the internal server. I'm not sure why it was an L7 as no processing was ever needed and added extra overhead. Do you wish for me to close this?
niemyjski
on 4 Feb 2019
I don't think it is actionable nor does it look like .Net problem. It is good that you have access to infrastructure and the info you collected will be useful for others.
If anything I would suggest to open issue with AWS. They may be able to see more and perhaps resolve this for all or at least provide more insights.
wfurt
on 4 Feb 2019
Thanks again!
niemyjski
on 5 Feb 2019
Just for the future reference. In our case (dotnet core app inside docker and operated by k8s), exact same problem was intermittently seen when multiple services are on the same ELB. Problem was fixed after we provide a separate ELB for each k8s service.
 gokhansengun
on 13 Feb 2019
gokhansengun
on 13 Feb 2019
I just want to pitch in here, as we have been having this problem in an attempt to upgrade from dotnet 2.0 to 2.2 on a customer project.
It happened in combination with Amazon.SQS and Amazon.SNS listening and a small wrapper we've built around the low-level amazon clients. During our CI / CD testing (running via Docker) of sending and receiving messages we got random IOException: The server returned an invalid or unrecognized response. We were unable to replicate it on macOS, however we also saw the problem on Ubuntu 18.04 (with dotnet SDK 2.2.105).
After dotnet SDK 2.2.203 was released we picked this up again to finalize the upgrade and the problem completely disappeared from Ubuntu (and macOS), however our CI/CD pipelines were still suffering rendering us unable to merge our upgrade.
This led me down a dark and windy road of debugging Docker and the Linux host it was running on. Our Docker images for the application are all built from Microsofts SDK image 2.2.203-stretch
I set up multiple virtual environments:
- Ubuntu Bionic, kernel 4.15.0, Docker CE Stable 18.09.6,
- Debian Stretch, kernel 4.09, Docker CE Stable 18.09.6 (which the CI/CD runs in)
- CentOS 7, kernel 3.10.0-957, Docker CE Stable 18.09.6
For whatever reason it _consistently_ fails in the Debian VM but all the others just plow on and work.
I'm not sure what can cause this but my theory is something in the kernel, as Docker inherits the kernel from it's host.
If anyone has a deeper insight on this I would be glad to know, however, for now we know what to do to mitigate the problem.
 nover
on 10 May 2019
nover
on 10 May 2019
I could repro the issue when using HttpClient and doing an h2c request, i.e. to a server supporting Http2 but without TLS. And HttpClient doesn't support it since 2.1.
 sebastienros
on 30 May 2019
sebastienros
on 30 May 2019
This should be possible now with 3.0 preview builds and either DOTNET_SYSTEM_NET_HTTP_SOCKETSHTTPHANDLER_HTTP2UNENCRYPTEDSUPPORT=1 or System.Net.Http.SocketsHttpHandler.Http2UnencryptedSupport App context switch.
However without ALPN there is always possibility for mismatch.
wfurt
on 30 May 2019
I am experiencing the same problem. I have two servers - Ubuntu 18.04 and Debian 9 and on the latter 100% of responses to the same server with the same content end up with the aforementioned exception, while there are no problems with the first one at all.
What is more interesting, I'm trying to create a minimalistic repro and if I copy/paste the relevant code with barely any changes and run in on the very same Debian machine it works. While the original process running in parallel still ends up failing. I thought I might be related to debug/release publishing configurations but both of them worked with the extracted code.
 alexalok
on 9 Jun 2019
alexalok
on 9 Jun 2019
If this is HTTP, you can do packet captures.
wfurt
on 10 Jun 2019
This thread is super-interesting. We're also running asp.net core 2.2 in Kubernetes on Debian, and the .net app makes httprequests to another service which is fronted by AWS ALB.
Inspired by this thread, we tested bypassing ALB, and everything seems to work much better.
I'm also gonna replace our Debian images with Ubuntu, just to see if that makes any difference.
For info, our app makes about 10-40 calls/sec thru alb, and we're seeing 1-5 failures per minute typically.
 trondhindenes
on 15 Jun 2019
trondhindenes
on 15 Jun 2019
Hey @trondhindenes, do you have any type of node autoscaler in Kubernetes? We have found out our issue due to nodes being created and destroyed on minutely basis. We are not sure yet about the root cause but we only have the issue when autoscaler destroys a node
gokhansengun
on 15 Jun 2019
If you can reproduce it within minutes, can you do packet capture @trondhindenes ? The the case originally investigated throws "The server returned an invalid or unrecognized response" even if there is no response what so ever.
That can possibly be improved to provide more clarity.
When you say node, you mean the code running client or server @gokhansengun ? I think if we can programmatically isolate cases when it failed on TCP level, retry at application level is probably best mitigation.
wfurt
on 16 Jun 2019
The the case originally investigated throws "The server returned an invalid or unrecognized response" even if there is no response what so ever.
That can possibly be improved to provide more clarity.
In .NET Core 3.0, that error message has been enhanced to show more detail about why response was considered invalid.
 davidsh
on 16 Jun 2019
davidsh
on 16 Jun 2019
@wfurt as node, I meant the virtual machine which runs client/server containers.
This is probably an umbrella issue stemming from various scenarios but I can talk about ours.
Our problem is due to the distributed nature of Kubernetes scheduling our containers. Client is sending the request to an intermediary, intermediary accepts it to relay to actual container but the node disappears while the packet is on the fly. A retry logic in framework level may not address our case as the intermediary (in kubernetes case it is kube-proxy) may not yet be aware of the fact that the node housing the container is gone in the retry request and therefore it needs to re-route to another container.
The best course of action we could come up with was to add delays to cleanup procedures in the cases where the node disappears. So we wait way longer than necessary (to allow info propagate to the whole Kubernetes cluster) before we allow the node to be discorded by Kubernetes.
gokhansengun
on 17 Jun 2019
I had the same error on the second POST to the same URL inside one ASP.NET Core action execution. It worked fine on windows but failed inside docker on Linux. The only way I found to fix it is setting DOTNET_SYSTEM_NET_HTTP_USESOCKETSHTTPHANDLER=0. I use netcoreapp2.2.
 Saikava
on 21 Nov 2019
Saikava
on 21 Nov 2019
can you get capture of the response @Saikava ? And is it reproducible all the time?
There can be actually multiple independent issues but we need more data to make progress.
Also 2.2 will get out of support soon. Since 3.0 is out, it would be great if you can give it shot.
wfurt
on 21 Nov 2019
We have an Alpine Linux POD managed by k8s and we get the same error, so it isn't happening only on Debian as previously said.
We use Image: microsoft/dotnet:2.2-aspnetcore-runtime
Our PODs is behind NGINX proxy on AWS.
Hope this help.
 cfguimaraes
on 27 Jan 2020
cfguimaraes
on 27 Jan 2020
If this is with HTTPS it depends more on the OpenSSL version and that can change over time. Debian usually being more aggressive on upgrades than other distributions. For example OpenSSL 1.1.1 brins TLS13 and behavior change. You can do packet captures and/or tracing @cfguimaraes to see what is going on.
Also, note that 2.2 is out of support now. https://dotnet.microsoft.com/platform/support/policy/dotnet-core
wfurt
on 27 Jan 2020
You are right @wfurt.
We use HTTPS and with 2.2 out of support, I think no one will look at this in the future.
Also, this issue is closed.
Thank you and sorry.
cfguimaraes
on 27 Jan 2020
Related issues
 noahfalk
·
3Comments
noahfalk
·
3Comments
 jamesqo
·
3Comments
jamesqo
·
3Comments
 v0l
·
3Comments
v0l
·
3Comments
 EgorBo
·
3Comments
EgorBo
·
3Comments
 jchannon
·
3Comments
jchannon
·
3Comments
Most helpful comment
Just for the future reference. In our case (dotnet core app inside docker and operated by k8s), exact same problem was intermittently seen when multiple services are on the same ELB. Problem was fixed after we provide a separate ELB for each k8s service.