Runtime: [dotnet-trace] Some rundown events are missing
Examples:
Method/DCStopVerboseMethod/ILToNativeMapDCStop
That may be why when attaching to a process that has completed all of its jitting, the stack view does not show up. I believe DCStopVerbose is used by PerfView to associate a sample's code address with a method name and other info about the method, when the method was already jitted before attach, and ILToNativeMapDCStop when paired with DCStopVerbose is used to associate samples to source code lines.
Some more discussion in https://github.com/dotnet/coreclr/pull/24993
 kouvel
All 13 comments
@davmason can you investigate?
 tommcdon
on 12 Jun 2019
tommcdon
on 12 Jun 2019
I'll take a look in the morning
 davmason
on 12 Jun 2019
davmason
on 12 Jun 2019
Taking a look at a trace generated using master, I am only seeing MethodILToNativeMap events, and no MethodDC* events
Edit: Was accidentally looking at an old trace. Redid my experiment with master and I got the following results when pointed at a fresh ASP.NET Core WebAPI:
Rundown events:
Microsoft-Windows-DotNETRuntimeRundown Task(cd7d3e32-65fe-40cd-9225-a2577d203fc3) - 1
Microsoft-Windows-DotNETRuntimeRundown Task(0bcd91db-f943-454a-a662-6edbcfbb76d2) - 4886
Microsoft-Windows-DotNETRuntimeRundown Task(5a54f4df-d302-4fee-a211-6c2c0c1dcb1a) - 373
Metrics:
        MethodILToNativeMap:    0
        MethodDCStartV2:        0
        MethodDCStartVerboseV2: 0
        MethodDCStartCompleteV2:        0
        MethodDCStopV2: 0
        MethodDCStopVerboseV2:  0
        MethodDCStopCompleteV2: 0
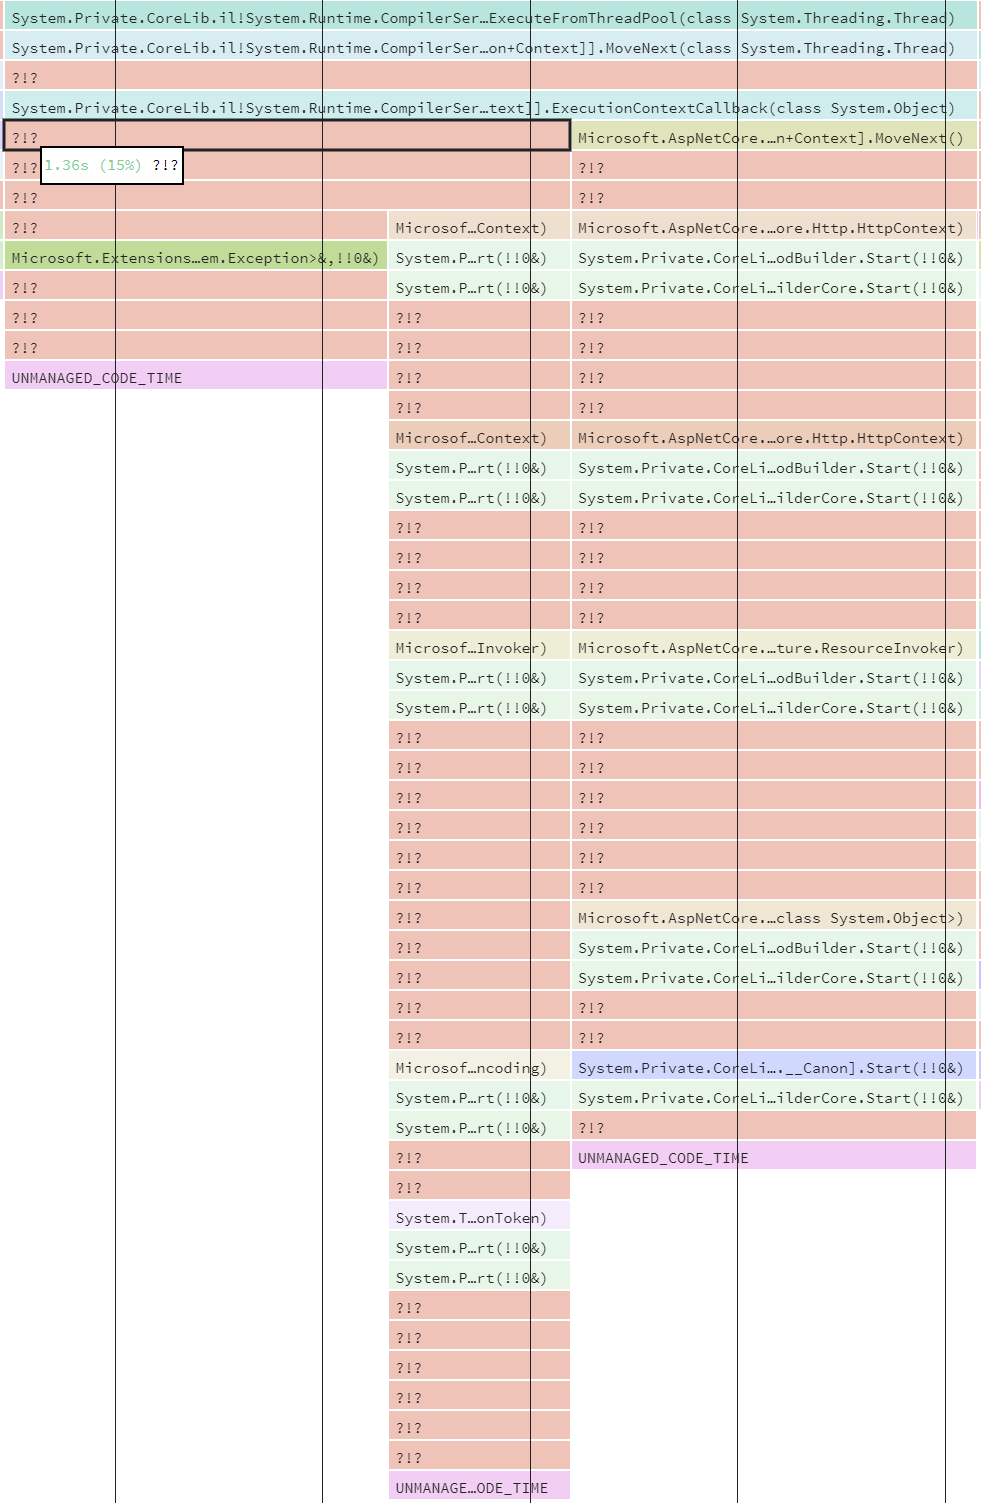
It would appear we aren't getting any of the Method* events. If PerfView is using those to map IP back to method names, that would explain the ?!?s in Speedscope and PerfView:
CC @sywhang @jorive
 josalem
on 14 Jun 2019
josalem
on 14 Jun 2019
Thanks @josalem! Keep me updated before you leave next week :-)
 sywhang
on 14 Jun 2019
sywhang
on 14 Jun 2019
I went back and compared preview 5, 6, and 7 trace outputs. It would seem we stopped getting these events _between_ previews 5 and 6.
josalem
on 14 Jun 2019
@josalem does it work in preview 7?
 jorive
on 14 Jun 2019
jorive
on 14 Jun 2019
There are no Method* events showing up in the traces from preview7.
josalem
on 14 Jun 2019
So @josalem and I were able to narrow it down to this commit: https://github.com/dotnet/coreclr/commit/451fd23fa2179fa22c831bcf84edd547bfba5cd9, but the change is quite large and I haven't been able to fully narrow it down what specifically broke it. I'll investigate further after the remainder of training today.
sywhang
on 14 Jun 2019
cc: @jkotas
 janvorli
on 17 Jun 2019
janvorli
on 17 Jun 2019
dotnet/coreclr#25199 should fix this
 jkotas
on 17 Jun 2019
jkotas
on 17 Jun 2019
Not fully fixed yet. From https://github.com/dotnet/coreclr/pull/25199#issuecomment-502735310:
After typing that up, I ran my test with an ASP.NET Core WebApi and I am only seeing partial symbols still. Far more than before, but not everything.
I do not see anything obvious that can be causing this.
jkotas
on 17 Jun 2019
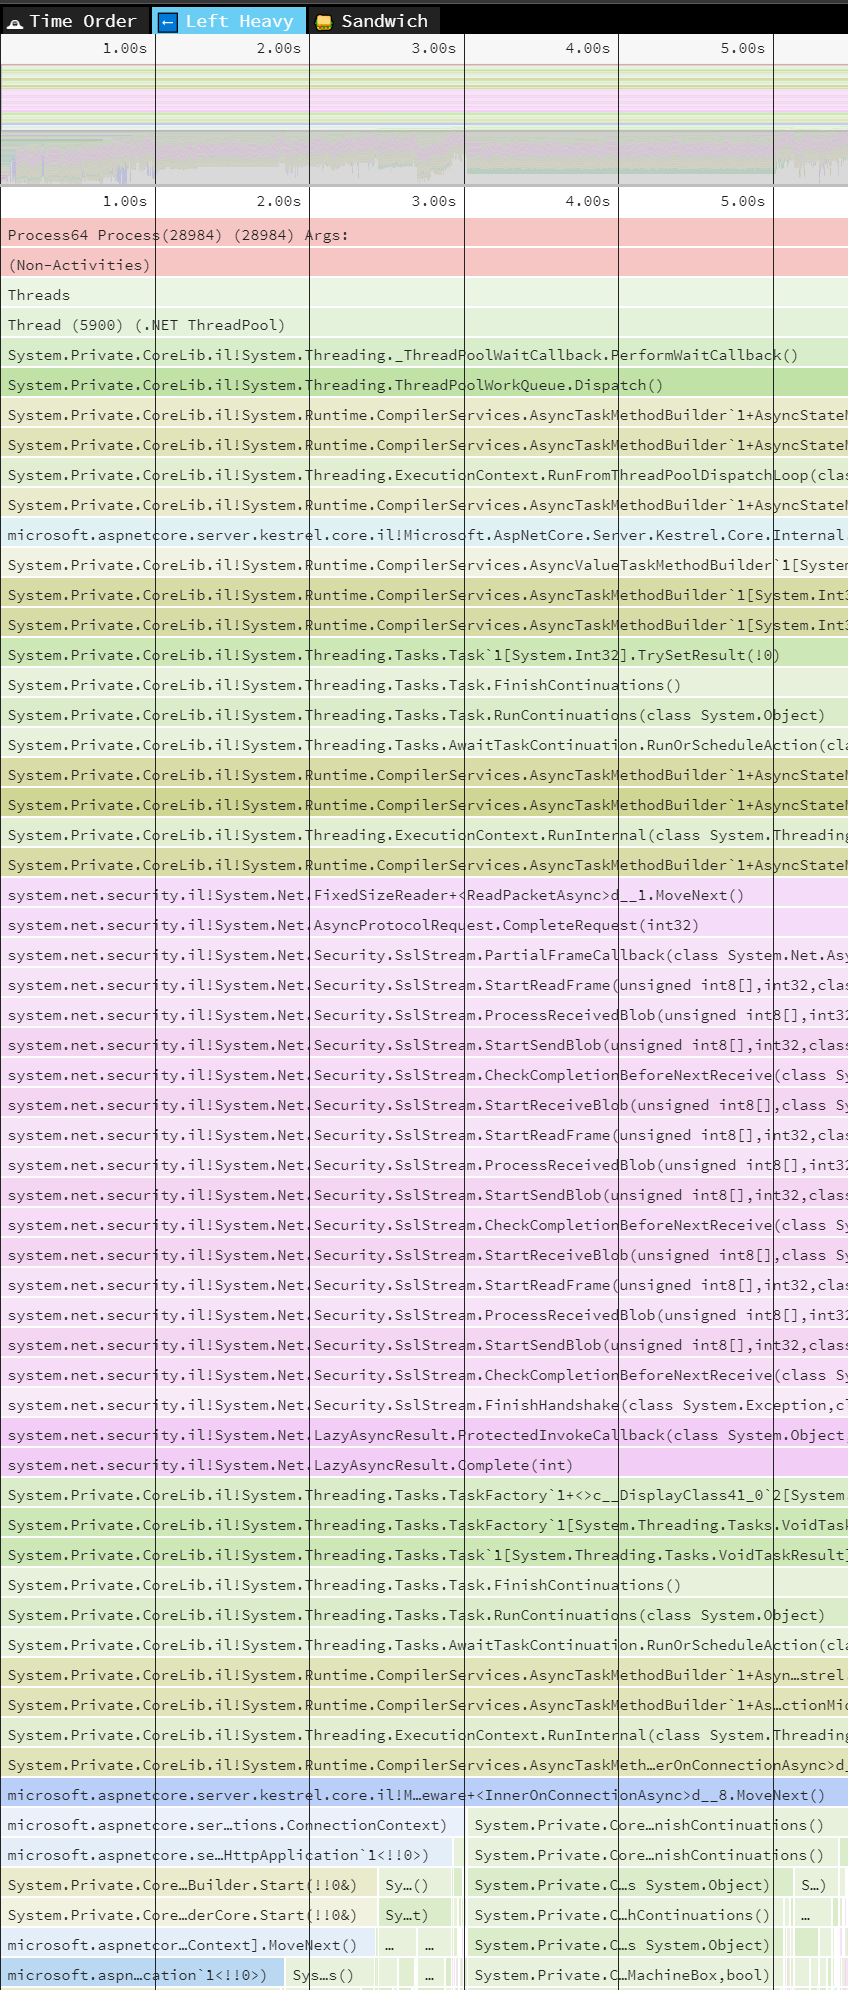
Quick update on this: Seems like there were a couple issues at work here
- The one Jan fixed (accidental
#ifdefplacement) - Some rundown events were erroneously marked as not enabled (fixed by dotnet/coreclr#25361)
- Generic R2R code was not emitting the events necessary for symbol resolution (fix coming from @davmason #soon)
With all these things fixed, we get essentially all symbols in my smoke test (an asp.net core webapi):
josalem
on 25 Jun 2019
Now that dotnet/coreclr#25371 is in, this should be resolved
davmason
on 26 Jun 2019
Related issues
 v0l
·
3Comments
v0l
·
3Comments
 bencz
·
3Comments
bencz
·
3Comments
 yahorsi
·
3Comments
yahorsi
·
3Comments
 omajid
·
3Comments
omajid
·
3Comments
 jchannon
·
3Comments
jchannon
·
3Comments
Most helpful comment
Quick update on this: Seems like there were a couple issues at work here
#ifdefplacement)With all these things fixed, we get essentially all symbols in my smoke test (an asp.net core webapi):
