Rpcs3: Vulkan renderer potentially not releasing assets from vram properly
This is my first report, so please forgive me if I am wrong, or fail to do this right.
After a few solid hours of game-play on BLES01992 Atelier Escha and Logy, I eventually ran into a black screen freeze while transitioning though a menu. The result was an out of vram vulkan error. Checking my vram usage before terminating the game showed it indeed had climbed steadily over the course of my gameplay, which shouldn't be a normal case considering the memory should be freed after use.
Rerunning the emulator doing nothing but sifting through menus showed an increased usage of vram (although minor) indicating that RPCS3 is not releasing vram properly, or it is "forgetting" that there is resources already available, happy sucking away at additional resources. Had I been utilizing a 1060 6GB or better, I wouldn't have noticed this as I was getting close to saving and going to bed, and having a card with more vram would mean I wouldn't have played or ran the game long enough to fill up anywhere near 3,6,or more GB of vram.
I am not sure, but it is possible that RPCS3 is not releasing resources in VRAM properly, or there is a potential memory leak there (Can GPUs even have memory leaks?)
As such, I will include my log (warning, it is pretty large, but I don't want to snip anything out as it might be useful), and my specs are as follows:
R3 1200 OC to 3.85GHz
GTX 1050 (2GB vram)
16GB Ram.
RPCS3 0.0.5-7337-ed7012c9 Alpha
Settings are stock, exception being the upscale was set for 1440p (200%), and anisotropic is set to 16x (BTW, this makes games look absolutely sexy).
Due to the size of the log (100MB), I had to put it in my dropbox. I apologize for any potentially unnecessary spam in the log, but as aforementioned, since I am not sure what is/isn't potentially relevant, I left it completely untouched.
https://www.dropbox.com/s/ua02vu1771nsyv8/RPCS3.log
If I need to place the following secondary issue elsewhere, please let me know and I will do so.
The only other issue I noted while playing the game was at specific instances, the outline from the toon shaders would not compile correctly when the camera zooms in, resulting in a green outline instead of black, along with minor texture corruptions, sometimes at random, sometimes after completing an objective the produces a pop up overlay (the latter being more frequently the trigger). I am not sure if this is/isn't potentially related, but since the issue is about graphics, I felt it was better to provide this info here rather than as a separate issue, just in case this may potentially be related in some way.
The only other issue I had was related to "audio", where the game would seem to desync as could be heard by the audio itself, and visually seen by slow animating textures, then eventually straighten itself out on it's own to normal speed and sound.
Hopefully this information is useful.
 Fallenleader
All 41 comments
you could've compressed the log in a zip or 7z
 Ariq139
on 15 Sep 2018
Ariq139
on 15 Sep 2018
I am playing the game right now(32 hours already and I am at chapter 7)but something is happening between 0.0.5-7161 and 0.0.5-7216
While I was using versions between those two,I would randomly get a black screen after a cut scene or zoning in\out.
Since I want to play the game(not trying to find the problem and because it's happening randomly),I decided to stay on 0.0.-5-7161 until I finish the game or see some of the graphical problems fixed(that also exist in Atelier Shallie which I also clear using that version)
I get access violations from time to time but not black screens so the culprit is somewhere there between 0.0.5-7161 and 0.0.5-7216(or maybe they happen only on certain part of the game)
i7-6700HQ
16GB Ram
GTX1060 3GB
Win10
ASMJIT(LLVM takes too much time to load and unless I enable Xfloat which kills my fps,I don't get anything positive on this game)
Vulkan,50fps limit(works better with this than with 60,auto or off),Disable Async shader compilation(I have a feeling that this option increases the chance or access violations or black screens on this game...I don't know,I may be wrong)
 vsub
on 15 Sep 2018
vsub
on 15 Sep 2018
It would be more helpful to gather a list of titles where the memory consumption is too high. The emulator cannot know what a game is really doing with memory which can sometimes cause vram usage to go up, but I do not think that this is the cause here. Obviously a test that takes hours to trigger is not useful for debugging as it takes up too much development time and resources, so maybe someone knows of a faster way to trigger this.
 kd-11
on 15 Sep 2018
kd-11
on 15 Sep 2018
I understand the emulator can lose track from time to time, this is expected, but the nature of this issue would need to be debugged by firsthand experience, or multiple logs from low vram GPU users. It is seemingly random, but it appears to be due to the emulator forgetting resources in vram.
Not sure how your "bounty" system works for getting information like this, so all I can say is an official request for testing various games on low vram GPUs (3GB or less) would be the potential solution.
The lower the vram, the faster the resources disappear, so what took me about 3 or so hours might only take 1.5 to 2 on a 1GB card.
Not sure what your minimum GPU requirement is, but anything with less than 1GB of ram would be ideal for testing. The issue stems from the vram being filled up over time and not being cleared properly. I am not sure if this is related to shader compilation leftovers, or if transitioning scenes in this game is not sending a signal to clear the unused memory.
For now, vsub mentioned that 0.0.-5-7161doesn't seem to have an issue, and I don't play in small sessions, so I should be able to trigger this again using that build if it isn't a regression of some sort.
If you wish, I have no issues saving the log from my next session in case it is helpful.
Here is something I forgot to think of. Is this issue from the people who replied occurring on anything other than an Nvidia card?
AMD has notably better vulkan support compared to Nvidia, and this could be a potential factor.
Fallenleader
on 15 Sep 2018
If you are able to consistently trigger this again, disable the custom memory allocator in the debug tab to force use of the default allocator. You can find the option in the debug tab or by manually editing the config file and setting the "Disable Vulkan Memory Allocator" to true. This could help narrow down the problem, but do note that the allocator is 3rd party code from AMD's GPUOpen project.
kd-11
on 16 Sep 2018
Are you still seeing this after #5115? Some of the fixes that went in with that PR related to possible VRAM leaks.
 ruipin
on 27 Sep 2018
ruipin
on 27 Sep 2018
I honestly haven't had the chance to sit down and play the game yet since then. I will try it again on either that build or a later nightly and respond back when I have the time.
The issue is honestly one that is difficult enough to track down because I noticed it after extended gameplay, and to properly test again I would need time to sit down and play 3+ hours again, and this is for a 2GB VRAM card. I don't have an GPU options with less vram to speed up this process.
There were potentially warning signs that could be related or completely unrelated, as the game after a good bit of playing would have minor visual issues, such as discolored textures or images filling in menu transitions. Considering the emulator is still in a beta stage, I didn't consider screen capping these at the time, as it wasn't until the crash and noting the usage of resources that I even bothered with this issue. The ONLY reason I opened this is due to the fact that there was indeed maximized vram usage after extended gameplay which after transitioning through the game's locations over time shouldn't happen unless there was something inherently wrong, being a leak or assets not being freed, as normal use case would release memory and vram for new textures, as old textures would be unnecessary if not in use.
What makes this a bit harder for me to communicate is I think along the lines of a game developer, not a regular program developer, and even then my knowledge is somewhere in between early to intermediate beginner level.
Ultimately, I wouldn't think a AAA game studio would program the game in a way that textures not in use stick around eating the limited resources of the PS3, so I felt bringing this up for others with the potential ability to provide additional information faster than me would be able to do so, as they would know what to look for and have an idea of about how long it would take.
Fallenleader
on 28 Sep 2018
I tried some of the recent betas and it was working fine...untill for some unknown reason,rpcs3 stop loading my save,it just stays in the save loading screen after loading the save(I thouth that that beta damaged my 60+hours save because it wouldn't load the save even after I restart the game(not rpcs3)twice and rpcs3 once but I was able to load it after one more try restarting rpcs3.
Thinking something may go bad,I decided to go back to 0.0.5-7161 on which this problem never happen in a 60+ hours(I load and save the game during that time more than 50 times)
vsub
on 28 Sep 2018
Ultimately, I wouldn't think a AAA game studio would program the game in a way that textures not in use stick around eating the limited resources of the PS3, so I felt bringing this up for others with the potential ability to provide additional information faster than me would be able to do so, as they would know what to look for and have an idea of about how long it would take.
This is what I've been trying to explain, hw has no concept of game resources, just has access to memory. They are not even modified, if you 'free' a texture on the game, nothing is done on the hw, just that the driver keeps track that the memory can be used to store new texture data. Afaik this should behave correctly, whenever memory tied to a texture is written to, the original texture is removed. You can try the debug overlay; I cannot guarantee it works correctly now, but if it does you can see the approximate amount of texture memory in use.
kd-11
on 28 Sep 2018
I also pointed out I am nowhere near the technical knowledge level needed to begin to articulate what is going on aside from after 3 hours of gameplay, my VRAM was overused and was steadily increasing as I played. Having worked in C# and Unity, the concept of garbage collection for me is an automatic voodoo process that munches up used ram when I am done with it. Obviously I know enough to know that C++ leans to the user keeping track of resources (this is why OOM issues exist in many C++ applications, and how most modern consoles tend to get usermode quickly from poorly coded apps), but beyond knowing that there is no magical unicorn eating up wasted space from an unused block of code in C++ applications or even on a console, I am honestly as clueless as the average user as to who, what, where, when, and how.
Hopefully this will change after the few months it will take me to munch through the pile of books on both C++ and C# code, as well as the nearly month worth of video materials to boot, but for now, all I can provide is what I did. The build I used at the time has some issue where vram was steadily increasing over time from an extended gameplay session, hinting that resources somewhere, somehow were not being managed correctly or leaking one. I apologize if this comes across rude as this isn't my intention, it was a case of something was evidently wrong, and this is how one could repeat it, and seemed significant enough to share what I could in the event that the issue could potentially cause other games to fail or even worse, not work. I leave debugging this to those who know how to look for things that might cause it, and textures are just an assumption, because I have no clue what else could/would be stored in vram, especially when talking about vulkan (which by the way is one of those books I was mentioning in my to learn pile), and the fact I was seeing texture bleeding across menus shortly before the out of vram crash (framebuffer related maybe?).
As for me, if I am guided on how to run the latest nightly in a way that will provide you guys with useful debug information, I have a day off work soon enough I can dedicate 3-4 hours to try and retrigger it (assuming the issue wasn't resolved already), and provide you with what you would need to track it down.
Fallenleader
on 29 Sep 2018
From the one hour I was playing on the latest beta(0.0.5-7405)I was able to reach 918mb vram and it will not go any higher no matter what I do.
I am using 150% scaling and AF to auto and when I close the game window,I get all of the used vram back.
The strange thing is,increasing the resolution did nothing to the vram used but the window size did.
What is your desktop resolution @Fallenleader
I have seen(not in rpcs3)weird things happening once you hit the max vram
vsub
on 29 Sep 2018
I experience very similar "memory leaks", vram usage is higher and higher until crash. Vram usage is NOT growing slowly and steadily, but instead there are sudden jumps by 200-300 MB from time to time. I was observing this by running something like "nvidia-smi -l 1 -d MEMORY | grep Used". Initialy it shows 600MB (after game is fully started), after some time (around an hour) jumps to 800MB, then 1100MB, 1300MB, 1600MB, 1960MB then emulation hangs with either "Out of video memory" or "0 images in swapchain". It takes a few hours (4-5) until crash. All vram is freed after closing rpcs3. I tried to corelate those usage jumps with rpcs3.log, but couldn't see anything particular at that moments.
GTX 670, 8GB RAM, i7 3770K, Linux (F28), RPCS3 compiled yesterday from master, the game which should not be named ;).
 GitArUs
on 3 Oct 2018
GitArUs
on 3 Oct 2018
I don't know if this has anything to do with but I have a custom nvidia profile that keep my gpu to always run at maximum performance because(I don't know if that is still the case)before while I was playing less demaning games with ocasional performance jump requirements,rpcs3 will freeze for half a second until the gpu overclock itself to meet the current requirements.
That constant higher\lower requirements change was keep making the gpu to overclock and underclock itself which resulted in an often half second freeze which was really annoying.
Try setting the gpu to maximum performance and see if you still get that problem
vsub
on 3 Oct 2018
@vsub My resolution is 1920x1080 /w/ 150% scaling. My GPU is more than capable of handling this.
Try setting the gpu to maximum performance and see if you still get that problem
I have very stable and strong overclocks on my entire system. I can demand more from it than RPCS3 will ever demand for 1080p. I would be inclined to have considered the overclocks to be a candidate if the issue wasn't exactly as @GitArUs described. There is no rhyme or reason, is just increased as time progressed.
I included a 1337 pic with my pro level paint skills giving a visual aid to what we are talking about. Not exactly what I saw on my screen, but it does represent it at least.

I am about to kick back and play again on the latest RPCS3 build. I will most certainly provide up to date feedback if this happens again, including the entire log. Looking now to see if I can find some resource monitor that will log my GPU vram.
Fallenleader
on 4 Oct 2018
Msi Afterburner,OpenHardwareMonitor,Process Hacker...and the task manager.
When I run the game,the usage is about 250mb and when I go to all of the town areas,the world map,one area,enter one battle and access the alchemy screen(to make an item),the usage is ~920mb at 150% scaling on 1080p desktop resolution and the vram usage don't go up
vsub
on 4 Oct 2018
I've checked it more thoroughly - looks like memory usage increases in 256MB chunks, so I suppose it is a doing of vulkan memory allocator.
@kd-11 : "Vulkan Memory Allocator" cannot be disabled, because without it emulator hangs during/after "compiling pipeline objects" (even if there isn't anything to compile) and I have to forcefuly restart xorg, which becomes unresponsive. And I can't find any option to display debug overlay (there is only option for performance overlay).
GitArUs
on 4 Oct 2018
@GitArUs Debug settings are hidden by default, you need to modify files to have them visible. On Linux this can be done by opening ~/.config/rpcs3/GuiConfigs/CurrentSettings.ini and changing showDebugTab to true. Restart RPCS3 and if you did the modification correctly you should see a new tab in the settings menu.
 MSuih
on 4 Oct 2018
MSuih
on 4 Oct 2018
How could I miss this option ...? Thanks @MSuih.
"Texture cache memory" value on debug overlay is continuously growing while I play the game. And vram usage grows every ~250MB. It is quite easy to spot when going back and forth between the same two locations or by loading the same save again and again. Why does it happen if there are no new textures to cache ?
GitArUs
on 4 Oct 2018
Does the number of unreleased textures (another thing shown on the debug overlay) also increase forever? Do you have WCB on?
ruipin
on 4 Oct 2018
WCB is off. Number of unreleased textures does not increse forever, it quickly goes up and down, between 0 and around 100.
GitArUs
on 4 Oct 2018
So it isn't that textures are being unreleased, but rather it's allocating more and more vram each time?
Fallenleader
on 4 Oct 2018
Nah, I believe I know the reason for at least one more memory leak, will need to investigate further.
ruipin
on 5 Oct 2018
Sorry, I've been quite busy IRL so am still working on this.
Just as a quick summary, thanks to the above discussion with @GitArUs I managed to reproduce at least one instance of memory leaks in P5. These seem to be caused by the texture cache losing track of whether a memory region has been modified by the game or not and failing to release the cached texture. One of them is quite rare, but the other one happens on every loading screen (causing the memory usage in the debug overlay to slowly increase with every loading screen).
I have a WIP fix for most of this bug in https://github.com/ruipin/rpcs3/commits/wip-texture-cache-pr2
A proper PR with this fix and a fix for the remaining leaks that I am aware of (related to clean unlocked blit textures) will have to wait until I decouple the texture cache predictor from the cached_texture class to fix the regression in Nier. These fixes makes that even worse since it breaks the texture cache predictor even further and regresses the performance of any game that needs WCB.
ruipin
on 19 Oct 2018
Please test #5276. It does not fix all leaks I am aware of, but should improve texture vram usage considerably.
ruipin
on 21 Oct 2018
I did not experience that vram leak before nor now but now the vram usage while doing the same things as my last test resulted in ~300mb less vram used now and it does not go up(around 650mb compared to 920)
vsub
on 21 Oct 2018
I will test it more in the evening, but so far I didn't see any improvement (P5). Should I set "Strict Texture Flushing" to true ?
Update:
5276 definitely does not change anything in my case, "strict texture flushing" has no effect either.
GitArUs
on 22 Oct 2018
I guess there may be something here.
I am playing Persona 5 for the last 4 hours and I see how little by little the ram and vram usage goes higher and higher.
Right now on 0.0.5-7503 after 4 hours on Persona 5,the ram usage is 4.73GB and the vram is 1.73GB
I did not test game with #5276
vsub
on 22 Nov 2018
As I said, there is indeed. Partially the counter was broken, but there are indeed vram leaks on master. I still need to fix the #5276 regressions, got kind of distracted by vsh stuff. But in my tests that PR does not exhibit memory leaks in P5 even after multiple hours of playtime.
ruipin
on 22 Nov 2018
Ok,I will try it tommow(right now I am still playing the game and I am at 5.75gb ram and 2.10vram)
vsub
on 22 Nov 2018
Random idea - would it be hard to add a (configurable?) texture cache size limit ? I mean - why is it allowed to grow until vram is exhausted ? Could it be flushed entirely when it reaches, for example, 1GB ? It is not a critical issue of course, modern graphics cards have more vram than 2GB and probably no one plays a game in one session long enough to exhaust 4GB.
GitArUs
on 22 Nov 2018
why is it allowed to grow until vram is exhausted ?
Its not; its a bug. Texture cache is limited by actual ps3 architecture to around 512MB (256M actual, 256M other helper structures + GPU memory partitioning)
kd-11
on 22 Nov 2018
So if all it's ok,should I expect to not go above certain mb?
I tried #5276 for an hour doing all kind of things in Persona 5(going to different locations,fighting normal\boss battles,loading different saves,voiced cutscenes and so on).
The vram usage did not go above 700mb but after that I switch to 0.0.5-7503 and played the game for maybe 4 hours and the vram usage was still 700mb.
I am not sure how to trigger this problem.
vsub
on 22 Nov 2018
Are you sure you switched back to 7503? By my testing in P5, every few loading screens on master the VRAM counter in the debug overlay goes up permanently. Any loading screen was able to trigger it, all I had to do really was walk back and forth through a loading screen to see the usage climbing slowly but surely.
Or are you measuring VRAM using a separate tool? You likely won't see the memory leaks on those since the driver will most likely figure out nothing is using the "leaked" textures and cache them in RAM instead.
ruipin
on 22 Nov 2018
You also have to keep in mind that memory allocation is done in chunks, unless you explicitly disable the chunked allocator in the debug tab. So that 700m might be much lower in reality. 700m is simply the size of the commited pool.
kd-11
on 22 Nov 2018
I am using msi afterburner with rtss but process hacker and the taskmanager are saying the same thing.
Is that wrong?
I also did another test just now on both versions.
When I was done,I endup with 324mb shown by the debug overlay(texture cache memory)and 926mb shown by anything else.
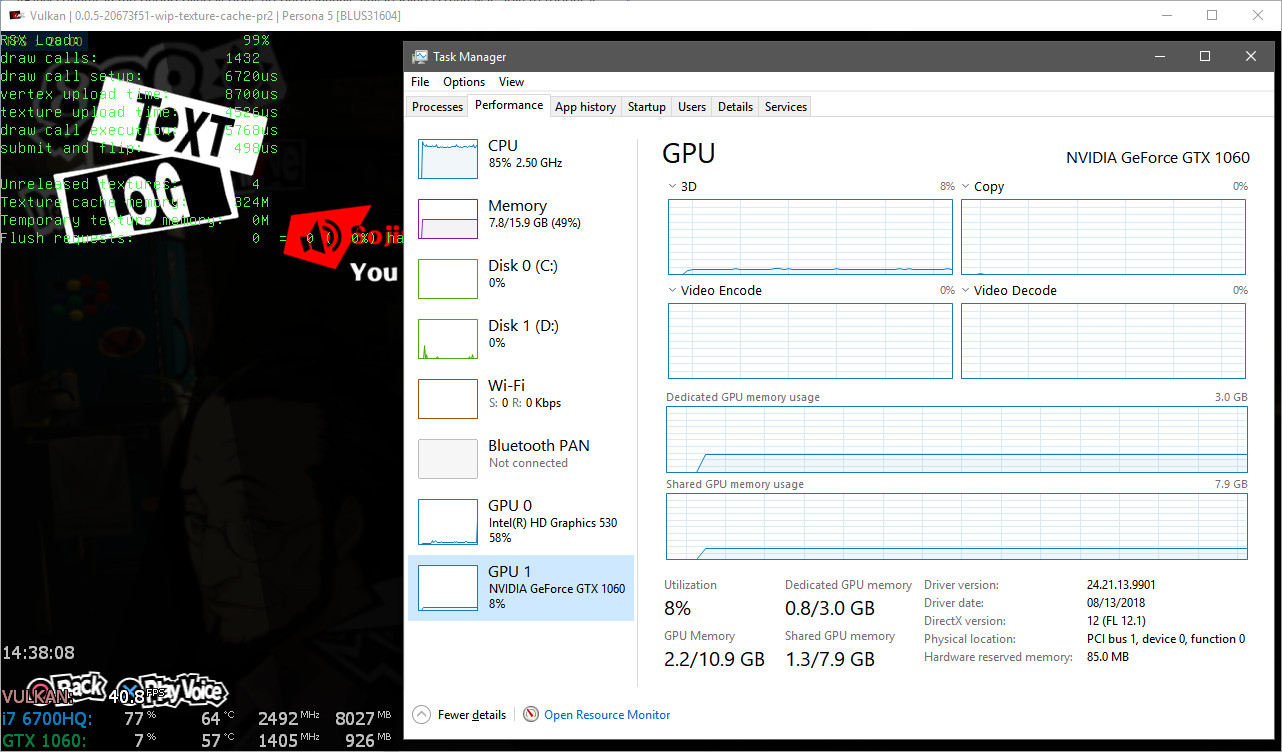
So I'm back to my question "if all it's ok,should I expect to not go above certain mb"
vsub
on 22 Nov 2018
And yes, @kd-11 that seems to be the case
If I enable the "Disable Vulkan Memory Allocator",then the vram is increasing in a lot better way(steadily)and when I reach 300mb texture cache memory,everywhere else was saying 750mb(130mb less)
vsub
on 22 Nov 2018
@vsub
I am not sure how to trigger this problem.
Go to Shibuya station square. Go (on foot) to central street. Then go back to station square. Repeat 50 times, observe texture cache memory on debug overlay. Since You only visit two locations, texture cache memory usage should not be continuously growing (I think), but it does.
GitArUs
on 22 Nov 2018
I am visiting all possible location I can access at this point,all menus entering exiting multiple times,looking at all of the personas models I have,playing battles in mementos and doing things in the velvet room.
Basically I am doing anything I can think of that will require loading textures
vsub
on 22 Nov 2018
Yestarday rpcs3(7503) on Persona 5 the window freeze(the music was still running)and when I check the vram usage in Process Hacker(I was also using rtss the whole time to watch at the vram usage),it was at 2.5gb dedicated and above 3gb shared
I was expecting something to happen when I see it using so much vram so I did not loose any progress.
So today I decided to try #5276 and after around 4 hours of gameplay,I started noticing short freezes.
The vram usage was at 1.35GB dedicated and 2.14GB shared and also rpcs3 was using 4.5gb or ram
I also notest that rpcs3 was constantly writing to the hdd and I saw that the log file(even thought I set it to fatal only)was 514mb
Disable Vulkan Memory Allocator was set to true
If the log is needed then here,it's 16mb compressed and 514mb uncompressed
https://www30.zippyshare.com/v/Su77LTxY/file.html
Also it seems that rpcs3 keeps the logging in ram so even if you make it impossible to write the log file,the log file will still be saved as a compressed gz after closing rpcs3
vsub
on 24 Nov 2018
This issue seems to be resolved in current master. I can no longer reproduce it in P5. It would be good if @Fallenleader confirmed this.
GitArUs
on 24 Mar 2019
Closing as fixed.
kd-11
on 20 Aug 2019
Related issues
 uaqlover
·
3Comments
uaqlover
·
3Comments
 Birch-san
·
3Comments
Birch-san
·
3Comments
 Nezarn
·
3Comments
Nezarn
·
3Comments
 xddxd
·
3Comments
xddxd
·
3Comments
 altiereslima
·
3Comments
altiereslima
·
3Comments
Most helpful comment
you could've compressed the log in a zip or 7z