Roslyn: Formatting a document in Roslyn takes ~20 seconds with all formatting options turned on
Version Used:
Version 15.8.0 Preview 4.0 [27815.3001.d15.8stg]
Steps to Reproduce:
Make sure formatting settings are:

- Delete .vs folder
- Restore.cmd
- Open Roslyn.sln
- Navigate to src/VisualStudio/Core/Def/Implementation/Workspace/WorkspaceFailureOutputPane.cs
- CTRL+E, D
Expected Behavior:
Formatting to be instant
Actual Behavior:
Formatting takes ~20 seconds
Trace is available at: [internalshare\public\davkean\Roslyn\FormatDocument.etl.zip].
 davkean
All 40 comments
Do you get a cancellable wait-dialog while this is happening?
 CyrusNajmabadi
on 20 Jun 2018
CyrusNajmabadi
on 20 Jun 2018
Yes, I forgot to mention that.
davkean
on 20 Jun 2018
One thing that would be helpful here (prior to actually just making things fast enough) would be if the wait-dialog showed progress along with info about what is happening. That is definitely possible to do, though it makes the most sense if the operations happen serially.
However, one thing we could potentially consider doing is actually performing the ops in parallel agains the original document, then attempting to merge in the textual changes. This is similar to how the batch-fixer works.
Pros:
- we run things in parallel, speeding things up with number of cores you have.
- because we're operating only against hte original document/semantic-model/compilation, we dont' have to compute semantics N times as we do things serially. This should also be a big speedup.
Cons:
- Because we're doing all the computations against the original doc, but then trying to merge all the text changes together, there's a decent chance that some edits will not be mergable.
To deal with the last bit, i propose the following:
while there are more cleaners to run
    run all remaining cleaners in parallel against the current doc.
        when this finishes, attempt to combine the text changes, producing the 'current doc'.
           for any cleaners that succeed, remove from the list of cleaners.
           for any that fail, keep in the list.
Effectively, we optimistically run as much as we can in parallel. Then, we use as much of the results as we can. For the results we can't merge, we just rerun that set in parallel, and then merge as much of that as we can.
Optimistically you only run this once. Pessimistically, you need to run N times. My guess is in practice it will be anywhere from 1-3 times.
CyrusNajmabadi
on 20 Jun 2018
@CyrusNajmabadi Yes that's a great idea. Above, when I ran into this, I just wanted to format the braces I just added.
davkean
on 20 Jun 2018
while there are more cleaners to run...
If two cleaners change (nearly) the same location, causing a conflict, wouldn't that result in an endless loop?
 bkoelman
on 20 Jun 2018
bkoelman
on 20 Jun 2018
@bkoelman > If two cleaners change (nearly) the same location, causing a conflict, wouldn't that result in an endless loop?
No. Because we'll always take at least one of them. It's not "if cleaner A conflicts with anything, do not use it", it's:
have current-doc. apply cleaner 1's fixes to it. then try to apply cleaner 2's fixes, then cleaner 3... up to cleaner N's fixes." 'cleaner 1' will always succeed in applying its change.
That's why the worst case is this happens N times. However, my opinion (which should be validated in practice) is that you'll only have a tiny handful of conflicts, leading to at most 3 passes, with each pass culling the list greatly.
CyrusNajmabadi
on 20 Jun 2018
I have a PR for this here: https://github.com/dotnet/roslyn/pull/28029
CyrusNajmabadi
on 20 Jun 2018
@davkean does it take 20 seconds every single time? or just the first time when it has something to change?
 heejaechang
on 21 Jun 2018
heejaechang
on 21 Jun 2018
It was the same time every time it ran, even if nothing changed.
davkean
on 21 Jun 2018
I bet it is due to "remove unnecessary cast" code transformation. can you turn that off and run?
heejaechang
on 21 Jun 2018
@heejaechang Turning off "remove unnecessary cast" had barely any effect on my perf run. It shaved off maybe a few seconds.
CyrusNajmabadi
on 21 Jun 2018
@jinujoseph from the conversation over in https://github.com/dotnet/roslyn/pull/28029, it's clear there are several problems here.
From @heejaechang's posts:
looks like something has changed. I explicitly made code clean up not to use fix all code path and made it to give fix all service all diagnostics needed. callstack looks like that is not the case...
might be one of code clean @JieCarolHu did to merge 2 API to one cause it to use fix all code path...
looks like it is running whole compilation (project), not just current document.
anyway, it looks like a bug. we should change it back to use inproc, document only analysis rather than whole project.
Can this be assigned to someone so this issue can be resolved? 20 seconds to format is really bad. On my own machine it's can be upwards of 100+ seconds! Clearly, something has gone very wrong. And we would need to fix this asap before this hits more customers
CyrusNajmabadi
on 21 Jun 2018
@jinujoseph @kuhlenh This investigation is far more important now. Based on the post here: https://github.com/dotnet/roslyn/pull/28069#issuecomment-400671556, it sounds like you're enabling this feature by default. If that's the case, then the performance absolutely has to be improved. I'm seeing easily 60+ seconds on some files.
We should not be opting people into different behavior with such a dramatic perf problem.
CyrusNajmabadi
on 27 Jun 2018
@JieCarolHu is already looking
heejaechang
on 27 Jun 2018
 JieCarolHu
on 28 Jun 2018
JieCarolHu
on 28 Jun 2018
Latest numbers using the fixes by @JieCarolHu here: https://github.com/dotnet/roslyn/pull/28196
And from me here: https://github.com/dotnet/roslyn/pull/28280
I'm down to about 15 seconds on a huge file (LanguageParser.cs). This is down from several-hundred seconds for the same file:
Current trace shows this:
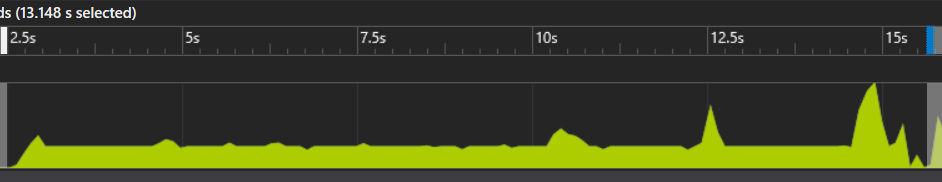
Note the saturation of only a single core. https://github.com/dotnet/roslyn/pull/28029 can help with that. However, @mavasani has concerns about running things in parallel in case we want an explicit ordering between fixes.
Unfortunately, it's not very clear (just yet) who the culprits are here. THe primary problem is that the perf trace is showing me this:

Unfortunately, this is the base-type for so many fixers. I need to find a way to know waht the actual fix-instance is here so we can try to optimize whichever fixes are actually causing this.
CyrusNajmabadi
on 5 Jul 2018
@mavasani @heejaechang @JieCarolHu I've profiled this a bunch (after applying my changes and @JieCarolHu's changes. The perf traces now are concerning for another reason. Basically, i see the vast majority of the time spent now here:
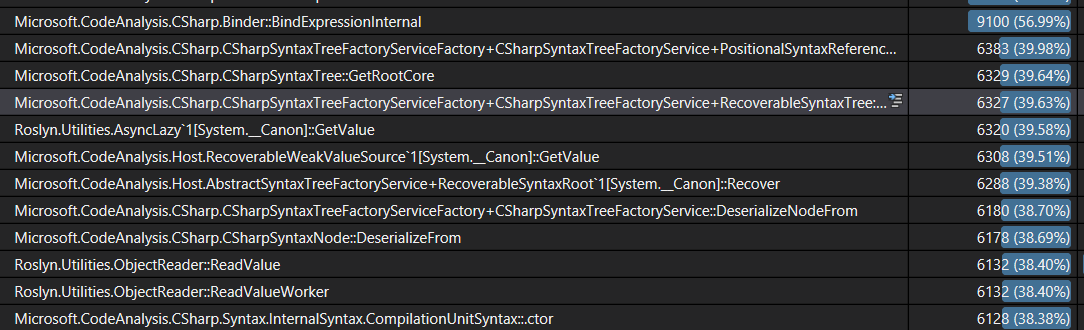
Basically, we are spending 40% of the time of the entire scenario only deserializing trees. This indicates to me that something is going very wrong with our caches. I'm running inside CSharpCodeAnalysis. Thsi project only depends on CodeAnalysis, which doesn't have any project dependencies itself.
So somehow despite running code on what is essentially only two projects, we're dumping and rehydrating enough to account for a full 40% of the run...
Somethings seems super bad here. I don't know if we regressed something here. But i think this def needs to be looked at as this can also heavily affect the rest of the IDE featureset.
Also tagging @sharwell and @jinujoseph for visibility here.
CyrusNajmabadi
on 6 Jul 2018
Note: this reproes every time i run fix-document. Which indicates that we keep hydrating these trees, and then throwing them out. Something is very much off-the-rails here. @jinujoseph Who is the best person to investigate and address this issue? Note: this affects a very high-visibility feature that is being shipped out to customers now.
CyrusNajmabadi
on 6 Jul 2018
we probably need to first confirm that those trees are used by code clean up feature or not. doesn't feels like this perf is measured after disabling all other features. you should either disable all other features when doing this kind of optimization to make sure you are getting data from the actual source or not, or have a way to distinguish data from 1 feature from other others.
second, unless we changed our cache, our current cache is really simple. we cache all trees for project active document belong to
http://source.roslyn.io/#Microsoft.VisualStudio.LanguageServices/Implementation/Workspace/VisualStudioProjectCacheHostServiceFactory.cs,100
heejaechang
on 9 Jul 2018
second, unless we changed our cache, our current cache is really simple. we cache all trees for project active document belong to
Right... so something is very bad here. Because as part of this, i've reached a steady state, have invoked the feature, and now it takes a super long time because trees aare continually being rehydrated.
This is what i thin you should be looking into fixing here. It's really bad, and it indicates something is totally broken in our caching logic.
we probably need to first confirm that those trees are used by code clean up feature or not.
They are. Everything has reached steady state, and these are Bind-calls inside the compiler when we're invoking the code/cleanup feature. Tehse Bind calls are causing the compiler to retrieve locations. But those locations are causing the trees to be rehydrated. Obviously, this is not good, and vioaltes the above assumption that we're keeping around all the trees for the 'active project'.
CyrusNajmabadi
on 9 Jul 2018
@heejaechang Can you take a look at this perf issue? I've tried to wrap my head around VS's caching logic, and it has always been too confusing and difficult to understand for me. I'm not sure who else on the team would be best to investigate this. Maybe @sharwell . However, it seems like you have the most knowledge and experience wrt how that is supposed to work and what might be causing it to go wrong.
CyrusNajmabadi
on 9 Jul 2018
as soon as code clean up is done, our ambient features such as nav bar, solution crawler, colorizer will kick in, you need to separate out those.
heejaechang
on 9 Jul 2018
@heejaechang These are the perf numbers while code cleanup is running. No changes have actually happened in the slice of time that i have selected.
our ambient features such as nav bar, solution crawler, colorizer will kick in, you need to separate out those.
None of these features are running because no changes ever happened to the project, and the project was at a stable state.
As I mentioned already: these rehydrations are caused by Bind calls in the compiler that are happening in the code-path caused by CodeCleanup. The compiler has Location objects and is trying to map them back to Syntax. As you have stated, this should cause no rehydration because all the trees should be cached because i only have one file open in one project.
--
As before, can you please take a look here? This conversation feels like exactly the same conversation that led to @JieCarolHu having to make her latest PRs. The claim there was that OOP was not involved and that we were only processing the current document. Both of those were wrong. Right now, the claim is that we should have all the files for the active project cached. But htat seems wrong as well. Either they are not cached (and that's a problem). Or htey are cached, but we're still hydrating (and that's a problem).
It's frustrating doing all this investigation and having so much trouble getting traction from the team to actually investigate these very significant problems. I'm surprised that i've had to go do it myself and have to push so hard given how severe the experience is. I'm doing this primarily because i want Roslyn to be well perceived, and because the perf impact when i use it myself is so bad currently. I really wish i could get more support and effort on these reports instead of having to do all this work myself in my spare time.
CyrusNajmabadi
on 9 Jul 2018
tagging @jinujoseph @kuhlenh
but, I think we need to set priority first since people are working on other 15.8 issues.
since I don't think we have changed caching since Kyle left the team, our cache behavior should be same since then. so now the question is its impact on code clean up, and I guess that can only be answered by what is current experience on code clean up with default options on with reasonable file size.
heejaechang
on 9 Jul 2018
but, I think we need to set priority first since people are working on other 15.8 issues.
I don't think ti's a good idea to ship features that people can turn on that tank performance. Our features shoudl meet an appropriate quality bar, and that means things like being stable, working well, being fast enough, etc. etc.
We don't get to just ship features and then wash our hands of it because someone didn't do a good job on caching years ago. Or because we haven't actually checked off a lot of boxes in a UI. We are shipping the ability for users to actually use this feature and it behooves us to actually ship something usable by them. If a user turns the feature on and the performance is terrible (which is waht it is currently) then that's on us to actually make good.
As long as a user can enable a feature, then that is a real feature that should meet Roslyn standards. And that includes being fast enough to have a good experience.
We shipped this. The onus is on us to actually complete things. We can't just ship and then say "well people are working on other things now". Otherwise, why bother even having quality standards for Roslyn? I'd be happy to write tons of features without needing the quality/perf be high enough. But i don't think that's acceptable, and i don't think customers will think so either :-/
CyrusNajmabadi
on 9 Jul 2018
@jinujoseph @kuhlenh
Can we please get some more attention focused in this area? Not only is this an area where the feature is being turned on automatically. But it's also something you are heavily advertising with things like a 'Gold Bar'. If the intent is to strongly push people toward using this (and i also assume it's to help with competition), then we need to put our best foot forward and actually ensure that the feature (and the options people can and will use) actually work well. Otherwise, this will just feed into the perception that VS is slow and bloated and that teams delivering features don't do enough due diligence to make the experience acceptable.
Thanks!
CyrusNajmabadi
on 9 Jul 2018
I have been using code cleanup for a while now with default (not even smaller default we have now changed to) and I use "format document" a lot and I didn't feel it was that bad or unusable. but this is subjective matter. so @jinujoseph and @kuhlenh
heejaechang
on 9 Jul 2018
@CyrusNajmabadi plan is not to turn the feature on by default. It's a experimental feature which we are promoting via gold bar. Thanks for bringing the perf issue and we will be investigating and improve continuously but don't see as a ship blocker for this feature.
 jinujoseph
on 9 Jul 2018
jinujoseph
on 9 Jul 2018
And i regularly hit 20+ second pauses. I've hit 60+ seconds. It doesn't help that cancelling was also broken (though i have a PR to help fix that).
I have been using code cleanup for a while now with default
The 'default' is not sufficient. We are shipping this system with teh ability for users to turn all of these on. This is a supported configuration that people will use. We need to actually test and use our product in the real scenarios we're allowing users to use. Not in idealized scenarios where we are not actually running everything.
Users are going to get the gold bar. They're going to go "oh, that sounds nice". They're going to be taken to tools|options. And they will turn on all the options.
CyrusNajmabadi
on 9 Jul 2018
@CyrusNajmabadi plan is not to turn the feature on by default.
Wait... :) So the design changed again? Because it was previously not on by default. But then the design was changed to turn it on by default during preview (but off at RTM). But then @sharwell said that the decision changed again, and it would be on by default (even at RTM).
see https://github.com/dotnet/roslyn/issues/28068 for the bug tracking making this 'off by default', which was closed.
If the feature will be 'off by default', can you reactivate this bug so that this change actually happens? Also, can there be some better way of notifying about the changes in the design. So far, every notification has happened in a comment in some random PR or issue surrounding this topic. IT's hard to know what the actual design is when it keeps changing and isn't messages out :-/
CyrusNajmabadi
on 9 Jul 2018
well. rename things like syntaxnode or fix all for solution on Roslyn easily takes several hours. that doesn't stop me from using rename or fix all features. probably same for other solution wide features.
it is up to users whether they enable all possible fixes or not. and how long it takes will depend on inputs.
I am not saying we shouldn't fix it or look at it. but I agree with @jinujoseph that it is not blocker.
heejaechang
on 9 Jul 2018
this is experimental so that we can keep change design without too much cost
heejaechang
on 9 Jul 2018
or fix all for solution on Roslyn easily takes several hours.
This is not acceptable to me. And i'm surprised anyone on the team woudl find that acceptable. When i've worked on fixers myself, i always end up running on things on Roslyn to get a sense of how long things take.
For example, even the most recent fixer around adding/removing parentheses was tested against Roslyn itself to ensure suitable performance. This was always part of our process around analyzers/fixers. So we should be continuing that and we should be steadfastly fixing performance issues we have shipped, instead of just accepting them and saying that it's acceptable for a fix to take "hours"...
@kuhlenh What guidelines to we have around performance? Are there divisional thoughts on what is a good enough experience?
CyrusNajmabadi
on 9 Jul 2018
if a tool can do it faster than me doing manually than I am good most of the time. if it can do faster. awesome but it is a tool so as long as it can do what I need it to do, as long as it does it faster than me doing it otherwise, I am good.
one can always do optimization. so we should have a goal rather than just saying we can do it faster.
for example, exchange team which has bigger solution than us which contains 500 projects and almost reach 4GB memory space by just opening solution, can say whatever goal we made is unacceptable and terrible.
heejaechang
on 9 Jul 2018
I didn't dig through but just remembered this
http://source.roslyn.io/#Microsoft.CodeAnalysis.Workspaces/Workspace/Solution/Solution.cs,879
code fix might be not using PreserveIdentity but use PreserveValue when updating solution with new tree. that basically ask roslyn to save new tree to disk and kick out from memory if possible.
we use it "PreserveValue" as default to be safe (otherwise, certain big fix all or rename can cause OOM since it can cause a lot of trees to be changed and cause us to hold all those in memory)
probably future work to improve though since right now, it is each fixer that decides how to update solution, not engine.
and why fixer is called is not visible to fixer I believe. (we could use Scope being Custom or Document I guess for now?)
anyway, this should be something engine can enforce not let each fixer can control ..
heejaechang
on 10 Jul 2018
Why was this closed? Can't seen any linked PR to fix this.
davkean
on 17 Jul 2018
https://github.com/dotnet/roslyn/issues/28012#issuecomment-401182992
the link is high up there.
...
is your issue still repro?
heejaechang
on 17 Jul 2018
@jinujoseph looks like @CyrusNajmabadi put another issue in this issue. should we open new issue for it or keep this issue open?
heejaechang
on 17 Jul 2018
@heejaechang can you file a new issue to track
jinujoseph
on 17 Jul 2018
Related issues
 johndog
·
3Comments
johndog
·
3Comments
 vbcodec
·
3Comments
vbcodec
·
3Comments
 NikChao
·
3Comments
NikChao
·
3Comments
 AceHack
·
3Comments
AceHack
·
3Comments
 AdamSpeight2008
·
3Comments
AdamSpeight2008
·
3Comments