Rke: Job [rke-network-plugin-deploy-job] deletion timed out.
Job [rke-network-plugin-deploy-job] deletion times out during restoring a snapshot process, however, this only happens to one particular snapshot and when I try to restore some other snapshot it works without any errors.
RKE version:
I'm using RKE v1.1.3
Docker version:
Docker version 19.03.15, build 99e3ed8919
Operating system and kernel:
PRETTY_NAME="Debian GNU/Linux 10 (buster)"
NAME="Debian GNU/Linux"
VERSION_ID="10"
VERSION="10 (buster)"
VERSION_CODENAME=buster
ID=debian
Type/provider of hosts: (VirtualBox/Bare-metal/AWS/GCE/DO)
ESXi Virtual Machines
cluster.yml file:
nodes:
- address: 172.31.21.18
port: "22"
internal_address: ""
role:
- controlplane
- etcd
hostname_override: ""
user: rke
docker_socket: /var/run/docker.sock
ssh_key: ""
ssh_key_path: /root/.ssh/id_rsa
ssh_cert: ""
ssh_cert_path: ""
labels: {}
taints: []
- address: 172.31.21.19
port: "22"
internal_address: ""
role:
- controlplane
- etcd
hostname_override: ""
user: rke
docker_socket: /var/run/docker.sock
ssh_key: ""
ssh_key_path: /root/.ssh/id_rsa
ssh_cert: ""
ssh_cert_path: ""
labels: {}
taints: []
- address: 172.31.21.20
port: "22"
internal_address: ""
role:
- worker
hostname_override: ""
user: rke
docker_socket: /var/run/docker.sock
ssh_key: ""
ssh_key_path: /root/.ssh/id_rsa
ssh_cert: ""
ssh_cert_path: ""
labels: {}
taints: []
services:
etcd:
image: ""
extra_args: {}
extra_binds: []
extra_env: []
external_urls: []
ca_cert: ""
cert: ""
key: ""
path: ""
uid: 0
gid: 0
snapshot: null
retention: ""
creation: ""
backup_config: null
kube-api:
image: ""
extra_args: {}
extra_binds: []
extra_env: []
service_cluster_ip_range: 10.43.0.0/16
service_node_port_range: ""
pod_security_policy: false
always_pull_images: false
secrets_encryption_config: null
audit_log: null
admission_configuration: null
event_rate_limit: null
kube-controller:
image: ""
extra_args: {}
extra_binds: []
extra_env: []
cluster_cidr: 10.42.0.0/16
service_cluster_ip_range: 10.43.0.0/16
scheduler:
image: ""
extra_args: {}
extra_binds: []
extra_env: []
kubelet:
image: ""
extra_args: {}
extra_binds: []
extra_env: []
cluster_domain: cluster.local
infra_container_image: ""
cluster_dns_server: 10.43.0.10
fail_swap_on: false
generate_serving_certificate: false
kubeproxy:
image: ""
extra_args: {}
extra_binds: []
extra_env: []
network:
plugin: canal
options: {}
mtu: 0
node_selector: {}
update_strategy: null
authentication:
strategy: x509
sans: []
webhook: null
- worker
addons: ""
addons_include: []
system_images:
etcd: rancher/coreos-etcd:v3.4.3-rancher1
alpine: rancher/rke-tools:v0.1.58
nginx_proxy: rancher/rke-tools:v0.1.58
cert_downloader: rancher/rke-tools:v0.1.58
kubernetes_services_sidecar: rancher/rke-tools:v0.1.58
kubedns: rancher/k8s-dns-kube-dns:1.15.2
dnsmasq: rancher/k8s-dns-dnsmasq-nanny:1.15.2
kubedns_sidecar: rancher/k8s-dns-sidecar:1.15.2
kubedns_autoscaler: rancher/cluster-proportional-autoscaler:1.7.1
coredns: rancher/coredns-coredns:1.6.9
coredns_autoscaler: rancher/cluster-proportional-autoscaler:1.7.1
nodelocal: rancher/k8s-dns-node-cache:1.15.7
kubernetes: rancher/hyperkube:v1.18.3-rancher2
flannel: rancher/coreos-flannel:v0.12.0
flannel_cni: rancher/flannel-cni:v0.3.0-rancher6
calico_node: rancher/calico-node:v3.13.4
calico_cni: rancher/calico-cni:v3.13.4
calico_controllers: rancher/calico-kube-controllers:v3.13.4
calico_ctl: rancher/calico-ctl:v3.13.4
calico_flexvol: rancher/calico-pod2daemon-flexvol:v3.13.4
canal_node: rancher/calico-node:v3.13.4
canal_cni: rancher/calico-cni:v3.13.4
canal_flannel: rancher/coreos-flannel:v0.12.0
canal_flexvol: rancher/calico-pod2daemon-flexvol:v3.13.4
weave_node: weaveworks/weave-kube:2.6.4
weave_cni: weaveworks/weave-npc:2.6.4
pod_infra_container: rancher/pause:3.1
ingress: rancher/nginx-ingress-controller:nginx-0.32.0-rancher1
ingress_backend: rancher/nginx-ingress-controller-defaultbackend:1.5-rancher1
metrics_server: rancher/metrics-server:v0.3.6
windows_pod_infra_container: rancher/kubelet-pause:v0.1.4
ssh_key_path: /root/.ssh/id_rsa
ssh_cert_path: ""
ssh_agent_auth: false
authorization:
mode: rbac
options: {}
ignore_docker_version: null
kubernetes_version: ""
private_registries: []
ingress:
provider: ""
options: {}
node_selector: {}
extra_args: {}
dns_policy: ""
extra_envs: []
extra_volumes: []
extra_volume_mounts: []
update_strategy: null
cluster_name: ""
cloud_provider:
name: ""
prefix_path: ""
addon_job_timeout: 5000
bastion_host:
address: ""
port: ""
user: ""
ssh_key: ""
ssh_key_path: ""
ssh_cert: ""
ssh_cert_path: ""
monitoring:
provider: ""
options: {}
node_selector: {}
update_strategy: null
replicas: null
restore:
restore: false
snapshot_name: ""
dns: null
Steps to Reproduce:
the snapshot is locally stored on etcd node in /opt/rke/etcd-snapshots/
after executing the command rke etcd snapshot-restore --name <NAME> it gives a fatal error saying FATA[0346] [k8s] Job [rke-network-plugin-deploy-job] deletion timed out. Consider increasing addon_job_timeout value, however, this only happens with one particular snapshot and using another snapshot works fine.
Results:
INFO[0375] [worker] Successfully started [rke-log-linker] container on host [172.31.21.18]
INFO[0376] [worker] Successfully started [rke-log-linker] container on host [172.31.21.19]
INFO[0377] Removing container [rke-log-linker] on host [172.31.21.18], try #1
INFO[0377] [remove/rke-log-linker] Successfully removed container on host [172.31.21.18]
INFO[0377] Image [rancher/hyperkube:v1.18.3-rancher2] exists on host [172.31.21.18]
INFO[0378] Removing container [rke-log-linker] on host [172.31.21.19], try #1
INFO[0378] [remove/rke-log-linker] Successfully removed container on host [172.31.21.19]
INFO[0378] Image [rancher/hyperkube:v1.18.3-rancher2] exists on host [172.31.21.19]
INFO[0379] Starting container [kube-proxy] on host [172.31.21.18], try #1
INFO[0380] Starting container [kube-proxy] on host [172.31.21.19], try #1
INFO[0380] [worker] Successfully started [kube-proxy] container on host [172.31.21.18]
INFO[0380] [healthcheck] Start Healthcheck on service [kube-proxy] on host [172.31.21.18]
INFO[0381] [worker] Successfully started [kube-proxy] container on host [172.31.21.19]
INFO[0381] [healthcheck] Start Healthcheck on service [kube-proxy] on host [172.31.21.19]
INFO[0383] [healthcheck] service [kubelet] on host [172.31.21.20] is healthy
INFO[0383] Image [rancher/rke-tools:v0.1.58] exists on host [172.31.21.20]
INFO[0386] Starting container [rke-log-linker] on host [172.31.21.20], try #1
INFO[0386] [healthcheck] service [kube-proxy] on host [172.31.21.18] is healthy
INFO[0386] Image [rancher/rke-tools:v0.1.58] exists on host [172.31.21.18]
INFO[0387] [healthcheck] service [kube-proxy] on host [172.31.21.19] is healthy
INFO[0387] Image [rancher/rke-tools:v0.1.58] exists on host [172.31.21.19]
INFO[0387] [worker] Successfully started [rke-log-linker] container on host [172.31.21.20]
INFO[0389] Starting container [rke-log-linker] on host [172.31.21.18], try #1
INFO[0390] Removing container [rke-log-linker] on host [172.31.21.20], try #1
INFO[0390] [remove/rke-log-linker] Successfully removed container on host [172.31.21.20]
INFO[0390] Image [rancher/hyperkube:v1.18.3-rancher2] exists on host [172.31.21.20]
INFO[0391] Starting container [rke-log-linker] on host [172.31.21.19], try #1
INFO[0391] Starting container [kube-proxy] on host [172.31.21.20], try #1
INFO[0392] [worker] Successfully started [rke-log-linker] container on host [172.31.21.18]
INFO[0393] [worker] Successfully started [kube-proxy] container on host [172.31.21.20]
INFO[0393] [healthcheck] Start Healthcheck on service [kube-proxy] on host [172.31.21.20]
INFO[0393] [worker] Successfully started [rke-log-linker] container on host [172.31.21.19]
INFO[0393] Removing container [rke-log-linker] on host [172.31.21.18], try #1
INFO[0394] [remove/rke-log-linker] Successfully removed container on host [172.31.21.18]
INFO[0395] Removing container [rke-log-linker] on host [172.31.21.19], try #1
INFO[0395] [remove/rke-log-linker] Successfully removed container on host [172.31.21.19]
INFO[0398] [healthcheck] service [kube-proxy] on host [172.31.21.20] is healthy
INFO[0398] Image [rancher/rke-tools:v0.1.58] exists on host [172.31.21.20]
INFO[0400] Starting container [rke-log-linker] on host [172.31.21.20], try #1
INFO[0402] [worker] Successfully started [rke-log-linker] container on host [172.31.21.20]
INFO[0402] Removing container [rke-log-linker] on host [172.31.21.20], try #1
INFO[0403] [remove/rke-log-linker] Successfully removed container on host [172.31.21.20]
INFO[0403] [worker] Successfully started Worker Plane..
INFO[0403] Image [rancher/rke-tools:v0.1.58] exists on host [172.31.21.20]
INFO[0403] Image [rancher/rke-tools:v0.1.58] exists on host [172.31.21.18]
INFO[0403] Image [rancher/rke-tools:v0.1.58] exists on host [172.31.21.19]
INFO[0406] Starting container [rke-log-cleaner] on host [172.31.21.20], try #1
INFO[0407] Starting container [rke-log-cleaner] on host [172.31.21.19], try #1
INFO[0407] Starting container [rke-log-cleaner] on host [172.31.21.18], try #1
INFO[0408] [cleanup] Successfully started [rke-log-cleaner] container on host [172.31.21.20]
INFO[0408] Removing container [rke-log-cleaner] on host [172.31.21.20], try #1
INFO[0409] [remove/rke-log-cleaner] Successfully removed container on host [172.31.21.20]
INFO[0409] [cleanup] Successfully started [rke-log-cleaner] container on host [172.31.21.18]
INFO[0409] [cleanup] Successfully started [rke-log-cleaner] container on host [172.31.21.19]
INFO[0410] Removing container [rke-log-cleaner] on host [172.31.21.18], try #1
INFO[0411] [remove/rke-log-cleaner] Successfully removed container on host [172.31.21.18]
INFO[0411] Removing container [rke-log-cleaner] on host [172.31.21.19], try #1
INFO[0411] [remove/rke-log-cleaner] Successfully removed container on host [172.31.21.19]
INFO[0411] [sync] Syncing nodes Labels and Taints
INFO[0411] [sync] Successfully synced nodes Labels and Taints
INFO[0411] [network] Setting up network plugin: canal
INFO[0411] [addons] Saving ConfigMap for addon rke-network-plugin to Kubernetes
INFO[0412] [addons] Successfully saved ConfigMap for addon rke-network-plugin to Kubernetes
INFO[0412] [addons] Executing deploy job rke-network-plugin
FATA[0500] [k8s] Job [rke-network-plugin-deploy-job] deletion timed out. Consider increasing addon_job_timeout value
 Skipper0707
All 16 comments
Apparently that snapshot has a lot of resources that take time or resources to load/process causing the timeout to be hit. In v1.2 line we already raised the timeout in https://github.com/rancher/rke/pull/2289, for now you can manually raise the timeout. If you want to know why this happens with this snapshot, I either need the snapshot or I can give you commands to get an idea why it might happen.
 superseb
on 21 Apr 2021
superseb
on 21 Apr 2021
Apparently that snapshot has a lot of resources that take time or resources to load/process causing the timeout to be hit. In v1.2 line we already raised the timeout in #2289, for now you can manually raise the timeout. If you want to know why this happens with this snapshot, I either need the snapshot or I can give you commands to get an idea why it might happen.
Thank you for your guidance that totally makes sense actually. Also so sorry for responding so late.
I'd be delighted if you could give me those commands.
Skipper0707
on 23 Apr 2021
Please share the output of:
ls -la /opt/rke/etcd-snapshots/NAME(for the size of the snapshot)ls -laof the snapshot file itself inside the archive (if possible)- When restore is done using the snapshot, please run the following to get a resource count overview of what is in the snapshot:
docker exec etcd etcdctl get /registry --prefix=true --keys-only | grep -v ^$ | awk -F'/' '{ if ($3 ~ /cattle.io/) {h[$3"/"$4]++} else { h[$3]++ }} END { for(k in h) print h[k], k }' | sort -n - Also the output of the commands from that involve endpoint, so endpoint health and endpoint status: https://rancher.com/docs/rancher/v2.x/en/troubleshooting/kubernetes-components/etcd/
superseb
on 23 Apr 2021
Please share the output of:
* `ls -la /opt/rke/etcd-snapshots/NAME` (for the size of the snapshot)

* `ls -la` of the snapshot file itself inside the archive (if possible)

* When restore is done using the snapshot, please run the following to get a resource count overview of what is in the snapshot: `docker exec etcd etcdctl get /registry --prefix=true --keys-only | grep -v ^$ | awk -F'/' '{ if ($3 ~ /cattle.io/) {h[$3"/"$4]++} else { h[$3]++ }} END { for(k in h) print h[k], k }' | sort -n`

* Also the output of the commands from that involve endpoint, so endpoint health and endpoint status: https://rancher.com/docs/rancher/v2.x/en/troubleshooting/kubernetes-components/etcd/
My gratitude for sharing these commands, the outputs are as following:
- The snapshot size ( archived ) is 33 MB.
- The snapshot size ( unarchived ) is 167 MB.
- I cannot give you the output of the third one since the snapshot hasn't been restored successfully. However, I just successfully restored another snapshot with much less size ( 3 MB archived ) therefore I'd be delighted if you could tell me what would be the solution to successfully restore the 33 MB one.
- As for the endpoint status:

- And for endpoint health:
https://172.31.21.19:2379 is healthy: successfully committed proposal: took = 153.381508ms
https://172.31.21.18:2379 is healthy: successfully committed proposal: took = 242.511842ms
Skipper0707
on 24 Apr 2021
Please include the full log of the snapshot-restore action with --debug included so we get debug logging.
superseb
on 24 Apr 2021
Please include the full log of the snapshot-restore action with
--debugincluded so we get debug logging.
@superseb Thank you so much for your patience and guidance, here is the log file you requested along with my regards.
fail.log
Skipper0707
on 24 Apr 2021
The part where the etcd snapshot gets restored does not show any errors, what is the output when you run the etcdctl commands? And what are the logs from the etcd container? If it can't be restored successfully, RKE should log that and error out but I need to know what the state of etcd is.
superseb
on 24 Apr 2021
The part where the etcd snapshot gets restored does not show any errors, what is the output when you run the etcdctl commands? And what are the logs from the
etcdcontainer? If it can't be restored successfully, RKE should log that and error out but I need to know what the state of etcd is.
Thank you again for your guidance and apologies in advance if I'm doing anything wrong I'm fairly new to this, I ran the command docker logs etcd and made a log file and as for the etcdctl command I ran etcdctl cluster-health, here's the results, again apologies if I didn't do it right.
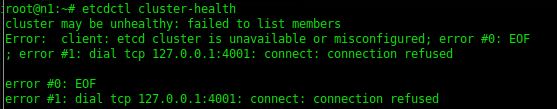
etcd.log
These stats are for after the snapshot-restore action was timed out.
Skipper0707
on 25 Apr 2021
The screenshot does not show the exact commands that I posted earlier, it will not work if you don't use the exact command. Similar to the other 2 commands regarding endpoint, please use the exact commands from the comment earlier and from the troubleshooting page and share the error if the command does not work (including the command you used).
Based on the logs the storage seems to be not fast enough (or at least the log shows a long execute time for a lot of requests), what kind/type of disk are in the server?
superseb
on 25 Apr 2021
The screenshot does not show the exact commands that I posted earlier, it will not work if you don't use the exact command. Similar to the other 2 commands regarding endpoint, please use the exact commands from the comment earlier and from the troubleshooting page and share the error if the command does not work (including the command you used).
Based on the logs the storage seems to be not fast enough (or at least the log shows a long execute time for a lot of requests), what kind/type of disk are in the server?
The result of executing
docker exec etcd etcdctl get /registry --prefix=true --keys-only | grep -v ^$ | awk -F'/' '{ if ($3 ~ /cattle.io/) {h[$3"/"$4]++} else { h[$3]++ }} END { for(k in h) print h[k], k }' | sort -ncommand is as follows:
1 acme.cert-manager.io
1 management.cattle.io/listenconfigs
1 mutatingwebhookconfigurations
1 storageclasses
2 management.cattle.io/notifiers
2 management.cattle.io/podsecuritypolicytemplates
2 management.cattle.io/projectcatalogs
2 masterleases
2 networkpolicies
2 podsecuritypolicy
2 priorityclasses
2 ranges
2 validatingwebhookconfigurations
3 crd.projectcalico.org
4 cert-manager.io
4 jobs
4 management.cattle.io/cisbenchmarkversions
4 management.cattle.io/features
5 daemonsets
5 management.cattle.io/cisconfigs
5 statefulsets
6 management.cattle.io/catalogs
6 management.cattle.io/clustercatalogs
6 management.cattle.io/clusters
8 csinodes
8 minions
9 management.cattle.io/kontainerdrivers
10 leases
11 management.cattle.io/clusterregistrationtokens
12 ingress
12 management.cattle.io/authconfigs
12 persistentvolumeclaims
12 persistentvolumes
14 argoproj.io
14 management.cattle.io/nodes
15 management.cattle.io/nodedrivers
16 monitoring.coreos.com
17 management.cattle.io/dynamicschemas
17 management.cattle.io/globalroles
19 deployments
19 management.cattle.io/projectalertgroups
19 management.cattle.io/projects
21 management.cattle.io/userattributes
22 management.cattle.io/clusterroletemplatebindings
28 controllerrevisions
30 management.cattle.io/clusteralertgroups
32 management.cattle.io/etcdbackups
33 management.cattle.io/rkeaddons
34 management.cattle.io/projectalertrules
38 management.cattle.io/preferences
38 project.cattle.io/apps
39 management.cattle.io/roletemplates
40 apiregistration.k8s.io
41 management.cattle.io/rkek8sserviceoptions
42 endpointslices
46 management.cattle.io/users
48 management.cattle.io/globalrolebindings
48 management.cattle.io/tokens
50 pods
51 replicasets
59 configmaps
61 management.cattle.io/settings
66 management.cattle.io/projectroletemplatebindings
76 project.cattle.io/sourcecodeproviderconfigs
85 management.cattle.io/clusteralertrules
89 services
92 namespaces
108 project.cattle.io/apprevisions
111 management.cattle.io/clustermonitorgraphs
119 management.cattle.io/rkek8ssystemimages
133 project.cattle.io/pipelinesettings
137 apiextensions.k8s.io
142 serviceaccounts
170 events
178 roles
191 secrets
209 clusterroles
247 management.cattle.io/projectmonitorgraphs
524 management.cattle.io/catalogtemplates
526 clusterrolebindings
693 management.cattle.io/monitormetrics
4007 rolebindings
22404 management.cattle.io/catalogtemplateversionsAs for endpoint status:

- As for endpoint health:
https://172.31.21.18:2379 is healthy: successfully committed proposal: took = 29.468433ms
https://172.31.21.19:2379 is healthy: successfully committed proposal: took = 35.606272ms
Therefore I imagine it's safe to say that the commands work.
The type of the disk is VM Disk.
Skipper0707
on 26 Apr 2021
It seems the machines are not fast enough to make sure the pods come up in time before the timeout. Raising the timeout or running rke up again makes sure there is more time to wait for the pods to become ready. What Rancher version have you been running on this cluster?
Also, please post full specifications of the machines (CPU/memory/disk type and IOPS) to determine if the machines are adequate. See https://www.ibm.com/cloud/blog/using-fio-to-tell-whether-your-storage-is-fast-enough-for-etcd for more info.
superseb
on 26 Apr 2021
The Rancher version installed on the cluster is V2.4.4.
Memory info:
MemTotal: 8169968 kB
MemFree: 5375820 kB
MemAvailable: 6970496 kB
Buffers: 115116 kB
Cached: 1380532 kB
SwapCached: 0 kB
Active: 1263600 kB
Inactive: 1284460 kB
Active(anon): 749072 kB
Inactive(anon): 16708 kB
Active(file): 514528 kB
Inactive(file): 1267752 kB
Unevictable: 0 kB
Mlocked: 0 kB
SwapTotal: 0 kB
SwapFree: 0 kB
Dirty: 184 kB
Writeback: 0 kB
AnonPages: 1052336 kB
Mapped: 539856 kB
Shmem: 17404 kB
Slab: 129160 kB
SReclaimable: 63676 kB
SUnreclaim: 65484 kB
KernelStack: 5376 kB
PageTables: 5084 kB
NFS_Unstable: 0 kB
Bounce: 0 kB
WritebackTmp: 0 kB
CommitLimit: 4084984 kB
Committed_AS: 3034756 kB
VmallocTotal: 34359738367 kB
VmallocUsed: 0 kB
VmallocChunk: 0 kB
Percpu: 2320 kB
HardwareCorrupted: 0 kB
AnonHugePages: 587776 kB
ShmemHugePages: 0 kB
ShmemPmdMapped: 0 kB
HugePages_Total: 0
HugePages_Free: 0
HugePages_Rsvd: 0
HugePages_Surp: 0
Hugepagesize: 2048 kB
Hugetlb: 0 kB
DirectMap4k: 165824 kB
DirectMap2M: 5076992 kB
DirectMap1G: 5242880 kCPU info:
processor : 0
vendor_id : GenuineIntel
cpu family : 6
model : 63
model name : Intel(R) Xeon(R) CPU E5-2690 v3 @ 2.60GHz
stepping : 2
microcode : 0x43
cpu MHz : 2596.992
cache size : 30720 KB
physical id : 0
siblings : 1
core id : 0
cpu cores : 1
apicid : 0
initial apicid : 0
fpu : yes
fpu_exception : yes
cpuid level : 13
wp : yes
flags : fpu vme de pse tsc msr pae mce cx8 apic sep mtrr pge mca cmov pat pse36 clflush dts mmx fxsr sse sse2 ss syscall nx pdpe1gb rdtscp lm constant_tsc arch_perfmon pebs bts nopl xtopology tsc_reliable nonstop_tsc cpuid pni pclmulqdq ssse3 fma cx16 pcid sse4_1 sse4_2 x2apic movbe popcnt tsc_deadline_timer aes xsave avx f16c rdrand hypervisor lahf_lm abm cpuid_fault invpcid_single pti ibrs ibpb stibp fsgsbase tsc_adjust bmi1 avx2 smep bmi2 invpcid xsaveopt arat arch_capabilities
bugs : cpu_meltdown spectre_v1 spectre_v2 spec_store_bypass l1tf mds swapgs itlb_multihit
bogomips : 5193.98
clflush size : 64
cache_alignment : 64
address sizes : 43 bits physical, 48 bits virtual
power management:
processor : 1
vendor_id : GenuineIntel
cpu family : 6
model : 63
model name : Intel(R) Xeon(R) CPU E5-2690 v3 @ 2.60GHz
stepping : 2
microcode : 0x43
cpu MHz : 2596.992
cache size : 30720 KB
physical id : 2
siblings : 1
core id : 0
cpu cores : 1
apicid : 2
initial apicid : 2
fpu : yes
fpu_exception : yes
cpuid level : 13
wp : yes
flags : fpu vme de pse tsc msr pae mce cx8 apic sep mtrr pge mca cmov pat pse36 clflush dts mmx fxsr sse sse2 ss syscall nx pdpe1gb rdtscp lm constant_tsc arch_perfmon pebs bts nopl xtopology tsc_reliable nonstop_tsc cpuid pni pclmulqdq ssse3 fma cx16 pcid sse4_1 sse4_2 x2apic movbe popcnt tsc_deadline_timer aes xsave avx f16c rdrand hypervisor lahf_lm abm cpuid_fault invpcid_single pti ibrs ibpb stibp fsgsbase tsc_adjust bmi1 avx2 smep bmi2 invpcid xsaveopt arat arch_capabilities
bugs : cpu_meltdown spectre_v1 spectre_v2 spec_store_bypass l1tf mds swapgs itlb_multihit
bogomips : 5193.98
clflush size : 64
cache_alignment : 64
address sizes : 43 bits physical, 48 bits virtual
power management:
processor : 2
vendor_id : GenuineIntel
cpu family : 6
model : 63
model name : Intel(R) Xeon(R) CPU E5-2690 v3 @ 2.60GHz
stepping : 2
microcode : 0x43
cpu MHz : 2596.992
cache size : 30720 KB
physical id : 4
siblings : 1
core id : 0
cpu cores : 1
apicid : 4
initial apicid : 4
fpu : yes
fpu_exception : yes
cpuid level : 13
wp : yes
flags : fpu vme de pse tsc msr pae mce cx8 apic sep mtrr pge mca cmov pat pse36 clflush dts mmx fxsr sse sse2 ss syscall nx pdpe1gb rdtscp lm constant_tsc arch_perfmon pebs bts nopl xtopology tsc_reliable nonstop_tsc cpuid pni pclmulqdq ssse3 fma cx16 pcid sse4_1 sse4_2 x2apic movbe popcnt tsc_deadline_timer aes xsave avx f16c rdrand hypervisor lahf_lm abm cpuid_fault invpcid_single pti ibrs ibpb stibp fsgsbase tsc_adjust bmi1 avx2 smep bmi2 invpcid xsaveopt arat arch_capabilities
bugs : cpu_meltdown spectre_v1 spectre_v2 spec_store_bypass l1tf mds swapgs itlb_multihit
bogomips : 5193.98
clflush size : 64
cache_alignment : 64
address sizes : 43 bits physical, 48 bits virtual
power management:
processor : 3
vendor_id : GenuineIntel
cpu family : 6
model : 63
model name : Intel(R) Xeon(R) CPU E5-2690 v3 @ 2.60GHz
stepping : 2
microcode : 0x43
cpu MHz : 2596.992
cache size : 30720 KB
physical id : 6
siblings : 1
core id : 0
cpu cores : 1
apicid : 6
initial apicid : 6
fpu : yes
fpu_exception : yes
cpuid level : 13
wp : yes
flags : fpu vme de pse tsc msr pae mce cx8 apic sep mtrr pge mca cmov pat pse36 clflush dts mmx fxsr sse sse2 ss syscall nx pdpe1gb rdtscp lm constant_tsc arch_perfmon pebs bts nopl xtopology tsc_reliable nonstop_tsc cpuid pni pclmulqdq ssse3 fma cx16 pcid sse4_1 sse4_2 x2apic movbe popcnt tsc_deadline_timer aes xsave avx f16c rdrand hypervisor lahf_lm abm cpuid_fault invpcid_single pti ibrs ibpb stibp fsgsbase tsc_adjust bmi1 avx2 smep bmi2 invpcid xsaveopt arat arch_capabilities
bugs : cpu_meltdown spectre_v1 spectre_v2 spec_store_bypass l1tf mds swapgs itlb_multihit
bogomips : 5193.98
clflush size : 64
cache_alignment : 64
address sizes : 43 bits physical, 48 bits virtual
power management:
Disk Type ( SAN ):
*-ide
description: IDE interface
product: 82371AB/EB/MB PIIX4 IDE
vendor: Intel Corporation
physical id: 7.1
bus info: pci@0000:00:07.1
logical name: scsi1
version: 01
width: 32 bits
clock: 33MHz
capabilities: ide isa_compat_mode pci_native_mode bus_master emulated
configuration: driver=ata_piix latency=64
resources: irq:0 ioport:1f0(size=8) ioport:3f6 ioport:170(size=8) ioport:376 ioport:1060(size=16)
*-cdrom
description: DVD-RAM writer
product: VMware IDE CDR00
vendor: NECVMWar
physical id: 0.0.0
bus info: scsi@1:0.0.0
logical name: /dev/cdrom
logical name: /dev/cdrw
logical name: /dev/dvd
logical name: /dev/sr0
version: 1.00
capabilities: removable audio cd-r cd-rw dvd dvd-r dvd-ram
configuration: ansiversion=5 status=ready
*-medium
physical id: 0
logical name: /dev/cdrom
capabilities: partitioned partitioned:dos
configuration: signature=1f4ff68f
*-sas
description: Serial Attached SCSI controller
product: PVSCSI SCSI Controller
vendor: VMware
physical id: 0
bus info: pci@0000:03:00.0
logical name: scsi0
version: 02
width: 64 bits
clock: 33MHz
capabilities: sas pciexpress msi pm msix bus_master cap_list rom
configuration: driver=vmw_pvscsi latency=0
resources: irq:18 ioport:4000(size=8) memory:fd5f8000-fd5fffff memory:fd500000-fd50ffff
*-disk
description: SCSI Disk
product: Virtual disk
vendor: VMware
physical id: 0.0.0
bus info: scsi@0:0.0.0
logical name: /dev/sda
version: 2.0
size: 100GiB (107GB)
capabilities: 7200rpm partitioned partitioned:dos
configuration: ansiversion=6 logicalsectorsize=512 sectorsize=512 signature=2b50c538IOPS: 17.92
Using fio (
fio --rw=write --ioengine=sync --fdatasync=1 --directory=test-data --size=22m --bs=2300 --name=mytest):
mytest: (g=0): rw=write, bs=(R) 2300B-2300B, (W) 2300B-2300B, (T) 2300B-2300B, ioengine=sync, iodepth=1
fio-3.12
Starting 1 process
mytest: Laying out IO file (1 file / 22MiB)
Jobs: 1 (f=1): [W(1)][100.0%][w=89KiB/s][w=40 IOPS][eta 00m:00s]
mytest: (groupid=0, jobs=1): err= 0: pid=731: Mon Apr 26 14:20:01 2021
write: IOPS=26, BW=59.2KiB/s (60.6kB/s)(21.0MiB/380428msec); 0 zone resets
clat (usec): min=9, max=627, avg=44.74, stdev=17.55
lat (usec): min=9, max=629, avg=45.98, stdev=17.78
clat percentiles (usec):
| 1.00th=[ 23], 5.00th=[ 26], 10.00th=[ 29], 20.00th=[ 33],
| 30.00th=[ 36], 40.00th=[ 39], 50.00th=[ 43], 60.00th=[ 46],
| 70.00th=[ 50], 80.00th=[ 57], 90.00th=[ 64], 95.00th=[ 73],
| 99.00th=[ 91], 99.50th=[ 104], 99.90th=[ 139], 99.95th=[ 210],
| 99.99th=[ 553]
bw ( KiB/s): min= 4, max= 157, per=99.19%, avg=58.52, stdev=24.14, samples=760
iops : min= 2, max= 70, avg=26.27, stdev=10.75, samples=760
lat (usec) : 10=0.01%, 20=0.28%, 50=69.94%, 100=29.16%, 250=0.59%
lat (usec) : 500=0.01%, 750=0.02%
fsync/fdatasync/sync_file_range:
sync (usec): min=335, max=685022, avg=37874.18, stdev=38957.69
sync percentiles (usec):
| 1.00th=[ 469], 5.00th=[ 578], 10.00th=[ 734], 20.00th=[ 8225],
| 30.00th=[ 14091], 40.00th=[ 21890], 50.00th=[ 28967], 60.00th=[ 36963],
| 70.00th=[ 46400], 80.00th=[ 59507], 90.00th=[ 80217], 95.00th=[108528],
| 99.00th=[183501], 99.50th=[210764], 99.90th=[304088], 99.95th=[358613],
| 99.99th=[509608]
cpu : usr=0.12%, sys=0.90%, ctx=15717, majf=0, minf=12
IO depths : 1=200.0%, 2=0.0%, 4=0.0%, 8=0.0%, 16=0.0%, 32=0.0%, >=64=0.0%
submit : 0=0.0%, 4=100.0%, 8=0.0%, 16=0.0%, 32=0.0%, 64=0.0%, >=64=0.0%
complete : 0=0.0%, 4=100.0%, 8=0.0%, 16=0.0%, 32=0.0%, 64=0.0%, >=64=0.0%
issued rwts: total=0,10029,0,0 short=10029,0,0,0 dropped=0,0,0,0
latency : target=0, window=0, percentile=100.00%, depth=1
Run status group 0 (all jobs):
WRITE: bw=59.2KiB/s (60.6kB/s), 59.2KiB/s-59.2KiB/s (60.6kB/s-60.6kB/s), io=21.0MiB (23.1MB), run=380428-380428msec
Disk stats (read/write):
sda: ios=0/27697, merge=0/12919, ticks=0/654356, in_queue=598268, util=92.83%
Skipper0707
on 26 Apr 2021
Yeah this doesn't look sufficient, what storage is attached to the VMware cluster which is used for the machine disks?
superseb
on 26 Apr 2021
Thick Provision Lazy Zeroed

Skipper0707
on 26 Apr 2021
It's more about the type of disks, in this case SAS. Based on the fio output, the disks are not sufficient and there is not really a bug here. It seems etcd is just slow causing the cluster not to be ready with the default timeout. Raising this timeout can help or put the machine on a hypervisor with SSD disk which will have better access time/IOPS. Let me know if there is anything else you want to know.
superseb
on 26 Apr 2021
Thank you @superseb for your guidance.
Skipper0707
on 27 Apr 2021
Related issues
 freeloop914
·
16Comments
freeloop914
·
16Comments
 bootc
·
18Comments
bootc
·
18Comments
 pasikarkkainen
·
16Comments
pasikarkkainen
·
16Comments
 myselfghost
·
17Comments
myselfghost
·
17Comments
 kschamplin
·
17Comments
kschamplin
·
17Comments