RKE version: 0.1.9
Docker version: (docker version,docker info preferred)
17.3.2
Operating system and kernel: (cat /etc/os-release, uname -r preferred)
Ubuntu 16.04
Type/provider of hosts: (VirtualBox/Bare-metal/AWS/GCE/DO) bare-metal
cluster.yml file:
Steps to Reproduce:
- Updated cluster using rke 0.1.9 with
kubernetes_version: "v1.10.5-rancher1-2"
and it installed the new metrics-server (heapster was already removed)
Results:
I'm getting an error when trying to query kubectl top node/pod:
Error from server (ServiceUnavailable): the server is currently unable to handle the request (get pods.metrics.k8s.io)
The logs of the metrics-server print the following lines:
E0819 14:01:22.951266 1 authentication.go:64] Unable to authenticate the request due to an error: [x509: certificate signed by unknown authority (possibly because of "crypto/rsa: verification error" while trying to verify candidate authority certificate "kube-apiserver-requestheader-ca"), x509: certificate signed by unknown authority]
 hameno
All 13 comments
@hameno i am not able to reproduce when upgrading from v0.1.8 to v0.1.9, here are my steps:
- rke up (version v0.1.8) with the cluster.yml
nodes:
  - address: x.x.x.x
    user: ubuntu
    role: [etcd,controlplane,worker]
  - address: y.y.y.y
    user: ubuntu
    role: [etcd,controlplane,worker]
  - address: z.z.z.z
    user: ubuntu
    role: [etcd,controlplane,worker]

kubernetes_version: "v1.10.5-rancher1-2"
- use rke up with v0.1.9
i can see metrics server being created:
kubectl get pods --all-namespaces -o wide
NAMESPACE       NAME                                      READY     STATUS      RESTARTS   AGE       IP               NODE
kube-system     metrics-server-57bccd98fd-r24dt           1/1       Running     0          1h        10.42.2.2        18.130.227.62
and can query kubectl top node/pods normally:
kubectl top nodes
NAME             CPU(cores)   CPU%      MEMORY(bytes)   MEMORY%
18.130.225.126   86m          4%        1629Mi          42%
18.130.227.62    106m         5%        1841Mi          47%
35.176.147.198   113m         5%        1675Mi          43%

kubectl top pods --all-namespaces
NAMESPACE       NAME                                    CPU(cores)   MEMORY(bytes)
ingress-nginx   default-http-backend-564b9b6c5b-597ck   0m           3Mi
ingress-nginx   nginx-ingress-controller-826z5          2m           62Mi
ingress-nginx   nginx-ingress-controller-jvp95          2m           63Mi
ingress-nginx   nginx-ingress-controller-xbzmn          2m           62Mi
kube-system     canal-s6xs6                             13m          44Mi
kube-system     canal-t222g                             12m          39Mi
kube-system     canal-vwc9h                             14m          44Mi
kube-system     kube-dns-5ccb66df65-8pbb9               0m           22Mi
kube-system     kube-dns-autoscaler-6c4b786f5-g4n8q     0m           6Mi
kube-system     metrics-server-57bccd98fd-r24dt         0m           12Mi
can you describe in details what are your steps, to try and reproduce the problem
 galal-hussein
on 28 Aug 2018
galal-hussein
on 28 Aug 2018
i don't know how to reproduce, it happened with our production cluster but not with our development cluster. do you have any idea on how we could fix this?
hameno
on 28 Aug 2018
@hameno the error indicate that the metrics server is not able to authenticate because ca injected within pod doesn't match the right one used in the cluster, can you try to delete the pod and see if it will revert to a right state, also it might help to describe the deployment object of the metrics server as well as the following commands:
docker inspect kube-apiserver
docker logs kube-apiserver
@hameno closing the issue as i can't reproduce it and the metrics server seems to authenticate correctly with the kubeapi, please reopen if you still having the problem.
galal-hussein
on 4 Sep 2018
The error was due to a bug in rke where it doesn't fetch the requestheader and proxy certificates, so it reacreated those certificates each time the user adds a node, to reproduce the problem:
1- start rke up with 1 node with all roles
2- add second and third node with all roles as well
you should see the following logs in metrics server:
E0910 18:12:53.370389 1 authentication.go:64] Unable to authenticate the request due to an error: [x509: certificate signed by unknown authority (possibly because of "crypto/rsa: verification error" while trying to verify candidate authority certificate "kube-apiserver-requestheader-ca"), x509: certificate signed by unknown authority]
I added a fix to include these certs in the fetch certificates and should work fine with fresh installs, however to upgrade from a broken setup, follow the following steps:
1- delete the requestheader and proxy certs on each node:
sudo rm -f /etc/kubernetes/ssl/kube-apiserver-proxy-client* /etc/kubernetes/ssl/kube-apiserver-requestheader*
2- update rke to the latest which contain the fix
3- run rke up
4- restart kube-apiserver and controller manager on each node
sudo docker restart kube-apiserver kube-controller-manager
5- restart the metrics server pod
kubectl delete pod -l k8s-app=metrics-server -n kube-system
@galal-hussein What will be the process if my servers were created by rancher? Will I have to wait for the next rancher version?
 mitchellmaler
on 12 Sep 2018
mitchellmaler
on 12 Sep 2018
@mitchellmaler yes the next version should have an updated version of rke, however there is a manual workaround also, basically you can replicate the same steps mentioned in the comment https://github.com/rancher/rke/issues/866#issuecomment-420019920 however instead of step 1, 2, and 3 you can:
1,2- check the saved certificates for kubeapi requestheader and kubeapi proxy client in kubernetes secrets, you should find them using the following command:
kubectl get secret/kube-apiserver-requestheader-ca -n kube-system -o yaml
kubectl get secret/kube-apiserver-proxy-client -n kube-system -o yaml
3- decode the cert/key pair for each secret and replace them on all nodes
you should after that continue with the steps and metrics server should work normally.
galal-hussein
on 12 Sep 2018
Tested with rke version v0.1.9
1- start rke up with 1 node with all roles
2- add second and third node with all roles as well
Reproduced the error
ation error" while trying to verify candidate authority certificate "kube-apiserver-requestheader-ca"), x509: certificate signed by unknown authority]
E1001 19:54:54.967221       1 authentication.go:64] Unable to authenticate the request due to an error: [x509: certificate signed by unknown authority (possibly because of "crypto/rsa: verification error" while trying to verify candidate authority certificate "kube-apiserver-requestheader-ca"), x509: certificate signed by unknown authority]
E1001 19:55:25.104122       1 authentication.go:64] Unable to authenticate the request due to an error: [x509: certificate signed by unknown authority (possibly because of "crypto/rsa: verification error" while trying to verify candidate authority certificate "kube-apiserver-requestheader-ca"), x509: certificate signed by unknown authority]
E1001 19:55:55.282060       1 authentication.go:64] Unable to authenticate the request due to an error: [x509: certificate signed by unknown authority (possibly because of "crypto/rsa: verification error" while trying to verify candidate authority certificate "kube-apiserver-requestheader-ca"), x509: certificate signed by unknown authority]
Then tested with latest rke version v0.1.10-rc4. The above certificate error was not seen
root@soumyarkemetricstest-01:~# sudo docker ps -a|grep metrics
cbe8bcd27f32        rancher/metrics-server-amd64@sha256:220c0ed3451cb95e4b2f72dd5dc8d9d39d9f529722e5b29d8286373ce27b117e                      "/metrics-server --so"   10 minutes ago      Up 10 minutes                                     k8s_metrics-server_metrics-server-97bc649d5-g2stw_kube-system_6c03faae-c5be-11e8-97d0-de0cc69f218e_0
8af9f8403ee4        rancher/pause-amd64:3.1                                                                                                   "/pause"                 10 minutes ago      Up 10 minutes                                     k8s_POD_metrics-server-97bc649d5-g2stw_kube-system_6c03faae-c5be-11e8-97d0-de0cc69f218e_0
b91a1b3ddcbb        rancher/pause-amd64:3.1                                                                                                   "/pause"                 10 minutes ago      Exited (137) 10 minutes ago                       k8s_POD_rke-metrics-addon-deploy-job-sgzdh_kube-system_6abfd57b-c5be-11e8-97d0-de0cc69f218e_1
329bd97aff6a        de024031f5b2                                                                                                              "kubectl apply -f /et"   10 minutes ago      Exited (0) 10 minutes ago                         k8s_rke-metrics-addon-pod_rke-metrics-addon-deploy-job-sgzdh_kube-system_6abfd57b-c5be-11e8-97d0-de0cc69f218e_0
2e8d072fe808        rancher/pause-amd64:3.1                                                                                                   "/pause"                 10 minutes ago      Exited (0) 10 minutes ago                         k8s_POD_rke-metrics-addon-deploy-job-sgzdh_kube-system_6abfd57b-c5be-11e8-97d0-de0cc69f218e_0
root@soumyarkemetricstest-01:~# sudo docker logs -f cbe8bcd27f32
I1001 21:10:38.558539       1 heapster.go:71] /metrics-server --source=kubernetes.summary_api:https://kubernetes.default.svc?kubeletHttps=true&kubeletPort=10250&useServiceAccount=true&insecure=true
I1001 21:10:38.558841       1 heapster.go:72] Metrics Server version v0.2.1
I1001 21:10:38.559259       1 configs.go:61] Using Kubernetes client with master "https://kubernetes.default.svc" and version
I1001 21:10:38.559328       1 configs.go:62] Using kubelet port 10250
I1001 21:10:38.559923       1 heapster.go:128] Starting with Metric Sink
I1001 21:10:38.805375       1 serving.go:308] Generated self-signed cert (apiserver.local.config/certificates/apiserver.crt, apiserver.local.config/certificates/apiserver.key)
I1001 21:10:39.544323       1 heapster.go:101] Starting Heapster API server...
[restful] 2018/10/01 21:10:39 log.go:33: [restful/swagger] listing is available at https:///swaggerapi
[restful] 2018/10/01 21:10:39 log.go:33: [restful/swagger] https:///swaggerui/ is mapped to folder /swagger-ui/
I1001 21:10:39.622941       1 serve.go:85] Serving securely on 0.0.0.0:443
E1001 21:11:08.560492       1 reflector.go:205] github.com/kubernetes-incubator/metrics-server/metrics/util/util.go:52: Failed to list *v1.Node: Get https://kubernetes.default.svc/api/v1/nodes?resourceVersion=0: dial tcp: i/o timeout
E1001 21:11:08.561035       1 reflector.go:205] github.com/kubernetes-incubator/metrics-server/metrics/util/util.go:52: Failed to list *v1.Node: Get https://kubernetes.default.svc/api/v1/nodes?resourceVersion=0: dial tcp: lookup kubernetes.default.svc on 10.43.0.10:53: dial udp 10.43.0.10:53: i/o timeout
E1001 21:11:08.561130       1 reflector.go:205] github.com/kubernetes-incubator/metrics-server/metrics/processors/namespace_based_enricher.go:85: Failed to list *v1.Namespace: Get https://kubernetes.default.svc/api/v1/namespaces?resourceVersion=0: dial tcp: lookup kubernetes.default.svc on 10.43.0.10:53: dial udp 10.43.0.10:53: i/o timeout
E1001 21:11:08.561067       1 reflector.go:205] github.com/kubernetes-incubator/metrics-server/metrics/util/util.go:52: Failed to list *v1.Node: Get https://kubernetes.default.svc/api/v1/nodes?resourceVersion=0: dial tcp: lookup kubernetes.default.svc on 10.43.0.10:53: dial udp 10.43.0.10:53: i/o timeout
E1001 21:11:08.561164       1 reflector.go:205] github.com/kubernetes-incubator/metrics-server/metrics/heapster.go:254: Failed to list *v1.Pod: Get https://kubernetes.default.svc/api/v1/pods?resourceVersion=0: dial tcp: lookup kubernetes.default.svc on 10.43.0.10:53: dial udp 10.43.0.10:53: i/o timeout
W1001 21:16:23.022459       1 reflector.go:334] github.com/kubernetes-incubator/metrics-server/metrics/heapster.go:254: watch of *v1.Pod ended with: very short watch: github.com/kubernetes-incubator/metrics-server/metrics/heapster.go:254: Unexpected watch close - watch lasted less than a second and no items received
W1001 21:16:23.023073       1 reflector.go:334] github.com/kubernetes-incubator/metrics-server/metrics/util/util.go:52: watch of *v1.Node ended with: very short watch: github.com/kubernetes-incubator/metrics-server/metrics/util/util.go:52: Unexpected watch close - watch lasted less than a second and no items received
W1001 21:16:23.023199       1 reflector.go:334] github.com/kubernetes-incubator/metrics-server/metrics/util/util.go:52: watch of *v1.Node ended with: very short watch: github.com/kubernetes-incubator/metrics-server/metrics/util/util.go:52: Unexpected watch close - watch lasted less than a second and no items received
W1001 21:16:23.023756       1 reflector.go:334] github.com/kubernetes-incubator/metrics-server/metrics/util/util.go:52: watch of *v1.Node ended with: very short watch: github.com/kubernetes-incubator/metrics-server/metrics/util/util.go:52: Unexpected watch close - watch lasted less than a second and no items received
W1001 21:16:23.024002       1 reflector.go:334] github.com/kubernetes-incubator/metrics-server/metrics/processors/namespace_based_enricher.go:85: watch of *v1.Namespace ended with: very short watch: github.com/kubernetes-incubator/metrics-server/metrics/processors/namespace_based_enricher.go:85: Unexpected watch close - watch lasted less than a second and no items received
E1001 21:16:34.026190       1 reflector.go:205] github.com/kubernetes-incubator/metrics-server/metrics/util/util.go:52: Failed to list *v1.Node: Get https://kubernetes.default.svc/api/v1/nodes?resourceVersion=0: net/http: TLS handshake timeout
E1001 21:16:34.026285       1 reflector.go:205] github.com/kubernetes-incubator/metrics-server/metrics/heapster.go:254: Failed to list *v1.Pod: Get https://kubernetes.default.svc/api/v1/pods?resourceVersion=0: net/http: TLS handshake timeout
E1001 21:16:34.026364       1 reflector.go:205] github.com/kubernetes-incubator/metrics-server/metrics/processors/namespace_based_enricher.go:85: Failed to list *v1.Namespace: Get https://kubernetes.default.svc/api/v1/namespaces?resourceVersion=0: net/http: TLS handshake timeout
E1001 21:16:34.026350       1 reflector.go:205] github.com/kubernetes-incubator/metrics-server/metrics/util/util.go:52: Failed to list *v1.Node: Get https://kubernetes.default.svc/api/v1/nodes?resourceVersion=0: net/http: TLS handshake timeout
E1001 21:16:34.029615       1 reflector.go:205] github.com/kubernetes-incubator/metrics-server/metrics/util/util.go:52: Failed to list *v1.Node: Get https://kubernetes.default.svc/api/v1/nodes?resourceVersion=0: net/http: TLS handshake timeout
E1001 21:17:05.000461       1 summary.go:374] Node 142.93.197.230 is not ready
^C
root@soumyarkemetricstest-01:~# sudo docker logs -f cbe8bcd27f32
I1001 21:10:38.558539       1 heapster.go:71] /metrics-server --source=kubernetes.summary_api:https://kubernetes.default.svc?kubeletHttps=true&kubeletPort=10250&useServiceAccount=true&insecure=true
I1001 21:10:38.558841       1 heapster.go:72] Metrics Server version v0.2.1
I1001 21:10:38.559259       1 configs.go:61] Using Kubernetes client with master "https://kubernetes.default.svc" and version
I1001 21:10:38.559328       1 configs.go:62] Using kubelet port 10250
I1001 21:10:38.559923       1 heapster.go:128] Starting with Metric Sink
I1001 21:10:38.805375       1 serving.go:308] Generated self-signed cert (apiserver.local.config/certificates/apiserver.crt, apiserver.local.config/certificates/apiserver.key)
I1001 21:10:39.544323       1 heapster.go:101] Starting Heapster API server...
[restful] 2018/10/01 21:10:39 log.go:33: [restful/swagger] listing is available at https:///swaggerapi
[restful] 2018/10/01 21:10:39 log.go:33: [restful/swagger] https:///swaggerui/ is mapped to folder /swagger-ui/
I1001 21:10:39.622941       1 serve.go:85] Serving securely on 0.0.0.0:443
E1001 21:11:08.560492       1 reflector.go:205] github.com/kubernetes-incubator/metrics-server/metrics/util/util.go:52: Failed to list *v1.Node: Get https://kubernetes.default.svc/api/v1/nodes?resourceVersion=0: dial tcp: i/o timeout
E1001 21:11:08.561035       1 reflector.go:205] github.com/kubernetes-incubator/metrics-server/metrics/util/util.go:52: Failed to list *v1.Node: Get https://kubernetes.default.svc/api/v1/nodes?resourceVersion=0: dial tcp: lookup kubernetes.default.svc on 10.43.0.10:53: dial udp 10.43.0.10:53: i/o timeout
E1001 21:11:08.561130       1 reflector.go:205] github.com/kubernetes-incubator/metrics-server/metrics/processors/namespace_based_enricher.go:85: Failed to list *v1.Namespace: Get https://kubernetes.default.svc/api/v1/namespaces?resourceVersion=0: dial tcp: lookup kubernetes.default.svc on 10.43.0.10:53: dial udp 10.43.0.10:53: i/o timeout
E1001 21:11:08.561067       1 reflector.go:205] github.com/kubernetes-incubator/metrics-server/metrics/util/util.go:52: Failed to list *v1.Node: Get https://kubernetes.default.svc/api/v1/nodes?resourceVersion=0: dial tcp: lookup kubernetes.default.svc on 10.43.0.10:53: dial udp 10.43.0.10:53: i/o timeout
E1001 21:11:08.561164       1 reflector.go:205] github.com/kubernetes-incubator/metrics-server/metrics/heapster.go:254: Failed to list *v1.Pod: Get https://kubernetes.default.svc/api/v1/pods?resourceVersion=0: dial tcp: lookup kubernetes.default.svc on 10.43.0.10:53: dial udp 10.43.0.10:53: i/o timeout
W1001 21:16:23.022459       1 reflector.go:334] github.com/kubernetes-incubator/metrics-server/metrics/heapster.go:254: watch of *v1.Pod ended with: very short watch: github.com/kubernetes-incubator/metrics-server/metrics/heapster.go:254: Unexpected watch close - watch lasted less than a second and no items received
W1001 21:16:23.023073       1 reflector.go:334] github.com/kubernetes-incubator/metrics-server/metrics/util/util.go:52: watch of *v1.Node ended with: very short watch: github.com/kubernetes-incubator/metrics-server/metrics/util/util.go:52: Unexpected watch close - watch lasted less than a second and no items received
W1001 21:16:23.023199       1 reflector.go:334] github.com/kubernetes-incubator/metrics-server/metrics/util/util.go:52: watch of *v1.Node ended with: very short watch: github.com/kubernetes-incubator/metrics-server/metrics/util/util.go:52: Unexpected watch close - watch lasted less than a second and no items received
W1001 21:16:23.023756       1 reflector.go:334] github.com/kubernetes-incubator/metrics-server/metrics/util/util.go:52: watch of *v1.Node ended with: very short watch: github.com/kubernetes-incubator/metrics-server/metrics/util/util.go:52: Unexpected watch close - watch lasted less than a second and no items received
W1001 21:16:23.024002       1 reflector.go:334] github.com/kubernetes-incubator/metrics-server/metrics/processors/namespace_based_enricher.go:85: watch of *v1.Namespace ended with: very short watch: github.com/kubernetes-incubator/metrics-server/metrics/processors/namespace_based_enricher.go:85: Unexpected watch close - watch lasted less than a second and no items received
E1001 21:16:34.026190       1 reflector.go:205] github.com/kubernetes-incubator/metrics-server/metrics/util/util.go:52: Failed to list *v1.Node: Get https://kubernetes.default.svc/api/v1/nodes?resourceVersion=0: net/http: TLS handshake timeout
E1001 21:16:34.026285       1 reflector.go:205] github.com/kubernetes-incubator/metrics-server/metrics/heapster.go:254: Failed to list *v1.Pod: Get
Cluster was functional. Creation of pods was successful
 soumyalj
on 1 Oct 2018
soumyalj
on 1 Oct 2018
Im experiencing this on all my clusters created by rancher, I see a couple methods to fix, but I don't want to experiment, is there an official way to fix this?
 gregkeys
on 25 Oct 2018
gregkeys
on 25 Oct 2018
@galal-hussein I'm at a point of having to rebuild 20 nodes to fix this error and would like to avoid that if possible. Can you clarify the steps to correct this problem.
How do I decode and replace cert/key pair on each node, can I do this with kubectl, or do I need to ssh into each node.
gregkeys
on 18 Nov 2018
Either this issue still exists today, or I'm doing something terribly wrong.
os: Ubuntu 16.04.5 LTS
rke: v0.1.16
docker: 17.03.3-ce
kubernetes: v1.11.6
provider: VirtualBox via Vagrant
Vagrantfile
Vagrant.configure("2") do |config|
  config.ssh.insert_key = false
  config.ssh.private_key_path = ["~/.vagrant.d/insecure_private_key", "~/.ssh/id_rsa"]
  config.vm.provision :file, source: "~/.ssh/id_rsa.pub", destination: "~/.ssh/authorized_keys"

  config.vm.define "node-0" do |c|
    c.vm.box = "ubuntu/xenial64"
    c.vm.network :private_network, ip: "192.168.50.10"
    c.vm.provider :virtualbox do |vb|
      vb.cpus = 2
      vb.memory = "4096"
      vb.customize ["modifyvm", :id, "--uartmode1", "disconnected"]
    end
  end
  config.vm.define "node-1" do |c|
    c.vm.box = "ubuntu/xenial64"
    c.vm.network :private_network, ip: "192.168.50.11"
    c.vm.provider :virtualbox do |vb|
      vb.cpus = 2
      vb.memory = "4096"
      vb.customize ["modifyvm", :id, "--uartmode1", "disconnected"]
    end
  end
end
RKE cluster.yml
ssh_key_path: <homdir>/.ssh/id_rsa
ignore_docker_version: false

nodes:
  - address: 192.168.50.10
    user: vagrant
    port: 22
    role: [controlplane,worker,etcd]
  - address: 192.168.50.11
    user: vagrant
    port: 22
    role: [controlplane,worker,etcd]

services:
  etcd:
    snapshot: true
    creation: 6h
    retention: 24h
Result:
The 2-node cluster comes up provision and, shortly thereafter, the API intermittently stops responding. Inside the VMs, I noticed that kube-apiserver continually causes CPU spikes.

After checking the logs for both instances I noticed that the metrics-server is most likely causing this issue:
For reference: this show logs of both kube-apiserver containers where the top pane is the VM trying to contact to metric-server running on the other node (bottom pane)
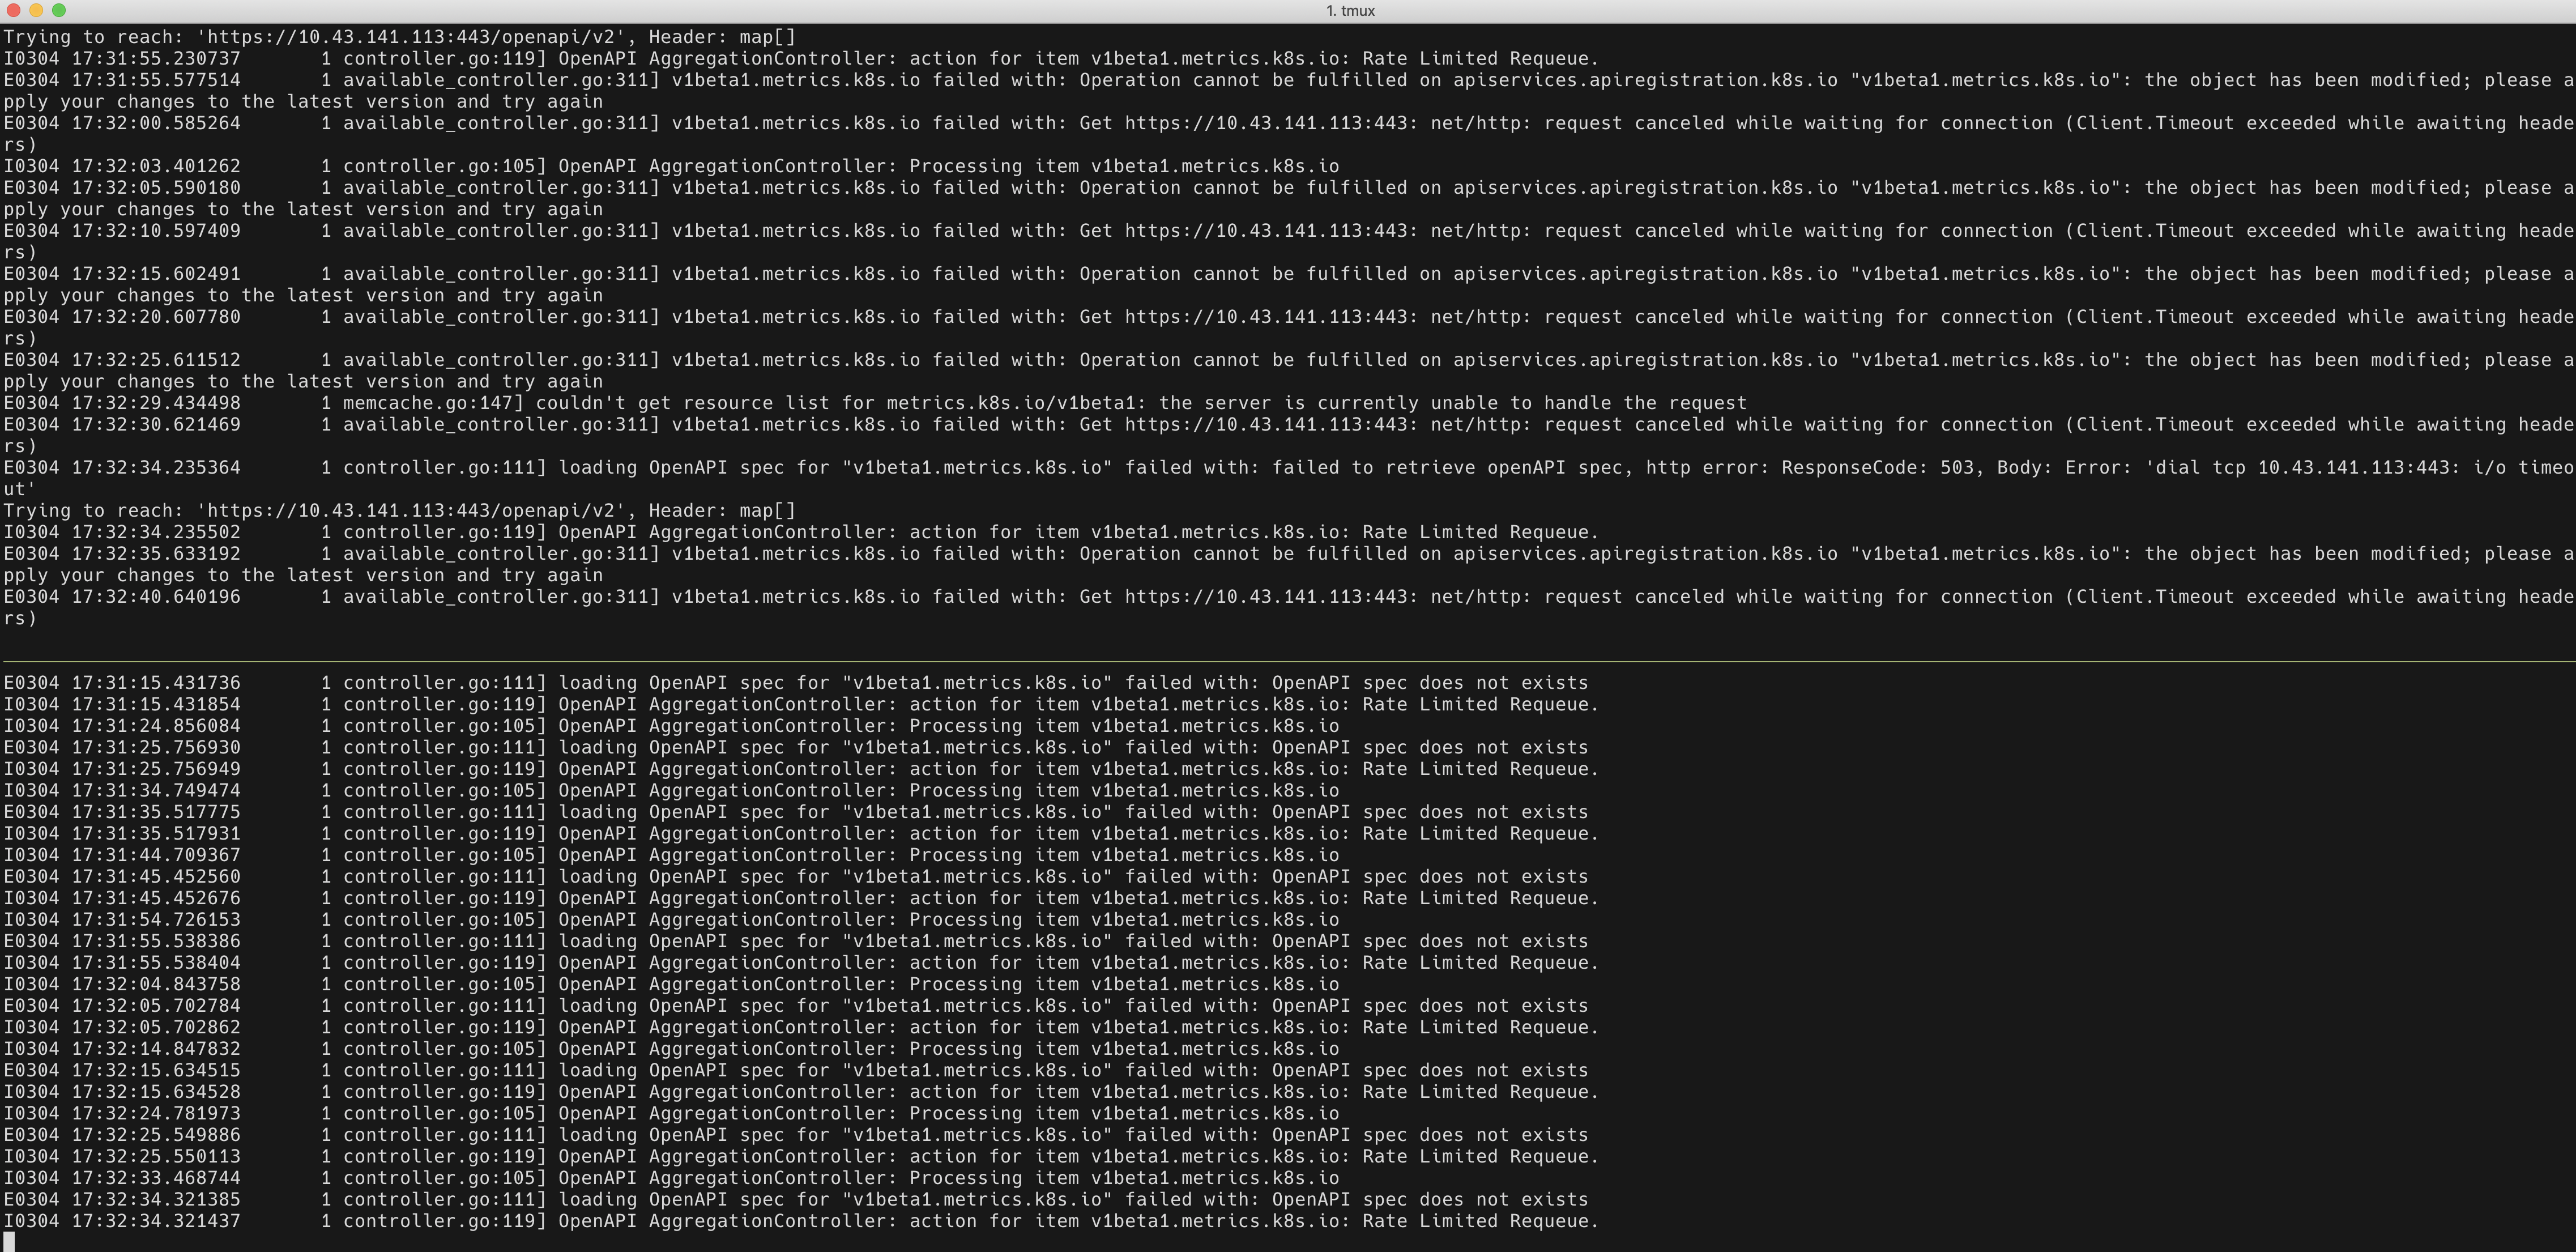
I'm basically trying to the follow the Rancher HA installation instructions using RKE, but this just does not work.
 sonnysideup
on 4 Mar 2019
sonnysideup
on 4 Mar 2019
Hi,
We have the same issue following the quickstart manual install
We use 4 nodes, 3 of them as as an etcd/control plane/worker, and the last one as a worker.
The kube-apiserver containers seem to have random cpu spikes on all three nodes where they are launched.
The logs in kube-apiserver are mostly the same as @sonnysideup .
On the node where the metricserver is up, we have this :

On the other two nodes, something like this :

The metrics container does not show any logs since we added the nodes.
We do not have any application launched.
 mboudet
on 22 Mar 2019
mboudet
on 22 Mar 2019
This issue is regarding certificate issues, not load related issues. The issue you are seeing is tracked in https://github.com/rancher/rancher/issues/17248
 superseb
on 22 Mar 2019
superseb
on 22 Mar 2019
Related issues
 niko-lay
·
14Comments
niko-lay
·
14Comments
 kschamplin
·
17Comments
kschamplin
·
17Comments
 bootc
·
18Comments
bootc
·
18Comments
 iljaweis
·
20Comments
iljaweis
·
20Comments
 myselfghost
·
17Comments
myselfghost
·
17Comments
Most helpful comment
The error was due to a bug in rke where it doesn't fetch the requestheader and proxy certificates, so it reacreated those certificates each time the user adds a node, to reproduce the problem:
1- start rke up with 1 node with all roles
2- add second and third node with all roles as well
you should see the following logs in metrics server:
I added a fix to include these certs in the fetch certificates and should work fine with fresh installs, however to upgrade from a broken setup, follow the following steps:
1- delete the requestheader and proxy certs on each node:
2- update rke to the latest which contain the fix
3- run rke up
4- restart kube-apiserver and controller manager on each node
5- restart the metrics server pod