Rh-che: Workspace Failure metrics reported by osd-monitor are incorrect
Status metrics already available for prod and prod-preview, but some of them in Grafana look really strange e.g. number of failed workspaces are a frictional value below 1. Raw data provided by Che server:
From pre-prod
che_workspace_failure_total{area="workspace",while="STARTING",} 196.0
che_workspace_failure_total{area="workspace",while="RUNNING",} 0.0
che_workspace_failure_total{area="workspace",while="STOPPING",} 0.0
From prod
che_workspace_failure_total{area="workspace",while="STARTING",} 939.0
che_workspace_failure_total{area="workspace",while="RUNNING",} 0.0
che_workspace_failure_total{area="workspace",while="STOPPING",} 54.0
The reason of wrong values or somewhere on the way between Che server and Grafana.
 ibuziuk
All 25 comments
cc: @fche
ibuziuk
on 29 Jan 2019
PCP recognizes metrics labeled "_total" as monotonic-counter semantic metrics. These are usually converted to rates (events per second) in downstream renderings. That way, you don't just see an upward sloping line, but get to see the deltas / pulses when those events occur.
 fche
on 29 Jan 2019
fche
on 29 Jan 2019
@fche In prometeus terminology they are counters not gauges. https://prometheus.io/docs/concepts/metric_types/
# HELP che_workspace_failure_total The count of failed workspaces
# TYPE che_workspace_failure_total counter
che_workspace_failure_total{area="workspace",while="STARTING",} 22.0
che_workspace_failure_total{area="workspace",while="RUNNING",} 111.0
che_workspace_failure_total{area="workspace",while="STOPPING",} 333.0
So what we should do? Rename this counters or fix PCP?
 skabashnyuk
on 29 Jan 2019
skabashnyuk
on 29 Jan 2019
If you'd like to see the counters in their raw, non-rate-converted form, we can create PCP "derived metrics" that read the counter as if were a gauge, and then the downstream consumers won't rate-convert it. Or you can rename the metrics so PCP doesn't infer the counter semantics, if you just want to see the gauge.
Are you expecting to see time series of these gauged-counters that just look like up-and-to-the-left diagonal lines?
fche
on 29 Jan 2019
BTW the numbers you are seeing ("[fictional] values below 1") are "average rates of the event in Hz".
fche
on 29 Jan 2019
If you'd like to see the counters in their raw, non-rate-converted form
yes.
we can create PCP "derived metrics" that read the counter as if were a gauge, and then the downstream consumers won't rate-convert it.
Not sure I understand why we need this conversation.
Or you can rename the metrics so PCP doesn't infer the counter semantics
It is quite problematic. Due to the loop between upstream and downstream. How difficult it to fix it in PCP
Are you expecting to see time series of these gauged-counters that just look like up-and-to-the-left diagonal lines?
Yes for counters. Not for gauges.
BTW the numbers you are seeing ("[fictional] values below 1") are "average rates of the event in Hz".
That has no practical sense for Che values. At least I can't imagine how can use it.
skabashnyuk
on 29 Jan 2019
Can you explain please what the event is that is being counted by this metric?
How would you use the upward diagonal line rendering of counter-as-gauge?
fche
on 29 Jan 2019
fche
on 29 Jan 2019
It seems as though these are genuine counts of failure events. So the question is whether PCP's rate-conversion (basically, showing you the first-derivative of the time series) is helpful or not, now that you know what it's doing. If it's not helpful, then yeah we need to configure it to pass through raw values.
If only redhat-developer/osd-monitor-poc#23 were already completed, it would be a matter of adding some function() notation text into the grafana metric expression, and you could self-serve. Since it's not done (and not sure when it will be; e.g. I believe there is zero interest in it from the PCP developers), we'd have to do the derived-metric stuff. Can you enumerate all the che counter type metrics that you'd like to see as if they were gauges?
fche
on 29 Jan 2019
this is a list of all counters that we have at this moment
/ $ curl -s localhost:8087 | grep counter
# TYPE tomcat_sessions_rejected_sessions_total counter
# TYPE jvm_classes_unloaded_classes_total counter
# TYPE che_server_api_response_total counter
# TYPE logback_events_total counter
# TYPE tomcat_global_sent_bytes_total counter
# TYPE che_workspace_failure_total counter
# TYPE tomcat_cache_hit_total counter
# TYPE tomcat_sessions_expired_sessions_total counter
# TYPE tomcat_global_error_total counter
# TYPE jvm_gc_memory_promoted_bytes_total counter
# TYPE tomcat_global_received_bytes_total counter
# TYPE tomcat_servlet_error_total counter
# TYPE tomcat_sessions_created_sessions_total counter
# TYPE jvm_gc_memory_allocated_bytes_total counter
# TYPE tomcat_cache_access_total counter
Can you enumerate all the che counter type metrics that you'd like to see as if they were gauges?
@fche well, we do want counter metrics being reported as counter not gauges. So, basically the current problem is that metrics with type counter are recognized for some reason as gauges, even though the type is explicitly defined (metric's name should not matter at all):
/ $ curl -s localhost:8087 | grep counter
# TYPE tomcat_sessions_rejected_sessions_total counter
# TYPE jvm_classes_unloaded_classes_total counter
# TYPE che_server_api_response_total counter
# TYPE logback_events_total counter
# TYPE tomcat_global_sent_bytes_total counter
# TYPE che_workspace_failure_total counter
# TYPE tomcat_cache_hit_total counter
# TYPE tomcat_sessions_expired_sessions_total counter
# TYPE tomcat_global_error_total counter
# TYPE jvm_gc_memory_promoted_bytes_total counter
# TYPE tomcat_global_received_bytes_total counter
# TYPE tomcat_servlet_error_total counter
# TYPE tomcat_sessions_created_sessions_total counter
# TYPE jvm_gc_memory_allocated_bytes_total counter
# TYPE tomcat_cache_access_total counter
will it be possible to fix on osd-monitor side ?
ibuziuk
on 30 Jan 2019
So, basically the current problem is that metrics with type counter are recognized for some reason as gauges,
No, that is not correct. PCP is correctly recognizing them as counters. And as usual for PCP counters, the default way of processing counters for user interface purposes is to present them as rates. The proposal on the table is to present the counters as though they were gauges: that is to show you the absolute counter value at any given time.
fche
on 30 Jan 2019
@fche I got a bit lost :-(
According to the prometeus metrics type [1] doc:
A counter is a cumulative metric that represents a single monotonically increasing counter whose value can only increase or be reset to zero on restart
why does PCP display them as rates (average rates of the event in Hz) ? This sounds nonsensical for me
ibuziuk
on 30 Jan 2019
count me as a lost too. ))
skabashnyuk
on 30 Jan 2019
I believe it's because it is common to care about the changes to the counters: the events that cause the counters to increase. That would be the delta (derivative) in the counter metric. For example, when you look at an /usr/bin/iostat report, the software is reading cumulative counters from the kernel, but it's showing you the deltas / rates, because that tells you the traffic just in the immediate past. Same with /usr/bin/top: it gets cumulative cpu-usage-millisecond ticks from the kernel, but prints you deltas (scaled to cpu utilization percentages in the immediate past).
So there's logic and precedent for it.
fche
on 30 Jan 2019
Can we evaluate delta (derivative) in grafana and keep raw data awailable too?
skabashnyuk
on 30 Jan 2019
The grafana datasource unconditionally does the rate-conversion on counters. The raw data is archived & available as pcp files. But we can also represent these counters as distinct gauge metrics ('instant' semantics in pcp lingo) using derived-metrics. Then both raw & rate-converted values can be accessed via grafana, under different names. Will give that a go and let you know.
fche
on 30 Jan 2019
https://github.com/redhat-developer/osd-monitor-poc/commit/24de7a08610b4edddac85e4f507d20d5ce2d310d
on its way to dsaas-stg
fche
on 30 Jan 2019
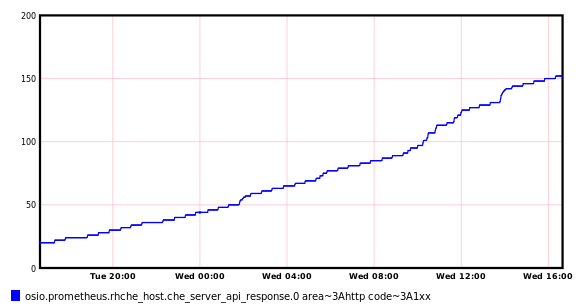
live on dsaas-stg. The gauged counters are named without the _total suffix.
fche
on 30 Jan 2019
They are gorgeous. Thanks, @fche .
skabashnyuk
on 30 Jan 2019
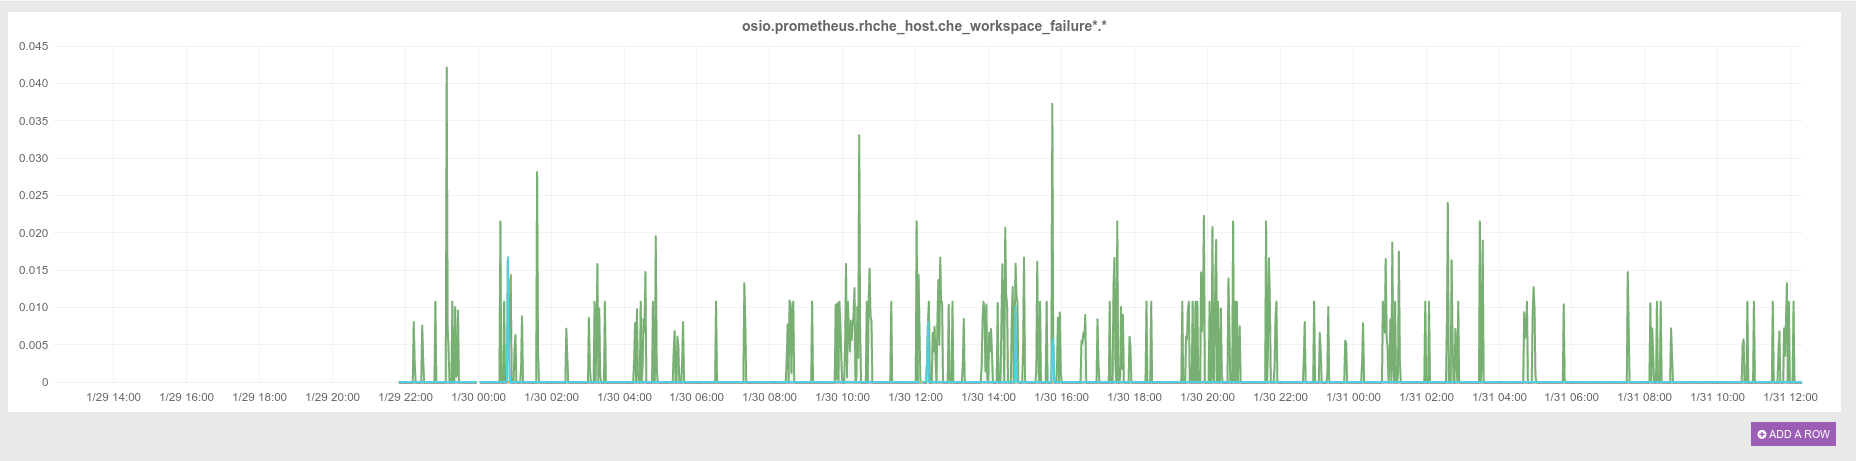
@fche could you please explain how could I see those raw graphs in graphana (currently it still shows me only rate-converted values):
ibuziuk
on 31 Jan 2019
Two issues, probably:
- You're using the wildcard component
che_workspace_failure*as the second-last name. That will match both newly gaugified counters as well as the_totalcounters. - More importantly, my guess is that you're executing this query against the
dsaas-prodrather thandsaas-stginstance of osd-monitor; the former does not have this code promoted yet. (Please include the complete URL next time.)
fche
on 31 Jan 2019
fche
on 31 Jan 2019
thanks for clarifications. Indeed, all metrics are rendered just fine against prod-preview:
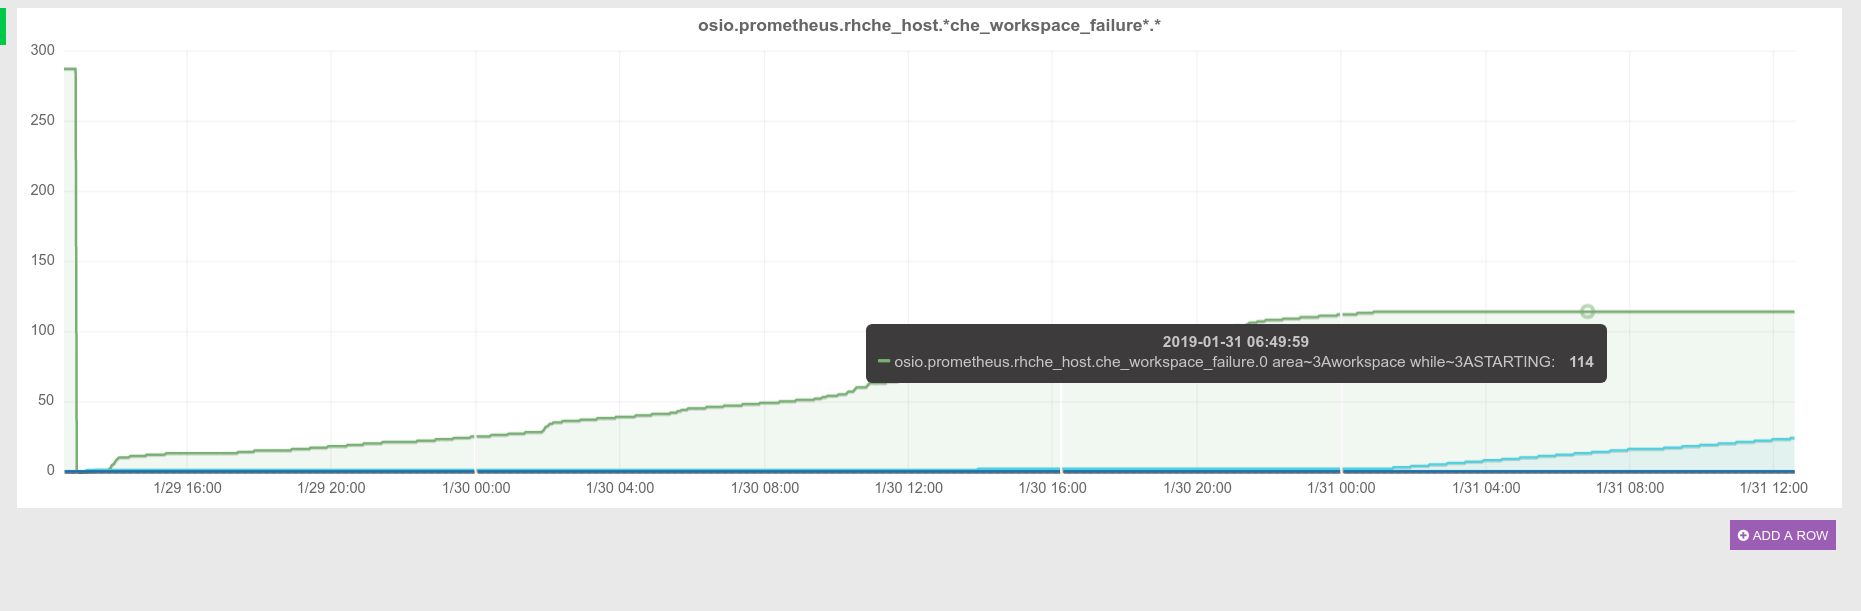
Going to close this issue once osd-monitor would be updated on prod
ibuziuk
on 31 Jan 2019
openshiftio/saas-openshiftio#1210 is merged and osd-monitor has been successfully updated on prod. New raw metrics are also available now on dsaas
thanks @fche !
ibuziuk
on 31 Jan 2019
Related issues
ibuziuk
·
8Comments
 l0rd
·
3Comments
l0rd
·
4Comments
l0rd
·
8Comments
ibuziuk
·
3Comments
l0rd
·
3Comments
l0rd
·
4Comments
l0rd
·
8Comments
ibuziuk
·
3Comments
Most helpful comment
live on dsaas-stg. The gauged counters are named without the
_totalsuffix.