Redux-devtools-extension: Dev tools tab is blank
Hi, first of all thank you for this great project!
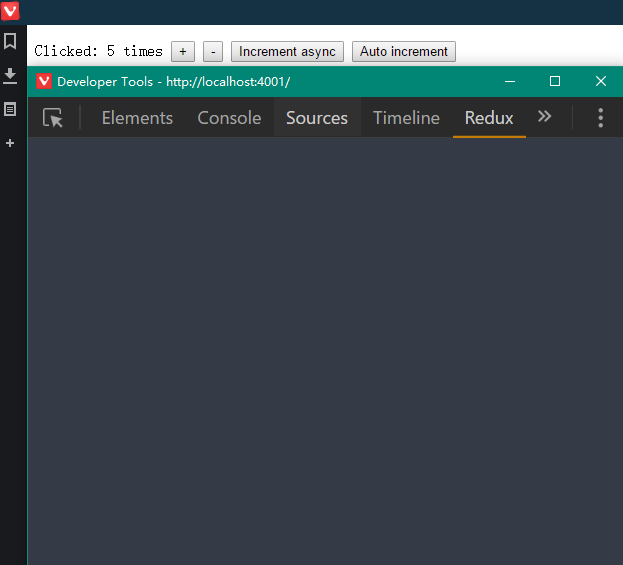
I’m using the extension since months and suddenly the Chrome dev tools tab stopped working. It’s starting (“No store found” message disappears) but then it’s just blank.
In contrast, clicking on the extension button works as expected. But I prefer to use the tab.

Any ideas or tips?
From my code (I’m using the standard approach, it used to work fine, haven’t changed it):
let enhancer = applyMiddleware(
  thunk, reduxRouterMiddleware
);
if (process.env.NODE_ENV === 'development') {
  const DevTools = require('../DevTools').default;
  enhancer = compose(
    enhancer,
    typeof window === 'object' && window.devToolsExtension ?
      window.devToolsExtension() :
      DevTools.instrument()
  );
}
const store = createStore(reducer, state, enhancer);
Anything obvious that I’m missing here?
Can I provide some information that helps?
Chrome 50.0.2661.102 (64-bit) on MacOS 10.11.5
Redux DevTools 1.3.1
Redux 3.3.1
Middlewares: react-router-redux 4.0.0, redux-thunk 2.0.1
Thank you very much for your time.
 molily
All 26 comments
Can you replicate this with our examples?
 zalmoxisus
on 19 May 2016
zalmoxisus
on 19 May 2016
Yes, unfortunately.

My assumption is that I have a broken Chrome user profile since the devtools tab works fine in my separate Chrome Canary installation. I’ll try to clean my user profile somehow. :/
molily
on 20 May 2016
Thanks for the details. No, it's not related to the user's profile. It should be just in exception in our script. Unfortunately, Chrome doesn't show errors for devtools panels. Reloading the extension or removing and installing it again should help. If you can replicate it again after that, steps of reproducing would be welcome.
zalmoxisus
on 20 May 2016
Thanks for your help! Already removed and reinstalled the extension, but it did not fix the problem. The tab is still empty.
But I created a second, fresh Chrome profile and the tab works fine there:

So I guess it’s something related to my main Chrome profile.
molily
on 20 May 2016
That's interesting. The settings are sticked to the Chrome profile. Could you please check what are the differences on the extension's option page (just click the last button from the bottom in the popup)?
zalmoxisus
on 20 May 2016
I can’t spot any differences in the extension preferences, both look the same:

molily
on 20 May 2016
I am also having this issue. Opening a panel left, right, bottom, or from clicking the toolbar icon work fine. The panel within Developer Tools itself is blank.
I tried restarting Chrome as well as re-installing.
 crw
on 21 May 2016
crw
on 21 May 2016
I've just published 1.3.2. It should be now an error there instead of being blank. Please let me know what error message is shown.
zalmoxisus
on 21 May 2016
I'm seeing similar behaviour. The LogMonitor is completely blank and no actions are recorded. Interestingly, when I don't use thunk in my app, everything is working fine.
I'm also seeing this error when I bring up the chrome console while the extension is focused:
extensions::uncaught_exception_handler:8 Error in event handler for (unknown): TypeError: Cannot read property 'toString' of undefined
    at LogMonitorAction.render (chrome-extension://lmhkpmbekcpmknklioeibfkpmmfibljd/js/window.bundle.js:38846:14)
    at ReactCompositeComponentMixin._renderValidatedComponentWithoutOwnerOrContext (chrome-extension://lmhkpmbekcpmknklioeibfkpmmfibljd/js/window.bundle.js:14594:35)
    at ReactCompositeComponentMixin._renderValidatedComponent (chrome-extension://lmhkpmbekcpmknklioeibfkpmmfibljd/js/window.bundle.js:14614:33)
    at ReactCompositeComponentMixin.performInitialMount (chrome-extension://lmhkpmbekcpmknklioeibfkpmmfibljd/js/window.bundle.js:14198:31)
    at ReactCompositeComponentMixin.mountComponent (chrome-extension://lmhkpmbekcpmknklioeibfkpmmfibljd/js/window.bundle.js:14129:22)
    at Object.ReactReconciler.mountComponent (chrome-extension://lmhkpmbekcpmknklioeibfkpmmfibljd/js/window.bundle.js:7454:36)
    at ReactDOMComponent.ReactMultiChild.Mixin.mountChildren (chrome-extension://lmhkpmbekcpmknklioeibfkpmmfibljd/js/window.bundle.js:13401:45)
    at ReactDOMComponent.Mixin._createInitialChildren (chrome-extension://lmhkpmbekcpmknklioeibfkpmmfibljd/js/window.bundle.js:10405:33)
    at ReactDOMComponent.Mixin.mountComponent (chrome-extension://lmhkpmbekcpmknklioeibfkpmmfibljd/js/window.bundle.js:10251:13)
    at Object.ReactReconciler.mountComponent (chrome-extension://lmhkpmbekcpmknklioeibfkpmmfibljd/js/window.bundle.js:7454:36)handler @ extensions::uncaught_exception_handler:8
I'm on chrome 50.0.2661.102 64 bit.
Using redux-thunk 2.1.0
Redux 3.5.2
Not sure if my problem is related, but hope it helps with this issue.
 derekmok
on 21 May 2016
derekmok
on 21 May 2016
@derekmok9201, that doesn't seem to be related to this issue, but mostly to #114. You're getting that error because are not specifying action's type parameter somewhere in your code (dispatching an empty object) and LogMonitor fails. There should be a more informative error in 1.3.2.
zalmoxisus
on 21 May 2016
@zalmoxisus Ahh my bad, you are absolutely right. Thanks for the help!
derekmok
on 22 May 2016
@zalmoxisus The error is:
SecurityError: Failed to read the 'localStorage' property from 'Window': Access is denied for this document.
Note that when there is no store configured, it correctly shows: No store found. Make sure to follow the instructions.
crw
on 23 May 2016
@crw, thanks for the details.
You should uncheck "Block third-party cookies and site data" in Content Settings, which block access ti localStorage as indicated here.

We use localStorage there to memorize the last selected monitor.
zalmoxisus
on 23 May 2016
“Block third-party cookies and site data”
Thanks! This was the cause of my problems as well.
If I understand your change 493a4cc correctly, it will be possible in the next version to block third party cookies while using the Redux dev tools tab. Correct?
molily
on 23 May 2016
Thanks, that fixed my issue. (edit: removed question about exceptions.)
crw
on 23 May 2016
@molily, thanks for confirming that it was the cause.
If I understand your change 493a4cc correctly, it will be possible in the next version to block third party cookies while using the Redux dev tools tab. Correct?
Exactly, and I just published it in 1.4, so it shouldn't break the extension anymore, but of course selected monitor will not be memorized.
Feel free to reopen the issue if there are still any troubles with that.
zalmoxisus
on 23 May 2016
@crw, you're welcome, thank you as well for helping with this issue.
Question, is there a way to add an exception (in Manage Exceptions) for extensions?
On chrome://extensions/ page check Developer mode, and then find the extension and click on background page link and you'll be able to inspect the extensions script (except what is in Chrome DevTools panel).
zalmoxisus
on 23 May 2016
I'm getting a similar issue in my setup... Every once in a while the DevTools tab works fine, but in most cases it just flicks for a brief second and then shows the "no store found" message. It works just fine from the toolbar button, for instance.
Just to be safe, I verified third-party site data: it's enabled as expected.
How could I help debug that?
Should I open a new issue instead, or you would reopen this one?
 igorsantos07
on 3 Dec 2016
igorsantos07
on 3 Dec 2016
@igorsantos07, according the current issue, the devpanel page was blank due to an exception. In your case the data is not sent to the extension. As it flicks, most likely the url is changed.
Could you please share an example to reproduce the problem (a github repo or jsfiddle snippet)?
zalmoxisus
on 3 Dec 2016
Hi, I got the same issues when use redux-devtools-extensions on vivlida browser or some nw.js wrapped app with --load-extensions argument.
All the panel works fine, but DevTools's tab still blank.
version: 2.13.0.2
Anything help, :)
 HairyRabbit
on 7 Feb 2017
HairyRabbit
on 7 Feb 2017
@yuffiy, great to see that at lest it works in panels there :)
I'll try later to install Vivaldi and see how it works.
About nw.js, could you please provide a simple repository I could run to reproduce the issue? I'm not familiar with it. How do include the extension there? I guess we could mock unsupported Chrome API there as we do for Electron.
zalmoxisus
on 7 Feb 2017
As expected, Vivaldi doesn't support full Chrome API, specifically chrome.devtools.inspectedWindow.tabId. I fixed that, and published in 2.13.2. Hope that will fix nw.js as well.
zalmoxisus
on 7 Feb 2017
❤️ @zalmoxisus
Great works! Devtools tab works fine with 2.13.2.
Thanks :)
HairyRabbit
on 8 Feb 2017
I'm getting the same issue as @igorsantos07. The extension shows for a half second, then disappears, showing the "No store found. Make sure to follow the instructions." message.
Here's a screen capture: http://i.imgur.com/D2n27UG.gifv
What's especially odd is that the tab works at first, showing the data and letting you click! But then it reverts or breaks or something and then says the store isn't set up.
Also, it used to work fine a few weeks ago. I don't know when it stopped working, unfortunately...
(Tech info: Windows 10, latest Chrome 61)
 Venryx
on 28 Jul 2017
Venryx
on 28 Jul 2017
Oh, when I right click inside the Redux dev-tools tab and press Inspect, it opens another dev-tools window showing the debug info for the extension. Going to the Console tab shows this error:
devpanel.html:1 Error in event handler for (unknown): TypeError: Cannot read property 'dispatch' of undefined
    at chrome-extension://lmhkpmbekcpmknklioeibfkpmmfibljd/js/devpanel.bundle.js:52:22466
EDIT: Oh, well I found a way that sometimes works to fix it. Right click in Redux panel, and press "Reload frame". About half the time, the panel then loads correctly; it can take a while, but it's better than reopening dev-tools each time.
Venryx
on 28 Jul 2017
@Venryx, right click and 'Reload frame' finally worked for me. It was loading indefinitely otherwise.
 lakesare
on 18 Mar 2019
lakesare
on 18 Mar 2019
Related issues
 MrSkinny
·
4Comments
MrSkinny
·
4Comments
 OddEssay
·
4Comments
OddEssay
·
4Comments
 sthiago
·
4Comments
sthiago
·
4Comments
 jhen0409
·
3Comments
jhen0409
·
3Comments
 born2net
·
4Comments
born2net
·
4Comments
Most helpful comment
I'm getting a similar issue in my setup... Every once in a while the DevTools tab works fine, but in most cases it just flicks for a brief second and then shows the "no store found" message. It works just fine from the toolbar button, for instance.
Just to be safe, I verified third-party site data: it's enabled as expected.
How could I help debug that?
Should I open a new issue instead, or you would reopen this one?