Redisgraph: Redis locks up at high load
Hi, it seems I have been making a lot of issues lately. :)
We have been running load tests on our application using RedisGraph and ran into some very strange issues. I am not really sure whether it has something to do with RedisGraph or is it a problem with Redis itself, however I kind of doubt it is the latter.
We run a performance load on our system that performs a lot of operations on RedisGraph. That seems to be doing just fine. However then we double up the load. Each of the load tests ends up performing operations on a separate graph inside redis. At that point it seems RedisGraph locks up. All the connections start timing out and eventually Redis fails its healthcheck and is killed. Redis itself meanwhile reports no issues.
We are running RedisGraph in K8s, using https://github.com/helm/charts/tree/master/stable/redis with a Redis image based off bitnami/redis with the redisgraph module added on top.
FROM bitnami/redis:6.0.8 AS builder

USER root

RUN apt update && apt-get install -y build-essential cmake m4 automake peg libtool autoconf
RUN apt-get -y install git

RUN git clone --recurse-submodules -j8 https://github.com/RedisGraph/RedisGraph.git

RUN cd RedisGraph && git checkout tags/v2.2.5 && make

FROM bitnami/redis:6.0.8

USER root
RUN apt update && apt-get install libgomp1
RUN mkdir -p /opt/redisgraph/
USER 1001

COPY --from=builder /RedisGraph/src/redisgraph.so /opt/redisgraph
The config is:
- 3 nodes with sentinels and replication (However the issue also happens when I run just one node)
- TLS connections (Again, the issue also happens in clear connections)
- Password enabled
- All persistence off
    appendonly no
    save ""
- Module loaded with
loadmodule /opt/redisgraph/redisgraph.so THREAD_COUNT 4 OMP_THREAD_COUNT 6 - Resources:
   resources:
      requests:
        cpu: 2
        memory: 3Gi
      limits:
        cpu: 2
        memory: 3Gi
Redis logs are pretty cryptic, it says nothing:
I am master
redis 16:35:29.09 INFO  ==> ** Starting Redis **
1:C 28 Sep 2020 16:35:29.105 # oO0OoO0OoO0Oo Redis is starting oO0OoO0OoO0Oo
1:C 28 Sep 2020 16:35:29.105 # Redis version=6.0.8, bits=64, commit=00000000, modified=0, pid=1, just started
1:C 28 Sep 2020 16:35:29.105 # Configuration loaded
1:M 28 Sep 2020 16:35:29.106 * Running mode=standalone, port=6379.
1:M 28 Sep 2020 16:35:29.107 # Server initialized
1:M 28 Sep 2020 16:35:29.107 # WARNING you have Transparent Huge Pages (THP) support enabled in your kernel. This will create latency and memory usage issues with Redis. To fix this issue run the command 'echo madvise > /sys/kernel/mm/transparent_hugepage/enabled' as root, and add it to your /etc/rc.local in order to retain the setting after a reboot. Redis must be restarted after THP is disabled (set to 'madvise' or 'never').
1:M 28 Sep 2020 16:35:29.113 * <graph> Graph deletion will be done asynchronously.
1:M 28 Sep 2020 16:35:29.114 * <graph> Thread pool created, using 4 threads.
1:M 28 Sep 2020 16:35:29.114 * <graph> Maximum number of OpenMP threads set to 6
1:M 28 Sep 2020 16:35:29.114 * Module 'graph' loaded from /opt/redisgraph/redisgraph.so
1:M 28 Sep 2020 16:35:29.114 * Ready to accept connections
1:M 28 Sep 2020 16:35:44.801 * Replica 192.168.85.155:6379 asks for synchronization
1:M 28 Sep 2020 16:35:44.801 * Full resync requested by replica 192.168.85.155:6379
1:M 28 Sep 2020 16:35:44.801 * Replication backlog created, my new replication IDs are '235807a26fefa2556a1fe8f0514decf292195c3c' and '0000000000000000000000000000000000000000'
1:M 28 Sep 2020 16:35:44.801 * Starting BGSAVE for SYNC with target: disk
1:M 28 Sep 2020 16:35:44.813 * Background saving started by pid 36
36:C 28 Sep 2020 16:35:44.825 * DB saved on disk
36:C 28 Sep 2020 16:35:44.826 * RDB: 2 MB of memory used by copy-on-write
1:M 28 Sep 2020 16:35:44.863 * Background saving terminated with success
1:M 28 Sep 2020 16:35:44.864 * Synchronization with replica 192.168.85.155:6379 succeeded
1:M 28 Sep 2020 16:36:02.566 * Replica 192.168.5.252:6379 asks for synchronization
1:M 28 Sep 2020 16:36:02.566 * Full resync requested by replica 192.168.5.252:6379
1:M 28 Sep 2020 16:36:02.566 * Starting BGSAVE for SYNC with target: disk
1:M 28 Sep 2020 16:36:02.567 * Background saving started by pid 59
59:C 28 Sep 2020 16:36:02.621 * DB saved on disk
59:C 28 Sep 2020 16:36:02.622 * RDB: 0 MB of memory used by copy-on-write
1:M 28 Sep 2020 16:36:02.712 * Background saving terminated with success
1:M 28 Sep 2020 16:36:02.713 * Synchronization with replica 192.168.5.252:6379 succeeded
582:signal-handler (1601311194) Received SIGUSR1 in child, exiting now.
651:signal-handler (1601311224) Received SIGUSR1 in child, exiting now.

1:signal-handler (1601311580) Received SIGTERM scheduling shutdown...
SIGTERM comes as soon as the healthcheck starts failing. I have no idea what is causing SIGUSR1 though.
The healthcheck is just:
#!/bin/bash
password_aux=`cat ${REDIS_PASSWORD_FILE}`
export REDIS_PASSWORD=$password_aux
no_auth_warning=$([[ "$(redis-cli --version)" =~ (redis-cli 5.*) ]] && echo --no-auth-warning)
response=$(
  timeout -s 3 $1 \
  redis-cli \
    -a $REDIS_PASSWORD $no_auth_warning \
    -h localhost \
    -p $REDIS_TLS_PORT \
    --tls \
    --cacert /opt/bitnami/redis/certs/root-ca \
      --cert /opt/bitnami/redis/certs/redis-crt \
      --key /opt/bitnami/redis/certs/redis-key \
    ping
)
if [ "$response" != "PONG" ] && [ "$response" != "LOADING Redis is loading the dataset in memory" ]; then
  echo "$response"
The problem exists on v2.2.5, I have also tried to just use the 2.2 branch with the same result.
I realise that this problem statement is pretty vague, but I don't really know how to debug it further and I'd really appreciate some help in what can I do to dig deeper and figure out what to do. Is #1314 possibly related to this? I think RedisGraph is amazing and it's a very solid piece of work and fits our application really well, but this problem is preventing us from using it to its full extent.
 haljin
All 18 comments
Hi @haljin,
We appreciate the issues you open, no worries!
The SIGUSR1 signal is an override from RediSearch, which runs its garbage collection in a forked process.
RedisGraph tries to hold the Redis global lock for as briefly as possible - queries execute in non-blocking threads, and the global lock is only held for the segment of the query where data is being rewritten, if any. As such, I think that a 3-second timeout in your healthcheck is sensible.
Still, the big question is whether RedisGraph is getting into a deadlock or is just blocking the server for too long, so modifying that timeout might give interesting data.
One possible cause for this problem might be that you're overriding the THREAD_COUNT default to 4, when it looks like your nodes each have 2 cores. THREAD_COUNT will default to your system's number of cores, which is optimal because each query gets dispatched to a different thread. If the thread pool is buffering more queries than it can actually handle, that might be the cause for the eventual timeout.
1314 refers exclusively to the case when one writer is working in a MULTI/EXEC or Lua context and another is not, so it shouldn't be a problem here.
Some questions to help us drill down:
- Do you find that with the doubled load, query latency increases over time?
- How many graph keys are on your server?
- What are the rough node and edge counts of the graphs?
- Do most of your queries utilize indexes?
- Are you also performing other Redis commands, or exclusively graph commands?
- Can you get metrics on CPU usage before the healthcheck fail? (If none of the threads are consuming a lot of cycles, we're almost surely deadlocked.)
 jeffreylovitz
on 28 Sep 2020
jeffreylovitz
on 28 Sep 2020
I have removed the healthcheck altogether (or rather replaced it with sh -c echo and the same thing happens. While Redis does not get SIGTERM from K8s, it does seem to be dropping connections and then locking up.
I was experimenting with the THREAD_COUNT and found it was behaving a bit better when it was expanded - however now I am not quite sure. I can run again with it set back to 2. Should OMP_THREAD_COUNT also be set to 2?
- I don't really get there, the doubled load causes everything to collapse. However there's something I forgot to mention. During our load test, our automatic functional tests kicked in. Those do barely any load (as they perform operations one by one), however each test case would cause RedisGraph to operate on a different graph. That would cause RedisGraph to die. Eventually, thanks to sentinels and replications the situation recovers. I have tried to hunt down whether it's a particular query that causes that to happen but it is not the case. Additionally, when the functional tests run without load nothing bad happens.
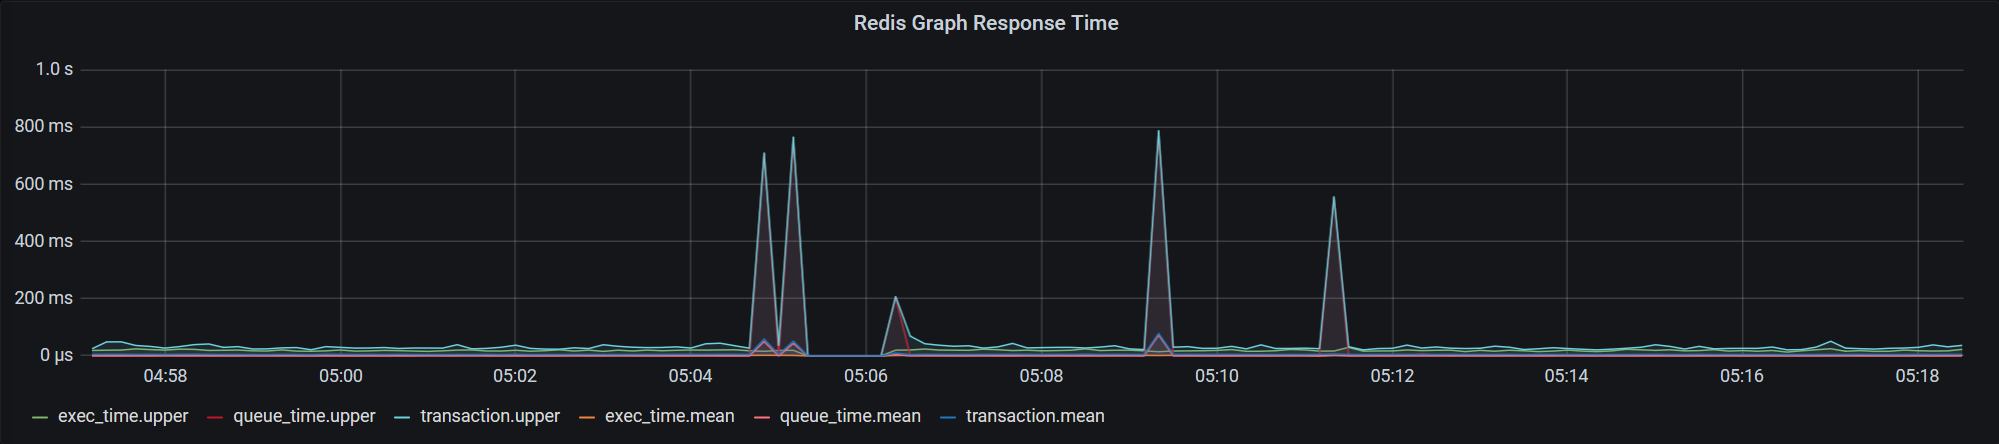
The spike at 5:05 am is the functional test kicking in. You can see how the time suddenly climbs up, then stops completely, a replica takes over at about 5:09, also dies, second replica takes over... and so on.
exec_time is the time reported by RedisGraph itself
transaction_time is total time from request to RedisGraph until a response - That one also puzzles me a bit, other than networking is there something RedisGraph does that is not included in exec_time that it reports?
queue_time is the time it took before getting a connection from the pool
- I have wiped the database completely, so that there's only the 1 graph being loaded and a new one is created when the second load starts.
- There's about 12k nodes and about 24k edges. The structure is more-or less (:type1)<-N:1[:rel1]-(:type2)-1:N[:rel2]->(:type3)
- Yes, all of them. All nodes types have the same
idproperty that is indexed. - Healthcheck executes
PING. My application doesKEYS *at startup to find out if any graphs need indexing, however that is not done during the load test. Nothing else
6.
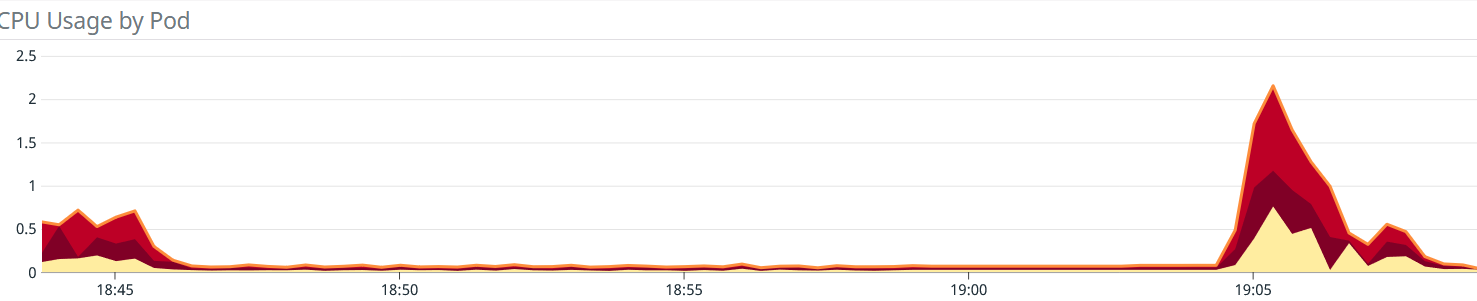
Redis seems to have plenty of CPU left to go.
haljin
on 28 Sep 2020
It seems that after I removed the healthcheck Redis now is forever stuck in the lock.
top - 18:32:42 up 5 days,  1:59,  0 users,  load average: 3.57, 4.52, 4.72
Tasks:   3 total,   1 running,   2 sleeping,   0 stopped,   0 zombie
%Cpu(s):  9.5 us,  4.6 sy,  0.0 ni, 85.1 id,  0.0 wa,  0.0 hi,  0.8 si,  0.0 st
MiB Mem :  64322.8 total,  38678.0 free,  17770.1 used,   7874.7 buff/cache
MiB Swap:      0.0 total,      0.0 free,      0.0 used.  46769.4 avail Mem

    PID USER      PR  NI    VIRT    RES    SHR S  %CPU  %MEM     TIME+ COMMAND
      1 1001      20   0  610536  53540  11620 S   0.0   0.1   1:22.37 redis-server
   8008 1001      20   0    4004   3356   2796 S   0.0   0.0   0:00.05 bash
   8879 1001      20   0    8020   3076   2596 R   0.0   0.0   0:00.00 top
I believe I can reliably get it to this state - is there anything I could run on the container (I can add utils like gdb or something if needed) to help figure out what is it doing? Mind, the container cannot run as root.
haljin
on 28 Sep 2020
Oh, that's great! (For debugging, at least.)
1) If you can attach gdb to the redis server process, we can check the state of each thread with info threads.
2) For any thread that seems to be awake, switch to it with thread [n]
3) Print the thread's trace with bt.
4) Print the query the thread was running with p QueryCtx_PrintQuery()
That should give us a lot of information to go on!
jeffreylovitz
on 28 Sep 2020
Oh, what a ride. I could not do it on our K8s as security policies prevent contaienrs from having SYS_PTRACE capability. I have however, successfully reproduced it on my local machine, with a very small subset of queries!
First of all, the Elixir code that reproduces it:
for system_id <- ["graph1", "graph2", "graph3", "graph4"] do
    :poolboy.transaction(:redis_pool, fn c -> Redix.command(c, ["GRAPH.QUERY", system_id, "CREATE INDEX ON :d(id)"]) end)
    :poolboy.transaction(:redis_pool, fn c -> Redix.command(c, ["GRAPH.QUERY", system_id, "CREATE INDEX ON :l(id)"]) end)
    :poolboy.transaction(:redis_pool, fn c -> Redix.command(c, ["GRAPH.QUERY", system_id, "CREATE INDEX ON :g(id)"]) end)
end

for system_id <- ["graph1", "graph2", "graph3", "graph4"] do
spawn(fn ->
for n <- 1..10000 do

    :poolboy.transaction(:redis_pool, fn c -> Redix.command(c, ["GRAPH.QUERY", system_id, "MERGE (node:d {id: 'someid#{n}'}) RETURN node"]) end)
    :poolboy.transaction(:redis_pool, fn c -> Redix.command(c, ["GRAPH.QUERY", system_id, "MATCH (src_node:d {id: 'someid#{n}'})
        OPTIONAL MATCH (src_node)-[rel:rel1]->(old_dst) DELETE rel
        MERGE (dst_node:l {id: 'place#{div(n, 100)}'})
        MERGE (src_node)-[:rel1]->(dst_node) SET src_node.prop = 'ABC'
        RETURN old_dst.id"]) end)

    :poolboy.transaction(:redis_pool, fn c -> Redix.command(c, ["GRAPH.QUERY", system_id, "MATCH (node:d {id: 'someid#{n}'})-[:rel1]->(l:l {id: 'place#{div(n, 100)}'})  OPTIONAL MATCH (node)-[:rep2]->(g) RETURN node, g.sys_id, g.id"]) end)
    :poolboy.transaction(:redis_pool, fn c -> Redix.command(c, ["GRAPH.QUERY", system_id,
        "MATCH (src_node:d {id: 'someid#{n}'})-[:rel1]->(l:l {id: 'place#{div(n, 100)}'})
         MERGE (dst_node0:g {id: 'otherid#{div(n,100)}'})
         MERGE (src_node)-[rel0:rep2]->(dst_node0)
         SET src_node.prop = 'ABC'
         WITH src_node, rel0
         OPTIONAL MATCH (src_node)-[stuff:rep2]->() WHERE stuff <> rel0 DELETE stuff"]) end)
end
end)
end
So in short, first create indices for the graphs, then spawn a bunch of parallel processes that run the 4 queries over and over. I ran the above spawn 3-4 times before it deadlocked, so operations were performed on the same nodes multiple times.
Now for the gdb:
(gdb) info threads
  Id   Target Id                                        Frame
* 1    Thread 0x7fb6d2ef0f80 (LWP 1) "redis-server"     __lll_lock_wait () at ../sysdeps/unix/sysv/linux/x86_64/lowlevellock.S:103
  2    Thread 0x7fb6d1d32700 (LWP 54) "thread-pool-0"   futex_wait_cancelable (private=0, expected=0, futex_word=0x5599ba304b50) at ../sysdeps/unix/sysv/linux/futex-internal.h:88
  3    Thread 0x7fb6d1531700 (LWP 55) "redis-server"    futex_abstimed_wait_cancelable (private=0, abstime=0x7fb6d152f690, expected=0, futex_word=0x7fb6d2a351c8) at ../sysdeps/unix/sysv/linux/futex-internal.h:205
  4    Thread 0x7fb6d0d30700 (LWP 56) "thread-pool-0"   futex_abstimed_wait (private=0, abstime=0x0, expected=2, futex_word=0x7fb6d25fdfa8 <RWLock+8>) at ../sysdeps/unix/sysv/linux/futex-internal.h:172
  5    Thread 0x7fb6d052f700 (LWP 57) "thread-pool-1"   __lll_lock_wait () at ../sysdeps/unix/sysv/linux/x86_64/lowlevellock.S:103
  6    Thread 0x7fb6cfd2e700 (LWP 58) "bio_close_file"  futex_wait_cancelable (private=0, expected=0, futex_word=0x5599b85a3da8) at ../sysdeps/unix/sysv/linux/futex-internal.h:88
  7    Thread 0x7fb6cf52d700 (LWP 59) "bio_aof_fsync"   futex_wait_cancelable (private=0, expected=0, futex_word=0x5599b85a3ddc) at ../sysdeps/unix/sysv/linux/futex-internal.h:88
  8    Thread 0x7fb6ced2c700 (LWP 60) "bio_lazy_free"   futex_wait_cancelable (private=0, expected=0, futex_word=0x5599b85a3e08) at ../sysdeps/unix/sysv/linux/futex-internal.h:88
  9    Thread 0x7fb6ce52b700 (LWP 61) "jemalloc_bg_thd" futex_wait_cancelable (private=0, expected=0, futex_word=0x7fb6d2c073b0) at ../sysdeps/unix/sysv/linux/futex-internal.h:88
  10   Thread 0x7fb6cd5ff700 (LWP 62) "jemalloc_bg_thd" futex_wait_cancelable (private=0, expected=0, futex_word=0x7fb6d2c0747c) at ../sysdeps/unix/sysv/linux/futex-internal.h:88
Clearly thread 1 and 5 seem to be stuck on the same __lll_lock_wait ?
(gdb) thread 1
[Switching to thread 1 (Thread 0x7fb6d2ef0f80 (LWP 1))]
#0  __lll_lock_wait () at ../sysdeps/unix/sysv/linux/x86_64/lowlevellock.S:103
103     in ../sysdeps/unix/sysv/linux/x86_64/lowlevellock.S
(gdb) bt
#0  __lll_lock_wait () at ../sysdeps/unix/sysv/linux/x86_64/lowlevellock.S:103
#1  0x00007fb6d30c0714 in __GI___pthread_mutex_lock (mutex=0x5599b85a8cc0) at ../nptl/pthread_mutex_lock.c:80
#2  0x00005599b840beb2 in aeProcessEvents ()
#3  0x00005599b840bf7d in aeMain ()
#4  0x00005599b8408770 in main ()
and
(gdb) thread 5
[Switching to thread 5 (Thread 0x7fb6d052f700 (LWP 57))]
#0  __lll_lock_wait () at ../sysdeps/unix/sysv/linux/x86_64/lowlevellock.S:103
103     ../sysdeps/unix/sysv/linux/x86_64/lowlevellock.S: No such file or directory.
(gdb) bt
#0  __lll_lock_wait () at ../sysdeps/unix/sysv/linux/x86_64/lowlevellock.S:103
#1  0x00007fb6d30c0714 in __GI___pthread_mutex_lock (mutex=0x5599b85a8cc0) at ../nptl/pthread_mutex_lock.c:80
#2  0x00007fb6d1ee4c63 in _QueryCtx_ThreadSafeContextLock (ctx=0x7fb6d2a8fc00, ctx=0x7fb6d2a8fc00) at /RedisGraph/src/query_ctx.c:160
#3  QueryCtx_LockForCommit () at /RedisGraph/src/query_ctx.c:175
#4  0x00007fb6d1f05bd4 in _DeleteEntities (op=op@entry=0x7fb6cc981380) at /RedisGraph/src/execution_plan/ops/op_delete.c:30
#5  0x00007fb6d1f05cae in DeleteFree (ctx=0x7fb6cc981380) at /RedisGraph/src/execution_plan/ops/op_delete.c:126
#6  0x00007fb6d1f010f4 in OpBase_PropagateFree (op=0x7fb6cc981380) at /RedisGraph/src/execution_plan/ops/op.c:87
#7  0x00007fb6d1efce45 in MergeConsume (opBase=0x7fb6bfd94ee0) at /RedisGraph/src/execution_plan/ops/op_merge.c:275
#8  MergeConsume (opBase=0x7fb6bfd94ee0) at /RedisGraph/src/execution_plan/ops/op_merge.c:208
#9  0x00007fb6d1efcd19 in _pullFromStream (branch=<optimized out>) at /RedisGraph/src/execution_plan/ops/op_merge.c:80
#10 MergeConsume (opBase=0x7fb6bfd96a00) at /RedisGraph/src/execution_plan/ops/op_merge.c:219
#11 MergeConsume (opBase=0x7fb6bfd96a00) at /RedisGraph/src/execution_plan/ops/op_merge.c:208
#12 0x00007fb6d1efe71a in UpdateConsume (opBase=0x7fb6cc820f40) at /RedisGraph/src/execution_plan/ops/op_update.c:308
#13 0x00007fb6d1f0563c in ProjectConsume (opBase=0x7fb6bfe975c0) at /RedisGraph/src/execution_plan/ops/op_project.c:46
#14 0x00007fb6d1f04dfc in ResultsConsume (opBase=0x7fb6cc886d60) at /RedisGraph/src/execution_plan/ops/op_results.c:35
#15 0x00007fb6d1efa288 in ExecutionPlan_Execute (plan=plan@entry=0x7fb6cc830f00) at /RedisGraph/src/execution_plan/execution_plan.c:1003
#16 0x00007fb6d1ef4650 in Graph_Query (args=0x7fb6cc3baed0) at /RedisGraph/src/commands/cmd_query.c:194
#17 0x00007fb6d1f2a42d in thread_do (thread_p=<optimized out>) at /RedisGraph/src/util/thpool/thpool.c:465
#18 0x00007fb6d30bdfa3 in start_thread (arg=<optimized out>) at pthread_create.c:486
#19 0x00007fb6d2fec4cf in clone () at ../sysdeps/unix/sysv/linux/x86_64/clone.S:95

(gdb) p QueryCtx_PrintQuery()
$2 = void
For completness:
(gdb) thread 2
[Switching to thread 2 (Thread 0x7fb6d1d32700 (LWP 54))]
#0  futex_wait_cancelable (private=0, expected=0, futex_word=0x5599ba304b50) at ../sysdeps/unix/sysv/linux/futex-internal.h:88
88      ../sysdeps/unix/sysv/linux/futex-internal.h: No such file or directory.
(gdb) bt
#0  futex_wait_cancelable (private=0, expected=0, futex_word=0x5599ba304b50) at ../sysdeps/unix/sysv/linux/futex-internal.h:88
#1  __pthread_cond_wait_common (abstime=0x0, mutex=0x5599ba304b00, cond=0x5599ba304b28) at pthread_cond_wait.c:502
#2  __pthread_cond_wait (cond=cond@entry=0x5599ba304b28, mutex=mutex@entry=0x5599ba304b00) at pthread_cond_wait.c:655
#3  0x00007fb6d1f2a37b in bsem_wait (bsem_p=0x5599ba304b00) at /RedisGraph/src/util/thpool/thpool.c:512
#4  thread_do (thread_p=<optimized out>) at /RedisGraph/src/util/thpool/thpool.c:342
#5  0x00007fb6d30bdfa3 in start_thread (arg=<optimized out>) at pthread_create.c:486
#6  0x00007fb6d2fec4cf in clone () at ../sysdeps/unix/sysv/linux/x86_64/clone.S:95
(gdb) p QueryCtx_PrintQuery()

Thread 2 "thread-pool-0" received signal SIGSEGV, Segmentation fault.
__strlen_avx2 () at ../sysdeps/x86_64/multiarch/strlen-avx2.S:65
65      ../sysdeps/x86_64/multiarch/strlen-avx2.S: No such file or directory.
The program being debugged was signaled while in a function called from GDB.
GDB remains in the frame where the signal was received.
To change this behavior use "set unwindonsignal on".
Evaluation of the expression containing the function
(QueryCtx_PrintQuery) will be abandoned.
When the function is done executing, GDB will silently stop.
(gdb) thread 4
[Switching to thread 4 (Thread 0x7fb6d0d30700 (LWP 56))]
#0  futex_abstimed_wait (private=0, abstime=0x0, expected=2, futex_word=0x7fb6d25fdfa8 <RWLock+8>) at ../sysdeps/unix/sysv/linux/futex-internal.h:172
172     ../sysdeps/unix/sysv/linux/futex-internal.h: No such file or directory.
(gdb) bt
#0  futex_abstimed_wait (private=0, abstime=0x0, expected=2, futex_word=0x7fb6d25fdfa8 <RWLock+8>) at ../sysdeps/unix/sysv/linux/futex-internal.h:172
#1  __pthread_rwlock_wrlock_full (abstime=0x0, rwlock=rwlock@entry=0x7fb6d25fdfa0 <RWLock>) at pthread_rwlock_common.c:803
#2  __GI___pthread_rwlock_wrlock (rwlock=rwlock@entry=0x7fb6d25fdfa0 <RWLock>) at pthread_rwlock_wrlock.c:27
#3  0x00007fb6d22c9224 in RediSearch_LockWrite () at /RedisGraph/deps/RediSearch/src/rwlock.c:61
#4  0x00007fb6d22c80b1 in RediSearch_IndexAddDocument (sp=sp@entry=0x7fb6cd622000, d=d@entry=0x7fb6cd70a380, options=options@entry=1, errs=errs@entry=0x0) at /RedisGraph/deps/RediSearch/src/redisearch_api.c:198
#5  0x00007fb6d1f18812 in Index_IndexNode (idx=0x7fb6cd6080c0, n=n@entry=0x7fb6cc1cbbe8) at /RedisGraph/src/index/index.c:142
#6  0x00007fb6d1f245f6 in Schema_AddNodeToIndices (s=s@entry=0x7fb6cd616020, n=n@entry=0x7fb6cc1cbbe8) at /RedisGraph/src/schema/schema.c:128
#7  0x00007fb6d1f0773f in _CommitNodes (pending=<optimized out>) at /RedisGraph/src/execution_plan/ops/shared/create_functions.c:65
#8  CommitNewEntities (op=0x7fb6cc0c4ba0, pending=<optimized out>) at /RedisGraph/src/execution_plan/ops/shared/create_functions.c:148
#9  0x00007fb6d1efc24e in MergeCreate_Commit (opBase=<optimized out>) at /RedisGraph/src/execution_plan/ops/op_merge_create.c:231
#10 0x00007fb6d1efcef4 in MergeConsume (opBase=0x7fb6cc1b21c0) at /RedisGraph/src/execution_plan/ops/op_merge.c:280
#11 MergeConsume (opBase=0x7fb6cc1b21c0) at /RedisGraph/src/execution_plan/ops/op_merge.c:208
#12 0x00007fb6d1f0563c in ProjectConsume (opBase=0x7fb6cd7c9f00) at /RedisGraph/src/execution_plan/ops/op_project.c:46
#13 0x00007fb6d1f04dfc in ResultsConsume (opBase=0x7fb6cc1302e0) at /RedisGraph/src/execution_plan/ops/op_results.c:35
#14 0x00007fb6d1efa288 in ExecutionPlan_Execute (plan=plan@entry=0x7fb6cd7a3740) at /RedisGraph/src/execution_plan/execution_plan.c:1003
#15 0x00007fb6d1ef4650 in Graph_Query (args=0x7fb6cc3baf40) at /RedisGraph/src/commands/cmd_query.c:194
#16 0x00007fb6d1f2a42d in thread_do (thread_p=<optimized out>) at /RedisGraph/src/util/thpool/thpool.c:465
#17 0x00007fb6d30bdfa3 in start_thread (arg=<optimized out>) at pthread_create.c:486
#18 0x00007fb6d2fec4cf in clone () at ../sysdeps/unix/sysv/linux/x86_64/clone.S:95
(gdb) p QueryCtx_PrintQuery()
$1 = void
I really hope it helps. I seem to be able to reproduce it quite handily, so let me know if you need something else!
Also - in the event this will take some time to fix - is there anything we can avoid doing in a query to prevent it?
haljin
on 28 Sep 2020
I may have answered my own question - trying to run the same queries in the same amount on a single graph does not cause issues. It seems it only happens when there's multiple graphs present.
haljin
on 28 Sep 2020
Thanks for digging into this, and sorry it turned out to be such a hassle!
I should be able to test your reproduction steps tomorrow and get an ETA on how long it will take to implement a fix.
If you're able to avoid running multiple graphs on the same server, that's definitely the best workaround for now!
jeffreylovitz
on 29 Sep 2020
I've been experimenting some more and it seems separating into:
    {:ok,_ } = :poolboy.transaction(:redis_pool, fn c -> Redix.command(c, ["GRAPH.QUERY", system_id, "MERGE (node:d {id: 'someid#{n}'}) RETURN node"]) end)
    {:ok, _} = :poolboy.transaction(:redis_pool, fn c -> Redix.command(c, ["GRAPH.QUERY", system_id, "MATCH (src_node:d {id: 'someid#{n}'})
        OPTIONAL MATCH (src_node)-[rel:rel1]->(old_dst) DELETE rel
        RETURN old_dst.id"]) end)

    {:ok, _} = :poolboy.transaction(:redis_pool, fn c -> Redix.command(c, ["GRAPH.QUERY", system_id, "MATCH (src_node:d {id: 'someid#{n}'})
        MERGE (dst_node:l {id: 'place#{div(n, 100)}'})
        MERGE (src_node)-[:rel1]->(dst_node) SET src_node.prop = 'ABC'"]) end)

    {:ok, _} = :poolboy.transaction(:redis_pool, fn c -> Redix.command(c, ["GRAPH.QUERY", system_id, "MATCH (node:d {id: 'someid#{n}'})-[:rel1]->(l:l {id: 'place#{div(n, 100)}'})  OPTIONAL MATCH (node)-[:rep2]->(g) RETURN node, g.sys_id, g.id"]) end)
    {:ok, _} = :poolboy.transaction(:redis_pool, fn c -> Redix.command(c, ["GRAPH.QUERY", system_id,
        "MATCH (src_node:d {id: 'someid#{n}'})-[:rel1]->(l:l {id: 'place#{div(n, 100)}'})
         OPTIONAL MATCH (src_node)-[stuff:rep2]->() DELETE stuff"]) end)

    {:ok, _} = :poolboy.transaction(:redis_pool, fn c -> Redix.command(c, ["GRAPH.QUERY", system_id,
        "MATCH (src_node:d {id: 'someid#{n}'})-[:rel1]->(l:l {id: 'place#{div(n, 100)}'})
         MERGE (dst_node0:g {id: 'otherid#{div(n,100)}'})
         MERGE (src_node)-[rel0:rep2]->(dst_node0)
         SET src_node.prop = 'ABC'"]) end)
Also prevents deadlocks - it seems doing both MERGE and DELETE in one query is the issue. The problem is we really need this atomicity in our operations.
haljin
on 29 Sep 2020
I have now reran our performance test with a single graph. It seems to be working, as in it is not deadlocking! However it seems there are still strange spikes.
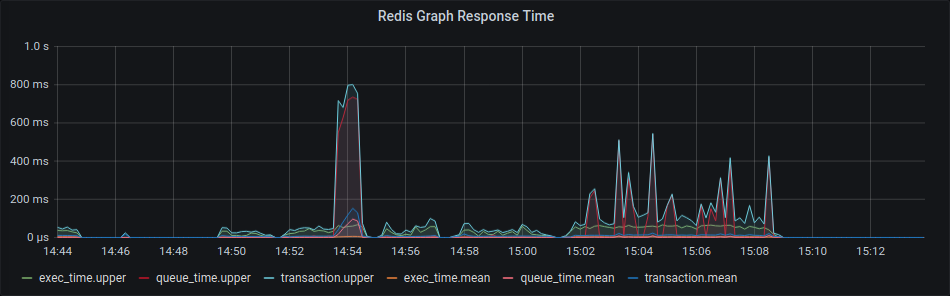
I have a sinking feeling they have something to do with #1353 and the synchronization, that occurs and maybe with multiple graphs is spread out more?
haljin
on 29 Sep 2020
@haljin in this case you might be able to use MULTI EXEC to guarantee atomicity.
MULTI
Query 1
Query 2
...
EXEC
 swilly22
on 29 Sep 2020
swilly22
on 29 Sep 2020
Well, turns out rewriting one of the queries as
MATCH (src_node:d {id: 'someid#{n}'})
            MERGE (dst_node:l {id: 'place#{div(n, 100)}'})
            MERGE (src_node)-[rel:rel1]->(dst_node) SET src_node.prop = 'ABC'
            WITH rel, src_node
            OPTIONAL MATCH (src_node)-[rel2:rel1]->(old_dst)
            WHERE rel <> rel2
            DELETE rel
            RETURN old_dst.id"
Fixes the issue - it seems deadlock only occurs if there's a MERGE following a DELETE. Since I rewrote the other query before, that was the only one. Now that that's changed we can run our performance tests on multiple graphs and see no deadlocks!
haljin
on 29 Sep 2020
Great! indeed a DELETE MERGE query will have this effect, we're currently working on a fix.
swilly22
on 29 Sep 2020
Hi, is there any news on this? The workaround has been working for us for a while but we have encountered a couple surprise redis deaths in K8s, which I suspect may be another deadlock., possibly even the same one as this occurring in a different query. Unfortunately it seems pretty tough to reproduce this time around :(
haljin
on 8 Feb 2021
@haljin can you please provide us with your queries and maybe a dataset, I would like to run it from our end and hopefully re-create the issue, thanks!
swilly22
on 8 Feb 2021
Are the examples above not enough or have they been fixed (and if so in which release, as we are on 2.2.9 right now)?
haljin
on 8 Feb 2021
The new lock up happens quite rarely, so it's a little hard for me to isolate what is happening - we do run quite a few different queries. I do however suspect a query that does DELETE and MERGE in a UNION as this was the problem before.
haljin
on 8 Feb 2021
@haljin would you mind sharing that DELETE,MERGE,UNION query?
swilly22
on 10 Feb 2021
Sure, here's the query in an anonymized version:
MATCH (:employee {id: $employee_id})-[:in_office]->(g:day_of_the_week)
MATCH (t:team {id: $team_id})<-[:belongs_to]-(e:employee)-[:in_office]->(g)
WITH t, g, count(e) as total_employees
MATCH (t:team)<-[:belongs_to]-(e:employee)-[:in_office]->(g)
WITH t, g, e, total_employees
OPTIONAL MATCH (e)-[:can_eat]->(v:food_type)
WITH g, t, v.name as v_name, count(e.id) as compatible_employees, total_employees
WITH g, t, [v_name, compatible_employees, total_employees] AS aux
WITH g, t, [tuple IN collect(aux) WHERE tuple[1] = tuple[2] | tuple[0]] as foods
MERGE (g)-[r:cache]->(t)
SET r.compatible_foods=foods
RETURN g.id, t.id
UNION
MATCH (:employee {id: $employee_id})-[:in_office]->(g:day_of_the_week)
MATCH (t:team {id: $team_id}), (g)
OPTIONAL MATCH (t)<-[:belongs_to]-(e:employee)-[:in_office]->(g)
WITH t, g, count(e) as total_employees
WHERE total_employees = 0
MATCH (g)-[r:cache]->(t)
DELETE r
RETURN g.id, t.id
Related issues
 p1nox
·
3Comments
p1nox
·
3Comments
 bingo-ctrl
·
4Comments
bingo-ctrl
·
4Comments
 abevoelker
·
5Comments
abevoelker
·
5Comments
 Sceat
·
7Comments
Sceat
·
7Comments
 WitchsCat
·
10Comments
WitchsCat
·
10Comments