Redisgraph: help me create scalable architecture for redis graph?
i have redis graph on my production it is running on kubernetes(1 Master and Two Salve). but i am unable to scale redisgraph read query.i am running 'or' query to fetching users friends.
but when i hitting and trying to benchmarking it, i am unable to scale it to 1000 req/sec,
recently it 4 req/sec. I am unable to find out the actual infra (cluster) where can i scale it or unable to find out setting where can i tune my redisgraph to scale 1000 req/sec.
 vvippark
All 27 comments
I'd be happy to help you. We should start by systematising the approach.
Q1. You should stay as close as possible to official helm chart . Are you using that chart? If no fork into your private repo
Q2. With as little changes as possible you should then replace simple redis with extended redis+redisgraph from official repo hosted in docker hub . Are we roughly on the same path? Once you get to this point, push back into forked repo
Q3. I'd like to see how you do the benchmark, can you push the test script in a benchmark or test folder into above repo?
Q4. Describe your test configuration, node sizes, are they dedicated or perhaps on the same nodes as ELK stack for example (lol) because that would make a difference and so on.
Once we have the set as described in Q1-Q2-Q3-Q4 we can begin discussion on the same level. Otherwise we cannot possibly relate to what the issue might be. I can then deploy this and we can compare the metrics.
I'm very curious to compare this with you, awaiting repo with helm chart and benchmark test.
 styk-tv
on 5 Apr 2019
styk-tv
on 5 Apr 2019
A1. We are referring redis-ha helm (https://hub.helm.sh/charts/ibm-charts/ibm-redis-ha-dev)
We have added redisgraph module here which is needed for our project, which is mentioned in your Q2.
A2. Yes we are using official redisgraph docker image
image: redislabs/redisgraph:1.0.12
A3. We are benchmarking our API server with h2load. Here webserver is gunicorn and api is managed by flask (python).
@app.route('/rg')
  def rg():
    try:
        import redis
        from redisgraph import Node, Edge, Graph
        s = Sentinel([('127.0.0.1', 6379)])
        redis_client = s.master_for("mymaster")
        redis_graph = Graph('social', redis_client)
        query = 'MATCH (s:user)-[r:friends]->(ru:user) WHERE (s.id="A" or s.id="B" or s.id="C" or s.id="D" )  AND  (ru.country="USA")  RETURN ru LIMIT 40'
        query_res = redis_graph.query(query)
        return "ok"
    except Exception as ex:
        print(ex)
        return "500"
A4.
Node size : 86000
Edge : 10000000
When we are running same query on redis cli, without load it works in 90ms
On concurrent load on 100, same query give result in 10secs
Its running on K8 environment and we have not limited any resources. Our Redis db size is round 500mb.
vvippark
on 5 Apr 2019
ok, replicating conditions... I will import some data from StackOverflow at archive.org to get to roughly that size.
styk-tv
on 6 Apr 2019
@styk-tv I recently wrote a script to help build graphs from Stack Exchange XML dumps that might help you prep this - here.
It only translates a few specific properties currently, but can easily be extended!
 jeffreylovitz
on 6 Apr 2019
jeffreylovitz
on 6 Apr 2019
@jeffreylovitz great, i was just about to do this by combining redis-graph-bulkloader and to_csv.py i will surely take a look. thanks.
@vvippark what is your master, slave, sentinel distribution on physical k8s nodes? aggregating multiples per node might be good for fooling around but for prod i would think of turning those into daemonsets and not to repeat on single node. review afinity rules.
your api flask code is it leaving in the same nodes as sentinels? might be good to launch those into the same pods so they don't have to communicate through services but localhost to sentinel, and then scale those with sentinel with extra flask api service aggregating entrypoints.
either way this is the path i'm taking so we can compare results at later stage. please publish the pods to nodes configuration for both redis graph and your api.
styk-tv
on 6 Apr 2019
I have used redis-ha chart from helm github repo. It seem to be in sync with version 5 of redis and already using StatefulSets.
Added dedicated redis spot instance group and added node selector to launch redis only on nodes from that instance group.

In afinity section added:
  nodeSelector:
    kops.k8s.io/instancegroup: redis
This results in a working setup like this:
>> kubectl get all -n redis
NAME                                          READY     STATUS    RESTARTS   AGE
pod/io-madstat-prod-redis-redis-ha-server-0   2/2       Running   0          4m
pod/io-madstat-prod-redis-redis-ha-server-1   2/2       Running   0          3m
pod/io-madstat-prod-redis-redis-ha-server-2   2/2       Running   0          2m

NAME                                                TYPE        CLUSTER-IP      EXTERNAL-IP   PORT(S)              AGE
service/io-madstat-prod-redis-redis-ha              ClusterIP   None            <none>        6379/TCP,26379/TCP   4m
service/io-madstat-prod-redis-redis-ha-announce-0   ClusterIP   100.66.12.33    <none>        6379/TCP,26379/TCP   4m
service/io-madstat-prod-redis-redis-ha-announce-1   ClusterIP   100.67.111.45   <none>        6379/TCP,26379/TCP   4m
service/io-madstat-prod-redis-redis-ha-announce-2   ClusterIP   100.64.67.88    <none>        6379/TCP,26379/TCP   4m

NAME                                                     DESIRED   CURRENT   AGE
statefulset.apps/io-madstat-prod-redis-redis-ha-server   3         3         4m
i will work on data now.
EDIT: just for clarity I am using kops, isolated instance group definition as follows (partial sepc)
  machineType: c4.large
  maxSize: 3
  minSize: 3
  maxPrice: "0.04"
  nodeLabels:
    kops.k8s.io/instancegroup: redis
  role: Node
  subnets:
  - us-east-1c
  rootVolumeSize: 15
  rootVolumeType: gp2
  rootVolumeIops: 100
  rootVolumeOptimization: True
This results in dedicated instances:
kubectl get pod -n redis -o wide
NAME                                      READY     STATUS    RESTARTS   AGE       IP           NODE
io-madstat-prod-redis-redis-ha-server-0   2/2       Running   0          2m        100.96.3.2   ip-172-12-100-38.ec2.internal
io-madstat-prod-redis-redis-ha-server-1   2/2       Running   0          2m        100.96.6.2   ip-172-12-100-200.ec2.internal
io-madstat-prod-redis-redis-ha-server-2   2/2       Running   0          1m        100.96.7.2   ip-172-12-100-23.ec2.internal
which can be verified by running (you can see node hostnames match)
kubectl get nodes --show-labels | grep redis
ip-172-12-100-200.ec2.internal   Ready     node      42m       v1.10.6   beta.kubernetes.io/arch=amd64,beta.kubernetes.io/instance-type=c4.large,beta.kubernetes.io/os=linux,failure-domain.beta.kubernetes.io/region=us-east-1,failure-domain.beta.kubernetes.io/zone=us-east-1c,kops.k8s.io/instancegroup=redis,kubernetes.io/hostname=ip-172-12-100-200.ec2.internal,kubernetes.io/role=node,node-role.kubernetes.io/node=
ip-172-12-100-23.ec2.internal    Ready     node      42m       v1.10.6   beta.kubernetes.io/arch=amd64,beta.kubernetes.io/instance-type=c4.large,beta.kubernetes.io/os=linux,failure-domain.beta.kubernetes.io/region=us-east-1,failure-domain.beta.kubernetes.io/zone=us-east-1c,kops.k8s.io/instancegroup=redis,kubernetes.io/hostname=ip-172-12-100-23.ec2.internal,kubernetes.io/role=node,node-role.kubernetes.io/node=
ip-172-12-100-38.ec2.internal    Ready     node      42m       v1.10.6   beta.kubernetes.io/arch=amd64,beta.kubernetes.io/instance-type=c4.large,beta.kubernetes.io/os=linux,failure-domain.beta.kubernetes.io/region=us-east-1,failure-domain.beta.kubernetes.io/zone=us-east-1c,kops.k8s.io/instancegroup=redis,kubernetes.io/hostname=ip-172-12-100-38.ec2.internal,kubernetes.io/role=node,node-role.kubernetes.io/node=
Chose to go with scifi.stackexchange.com.7z which extracted amounts to 1.1GB in xml files
-rw-r--r--   1 piotrek  staff   31115889  4 Mar 01:25 Badges.xml
-rw-r--r--   1 piotrek  staff  122703326  4 Mar 01:25 Comments.xml
-rw-r--r--   1 piotrek  staff  566278330  4 Mar 01:25 PostHistory.xml
-rw-r--r--   1 piotrek  staff    3262502  4 Mar 01:25 PostLinks.xml
-rw-r--r--   1 piotrek  staff  258609746  4 Mar 01:25 Posts.xml
-rw-r--r--   1 piotrek  staff     276370  4 Mar 01:25 Tags.xml
-rw-r--r--   1 piotrek  staff   31149281  4 Mar 01:25 Users.xml
-rw-r--r--   1 piotrek  staff  170359689  4 Mar 01:25 Votes.xml
took about 60 seconds to convert into csv and now the data is 54M (20 fold drop) @jeffreylovitz what sort of sorcery is this :) I'm assuming we're mostly interested in relationships for the graph and discarding quite a bit? I see we've dropped few files.
-rw-r--r--   1 piotrek  staff    422038  7 Apr 09:34 ANSWER_TO.csv
-rw-r--r--   1 piotrek  staff    702963  7 Apr 09:34 AUTHOR_OF.csv
-rw-r--r--   1 piotrek  staff  34755747  7 Apr 09:34 Answer.csv
-rw-r--r--   1 piotrek  staff    906746  7 Apr 09:34 HAS_TAG.csv
-rw-r--r--   1 piotrek  staff  15096117  7 Apr 09:34 Question.csv
-rw-r--r--   1 piotrek  staff     23861  7 Apr 09:34 Tag.csv
-rw-r--r--   1 piotrek  staff   2133612  7 Apr 09:34 User.csv
I've set a port-forward from my local workstation, it will most likely be sloooow, if it fails we will think of other ways to do this. Maybe from sidecart. Trying
kubectl port-forward service/io-madstat-prod-redis-redis-ha 6379:6379 -n redis
and then following bulk_insert recommendation attempting same 7 files from example
python3 bulk_insert.py bulk -s -q -n csv_files/User.csv -n csv_files/Question.csv -n csv_files/Tag.csv -n csv_files/Answer.csv -r csv_files/ANSWER_TO.csv -r csv_files/AUTHOR_OF.csv -r csv_files/HAS_TAG.csv
will ping back when this is in
styk-tv
on 7 Apr 2019
So interestingly redis-ha chart is rewriting docker start command and nicely forgetting to load the redisgraph module, however it exposes ability to just add commands to the config from yaml, hence:
redis:
  port: 6379
  masterGroupName: mymaster
  config:
    ## load redisgraph module as redis-ha chart overwrites Dockerfile CMD command
    loadmodule:  /usr/lib/redis/modules/redisgraph.so
results in:
io-madstat-prod-redis-redis-ha-server-0 redis 1:S 07 Apr 2019 10:03:38.201 * <graph> Thread pool created, using 2 threads.
io-madstat-prod-redis-redis-ha-server-0 redis 1:S 07 Apr 2019 10:03:38.201 * Module 'graph' loaded from /usr/lib/redis/modules/redisgraph.so
and now the import completed:
User  [####################################]  100%
83812 nodes created with label 'User'
Question  [####################################]  100%
18507 nodes created with label 'Question'
Tag  [####################################]  100%
1636 nodes created with label 'Tag'
Answer  [------------------------------------]    1%Node identifier '1984' was used multiple times - second occurrence at csv_files/Answer.csv:351
Answer  [####################################]  100%
22143 nodes created with label 'Answer'
ANSWER_TO  [####################################]  100%
22143 relations created for type 'ANSWER_TO'
AUTHOR_OF  [####################################]  100%
39472 relations created for type 'AUTHOR_OF'
HAS_TAG  [####################################]  100%
43215 relations created for type 'HAS_TAG'
Construction of graph 'bulk' complete: 126098 nodes created, 104830 relations created in 151.856101 seconds
151 seconds over port-forward and into a different continent london to us-east-1 not bad. Now we can setup the perf test. Would be awesome if I could dig up my old Locust steup.
EDIT (sanity note), in prod you wouldn't obviously put all your instances in a spot instance group. however all of this is now scripted and repeatable, worst case scenario it will all die and I will have to spent 3 minutes to rebuild it. just remember that you wouldn't do this with important data.
styk-tv
on 7 Apr 2019
@styk-tv
Yup, all you have created are similar to my use case. I was wondering if you got a chance to do a redisgraph query on concurrent connection of ~1000.
vvippark
on 8 Apr 2019
Ok thanks @vvippark
I'm trying to get to point where I have some time to actually bring Locust up for tests. Deficiency seems to be on the web-site, I doubt in database itself, however I will attempt both.
Q5) I got sidetracked a bit by #433 as I was writing queries for tests as my favourite cypher functions keys() and properties() are not yet implemented in RedisGraph. I need to know roughly the depth of queries you are trying. Review this benchmark doc and please paste some queries, are we talking 1 hop, 2 hops etc. Doc will give you the idea.
Q6) You need to demonstrate example of your implementation. Are we talking flask service in python or direct driver, if so which one? Are we talking calling headless sentinel quora-based or direct db? Could you please the code fragment with proper indentation? Driver version? Flask container WSGI or default?
Q7) As last question is on infrastructure. Need to know if you are calling from sidecart or from a different pod, through service or direct to pod? Please answer questions about afinity, node selectors, stateful sets. Also provide idea of instance size.
All will have impact. Thanks.
styk-tv
on 8 Apr 2019
Crudest possible way, from London workstation to Virginia cluster
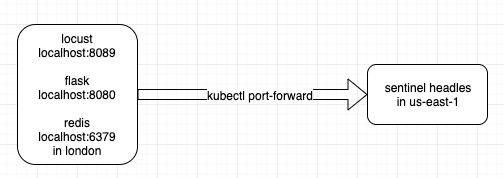
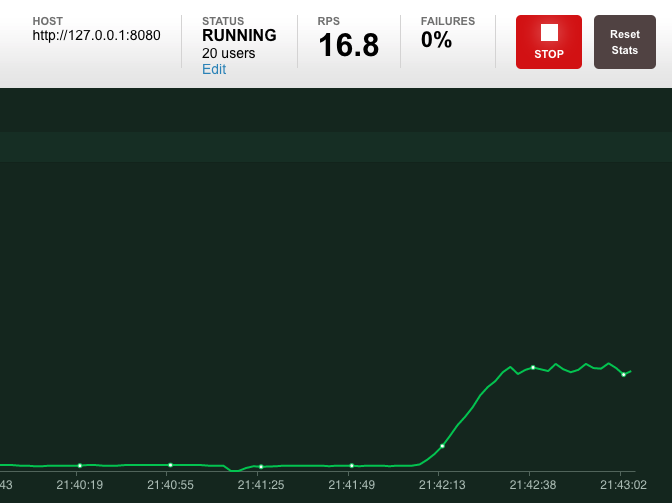
at 16 hits per seconds doing a post request into flask for a single entry tag using graphql chart. locust testing framework, hitting local terminal flask, hitting local endpoint of redis tunnel, going over proxy into kubernetes sentinel headless service endpoint
simplest possible flask implementation
#!/usr/bin/env python

from flask import Flask, request
import redis
from redisgraph import Node, Edge, Graph
import json

r = redis.Redis(host='localhost', port=6379)
redis_graph = Graph('bulk', r)
app = Flask(__name__)

@app.route('/redis',  methods=['GET', 'POST'])
def redis():
    query = "MATCH (t:Tag {name: 'odin'}) RETURN t"
    result = redis_graph.query(query)
    return json.dumps(result.result_set[0])

if __name__ == '__main__':
    app.run(host='127.0.0.1', port=8080, debug=True)
simplest possible Locust task:
#!/usr/bin/env python

import uuid

from datetime import datetime
from locust import HttpLocust, TaskSet, task


class MetricsTaskSet(TaskSet):
    _deviceid = None

    def on_start(self):
        self._deviceid = str(uuid.uuid4())

    @task(2)
    def post_redis(self):
        self.client.post(
            "/redis", {"deviceid": self._deviceid, "timestamp": datetime.now()})

class MetricsLocust(HttpLocust):
    task_set = MetricsTaskSet
I would say that 16/s over proxy and given latency is not bad. let me put this inside of the cluster and see how far we can push it.
EDIT: for the in-cluster test in will use 1634 tags as a randomized json array and each time call a random tag from the list of existing tags in json. Not sure if considered Hop 0 or Hop 1 but will feel a bit more fair to retrieve different tags at random, later we can expose another endpoint to create more complex tests.
My humble assumption is that this crude config would get at least 100x faster inside of the cluster to maybe 1500 cypher queries per second with full set of tags variance (from the scifi dataset of stackoverflow). Will ping back when in-cluster test is ready.
styk-tv
on 8 Apr 2019
A5) We are talking 1 hop queries.
A6) We are using flask app with gunicorn.
Flask app is similar to what you have written above with a different query.
query = 'MATCH (s:user)-[r:friends]->(ru:user) WHERE (s.id="A" or s.id="B" or s.id="C" or s.id="D" ) AND (ru.country="USA") RETURN ru LIMIT 40'
Here I am working with OR queries.
I am putting below in my requirements
meinheld==0.6.1
gunicorn==19.9.0
and running the flask app with gunicorn like below
gunicorn myapp:app --worker-class="egg:meinheld#gunicorn_worker" --workers=5 --timeout=10 --bind=:8080
You can stress test a simple url with return "ok" to check the req/sec of webserver and after that go on benchmarking above query on redis-graph.
A7) We are having redis-graph on different pods and myapp on different pod. My app is calling redis-graph through service. Redis-graph pods are on statefulsets.
Curious about your finding.
vvippark
on 9 Apr 2019
Referencing #343 and #389 Really weird thing is that same endpoint referenced as localhost through proxy into exactly same headless sentinel is working fine. In cluster when proper name is specified, it produces:
redis.exceptions.ReadOnlyError: You can't write against a read only replica.
This is spooky, i double checked again just to be sure. port-forward like demonstrated above. from local workstation to cluster pointing at Exactly the same endpoint
$ cat redis_test.py
import redis
from redisgraph import Node, Edge, Graph
r = redis.Redis(host='localhost', port=6379)
redis_graph = Graph('bulk', r)
query = "MATCH (t:Tag {name: 'odin'}) RETURN t"
result = redis_graph.query(query)
result.pretty_print()


$ python redis_test.py
+--------+
| t.name |
+--------+
|  odin  |
+--------+

Query internal execution time: 0.355973 milliseconds
I run this 100 times and it works 100 times, through sentinel. So whatever @swilly22 is reporting (that's it is related to permission to write to key space) cannot be true. Unless there is some other magic in place.
EDIT: just so there is no misunderstanding
NAME                                        TYPE        CLUSTER-IP      EXTERNAL-IP   PORT(S)              AGE
io-madstat-prod-redis-redis-ha              ClusterIP   None            <none>        6379/TCP,26379/TCP   2d
io-madstat-prod-redis-redis-ha-announce-0   ClusterIP   100.66.12.33    <none>        6379/TCP,26379/TCP   2d
io-madstat-prod-redis-redis-ha-announce-1   ClusterIP   100.67.111.45   <none>        6379/TCP,26379/TCP   2d
io-madstat-prod-redis-redis-ha-announce-2   ClusterIP   100.64.67.88    <none>        6379/TCP,26379/TCP   2d
and
kubectl port-forward service/io-madstat-prod-redis-redis-ha 6379:6379 -n redis
I am completely discouraged by @swilly22 's advice that 5.0.4 as this issue fixed. It doesn't. I proved it in #343 and wasted an hour of my life. Please, someone ping me back when this is sorted. I'm abandoning work on this ticket until then. C'est la vie
FYI @jeffreylovitz
styk-tv
on 10 Apr 2019
Please see my comment here
 swilly22
on 10 Apr 2019
swilly22
on 10 Apr 2019
@swilly22 thank you
@vvippark could you please confirm versions of python, redis and redisgraph-py libs? at this point I can't even confirm your setup as client returned from sentinel blows up redisgraph-py. i've probably missed something silly. If you could maybe comment on redisgraph-py #29
styk-tv
on 11 Apr 2019
@vvippark I found some time to push this further. Attempted 200 hits per second. Here are the results
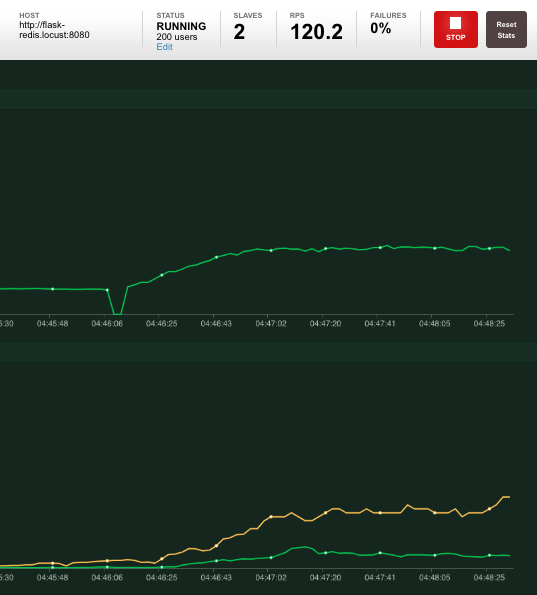
As you can see above I never climbed up all the way to 200/s. Stabilized at about 120/s with response time increasing to about 1500ms per call.
The following rules are still broken as this is first unoptimized test:
- flask is running without wsgi support. really bad not multi threaded.
- flask is running in debug mode
- flask could be running in the same pod as redis endpoint as current grouping creates additional service for.
All of the above will be solved for next test so please bare with me.

Above you can see that Redis barely even notices the traffic.
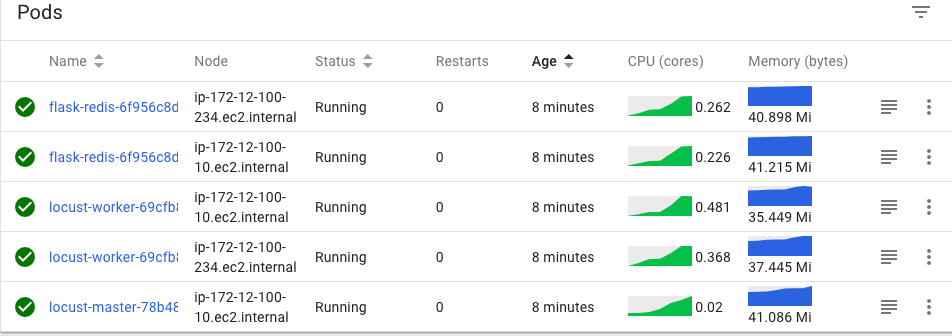
Above you can see worker nodes form Locust as well as two flask servers that are handling traffic as round robin.
So first cluster test conclusion. Slow is nothing to do with redis, nothing to do with locust, everything to do with flaky rest intermediary. Next test will focus on that.
styk-tv
on 12 Apr 2019
Ok I did one more since its dawn already:
This time I switched to AIOHTTP for the web server. Same setup as before
- 2 Locust worker nodes generating traffic. Set to launch 300 clients at 1 hit per second
- 2 web services with /redis endpoint talking to redis cluster through sentinel slave discovery
- 1 master 2 slaves redis cluster

This time out of desired 300/s we got to about 224. Response time at 1/4th of the Flask in debug mode.
V shape drop is me resetting Locust to go from 200 to 300 for a split moment it did the recalc

You can see actual performance test working here (0.5 of cpu k8s metric) so itself its becoming a bottleneck. Next time I try will have to increase working nodes of the test itself.
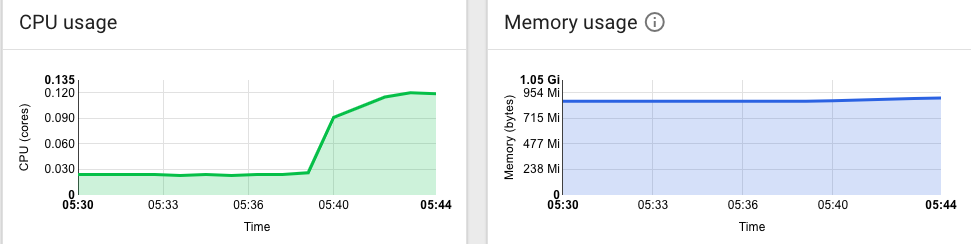
You can see Redis asking for more memory above. At the same below you see that Sentinel working together with Kubernetes Service headless endpoint is splitting the traffic amongst the slaves (master is getting no traffic). It's easy to figure out which one is which.

But as you can see here, Redis is still laughing at our attempts to bring in more traffic (almost idle)
So that formulates plan for next test. Until next time. We will get to 1500 eventually but optimization and proximity of all elements has to be analysed first of all. No point of just adding instances wastefully.
One thing I would ask you, because the queries I'm running now are very very simple, please provide a sample dataset with a script to import. This way I can ensure the test is running on a similar dataset complexity.
styk-tv
on 12 Apr 2019
@styk-tv
- I am using flask with gunicorn and worker class is meinheld. ( which I found better than AIOHTTP performing benchmarks)
gunicorn myapp:app --worker-class="egg:meinheld#gunicorn_worker" --workers=5 --timeout=10 --bind=:8080
- You can use your own dataset with multiple OR queries.
I am using below query.
query = 'MATCH (s:user)-[r:friends]->(ru:user) WHERE (s.id="A" or s.id="B" or s.id="C" or s.id="D" ) AND (ru.country="USA") RETURN ru LIMIT 40'
vvippark
on 12 Apr 2019
CLUSTER TEST 003
SPEC:
- 3x c4.large kubernetes instance group - "perftest" workers
- mainhed & gunicorn & flask & redisgaph client live on perftest nodes
- 3x c4.large kubernetes instance group - "redis" cluster
- redis cluster = 1 master 2 slaves, unified entry point trough sentinel slaves only
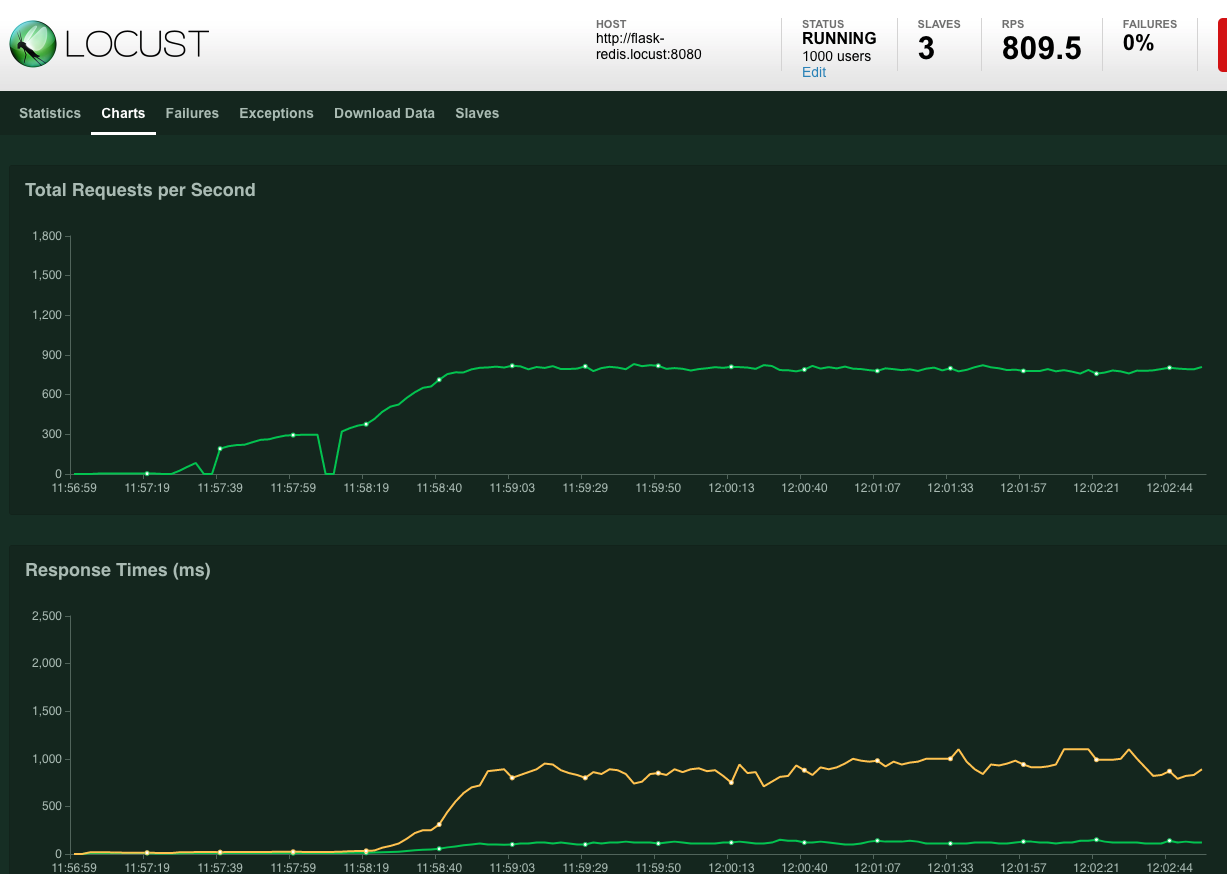
800+ hits per second.

workers and api on same setup

Redis starting to show moderate amount of Ram usage (1GB+) on each working slave.
Conclusion: Unfortunately choking as you can see, each hit averaging about 1000ms. Not the database but API servers. I will try to move them away from servers producing traffic.
Total cost . 6x c4.large instances in AWS as extension of my existing kubernetes cluster. 2x isolated instance group as spot instance deployed with kops. 6 x 0.04 max price for one hour = 0.32 USD
styk-tv
on 12 Apr 2019
Why I love Kubernetes:
Decided to migrate API from "perftest" group to "redis" group. I figured maybe living with database itself will make it for improvement of network round trips, proximity etc. Changed single variable and deployed chart.

Took 60 seconds. No improvement, however I could see pods drop and be recreated on different nodes, as you can see on the above, ZERO failed hits. Not even one call dropped. Just an interesting observation.
Just as an FYI: this is current setup per namespace:
LOCUST:
>> kubectl get all -n locust -o wide
NAME                                 READY     STATUS    RESTARTS   AGE       IP            NODE
pod/flask-redis-d7dcddb6c-g7rnn      1/1       Running   0          55s       100.96.7.4    ip-172-12-100-184.ec2.internal
pod/flask-redis-d7dcddb6c-h42g6      1/1       Running   0          1m        100.96.6.3    ip-172-12-100-162.ec2.internal
pod/flask-redis-d7dcddb6c-zthnw      1/1       Running   0          1m        100.96.3.3    ip-172-12-100-68.ec2.internal
pod/locust-master-6689b998bd-fdjdl   1/1       Running   0          22m       100.96.9.6    ip-172-12-100-241.ec2.internal
pod/locust-worker-5cb674f4df-256gd   1/1       Running   0          22m       100.96.9.7    ip-172-12-100-241.ec2.internal
pod/locust-worker-5cb674f4df-27r8m   1/1       Running   0          22m       100.96.8.7    ip-172-12-100-170.ec2.internal
pod/locust-worker-5cb674f4df-vmqtv   1/1       Running   0          22m       100.96.10.7   ip-172-12-100-249.ec2.internal

NAME                    TYPE        CLUSTER-IP       EXTERNAL-IP   PORT(S)                      AGE       SELECTOR
service/flask-redis     ClusterIP   100.67.175.198   <none>        8080/TCP                     22m       app=flask-redis
service/locust-master   ClusterIP   100.66.128.12    <none>        8089/TCP,5557/TCP,5558/TCP   22m       app=locust-master

NAME                            DESIRED   CURRENT   UP-TO-DATE   AVAILABLE   AGE       CONTAINERS      IMAGES                        SELECTOR
deployment.apps/flask-redis     3         3         3            3           22m       flask-redis     polfilm/redisgraphql:latest   app=flask-redis
deployment.apps/locust-master   1         1         1            1           22m       locust-master   polfilm/redisgraphql:latest   app=locust-master
deployment.apps/locust-worker   3         3         3            3           22m       locust-worker   polfilm/redisgraphql:latest   app=locust-worker

NAME                                       DESIRED   CURRENT   READY     AGE       CONTAINERS      IMAGES                        SELECTOR
replicaset.apps/flask-redis-5f4cc46d5      0         0         0         22m       flask-redis     polfilm/redisgraphql:latest   app=flask-redis,pod-template-hash=190770281
replicaset.apps/flask-redis-d7dcddb6c      3         3         3         1m        flask-redis     polfilm/redisgraphql:latest   app=flask-redis,pod-template-hash=838788627
replicaset.apps/locust-master-6689b998bd   1         1         1         22m       locust-master   polfilm/redisgraphql:latest   app=locust-master,pod-template-hash=2245655468
replicaset.apps/locust-worker-5cb674f4df   3         3         3         22m       locust-worker   polfilm/redisgraphql:latest   app=locust-worker,pod-template-hash=1762309089
REDIS:
kubectl get all -n redis
NAME                                          READY     STATUS    RESTARTS   AGE
pod/io-madstat-prod-redis-redis-ha-server-0   2/2       Running   0          1d
pod/io-madstat-prod-redis-redis-ha-server-1   2/2       Running   0          1d
pod/io-madstat-prod-redis-redis-ha-server-2   2/2       Running   0          1d

NAME                                                TYPE        CLUSTER-IP       EXTERNAL-IP   PORT(S)              AGE
service/io-madstat-prod-redis-redis-ha              ClusterIP   None             <none>        6379/TCP,26379/TCP   1d
service/io-madstat-prod-redis-redis-ha-announce-0   ClusterIP   100.64.174.32    <none>        6379/TCP,26379/TCP   1d
service/io-madstat-prod-redis-redis-ha-announce-1   ClusterIP   100.65.242.159   <none>        6379/TCP,26379/TCP   1d
service/io-madstat-prod-redis-redis-ha-announce-2   ClusterIP   100.67.1.101     <none>        6379/TCP,26379/TCP   1d

NAME                                                     DESIRED   CURRENT   AGE
statefulset.apps/io-madstat-prod-redis-redis-ha-server   3         3         1d
LAST THING: as a last test, I want to increase number of gunicorn workers. Flask is currently hosted with 10 workers (using this command)
gunicorn main:redis --workers=10 --timeout=10 --bind=:8080
Will be quite interesting to see if raising workers to 20 makes a difference on the response time (still holding at ridiculous 1000ms according to above diagram)
styk-tv
on 12 Apr 2019
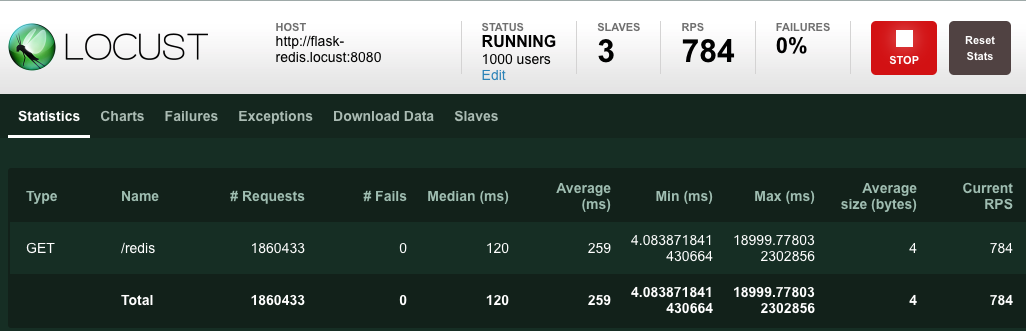
..and I was reading the chart wrong. Top line is 95% percentile. I'm pasting raw data screen. You can see that average is at 259ms and median at 120ms. So that just got a whole lot better.
styk-tv
on 12 Apr 2019
I have added 3 more nodes to the "perftest" group so now total of 6, and increased workers on gunicorn from 10 to 35.... and made it worse.
Example of Redis slave from CloudWatch perspective:
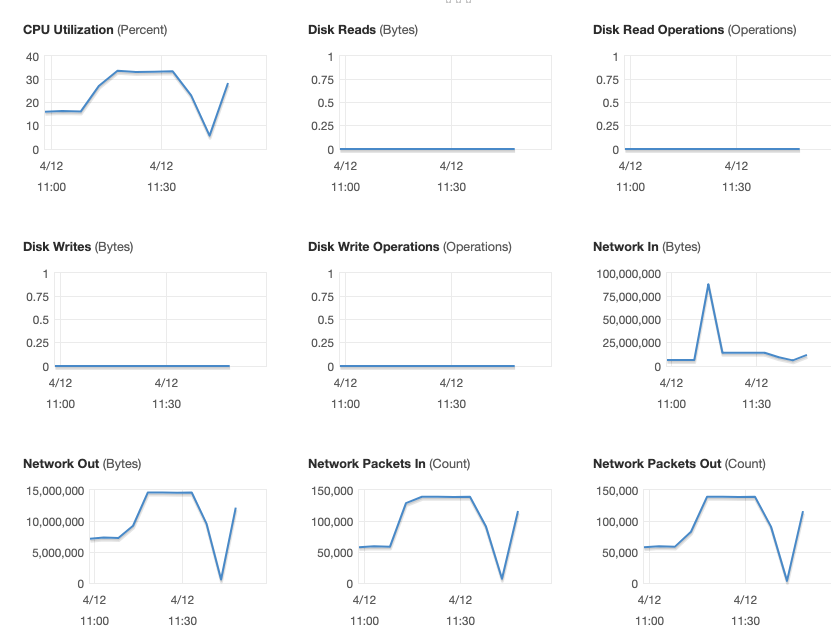
More workers, more unstable fluctuations, response time actually increased quite a bit.
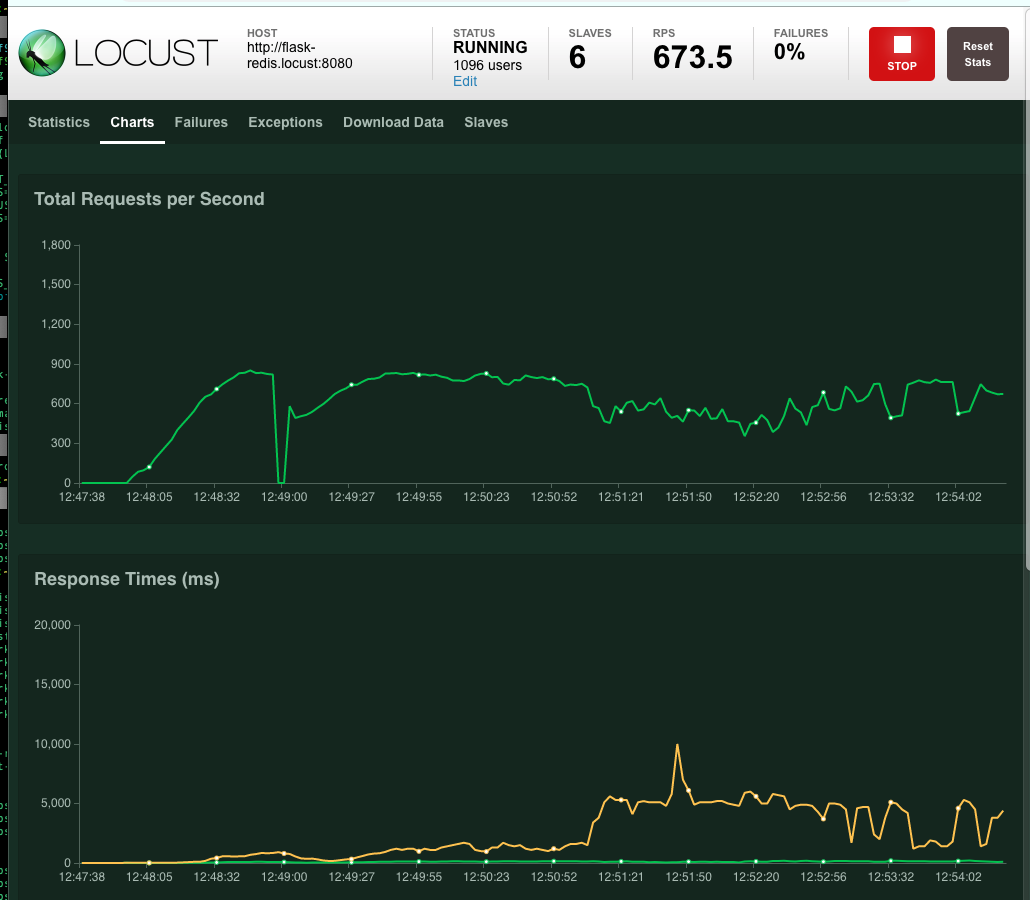
I should have done 20 gunicorn workers like initially planned not 35. FYI, at this point it would be easy to scale the database as well but I still wanted to see what performance i can do on the 1 master + 2 slaves config to get max performance out of it.
styk-tv
on 12 Apr 2019
As a conclusion every single bit makes a difference. Instance size for c4.large is 3.75GB to compare m4.large is similar price but 8GB of ram instead (a bit slower EBS but who cares we don't use any), EBS is attached and all of database is loaded into memory.... i think, disk activity during entire operation was ZERO, not sure what are rules of persistence but we also didn't even talk to master. Only slaves provided by Sentinel.
Take note of everything you change as you will need to go back and forth many times as you adjust small details. Everything matters at scale. You also experience issues at scale that you have never experience otherwise.
Your query you will have to try yourself. My record of 821/s is still well above your reported 4/s not sure if this is query related.
Performance Test Repo: https://github.com/styk-tv/redisgraphql
Thank you @vvippark and big thumbs up to @jeffreylovitz and @swilly22 (couldn't do this without you)
Signing off.
styk-tv
on 12 Apr 2019
Thanks for all the work you put into this, @styk-tv!
I think I'll leave commentary on the issue itself to people with more experience in this area, but I'd still like to say how much I appreciate your effort and diligence in investigating this matter!
jeffreylovitz
on 12 Apr 2019
@styk-tv Impressive work, are you using CONFIG SET slave-read-only no or only sending through the master which was given by sentinel ?
 Sceat
on 11 Jul 2020
Sceat
on 11 Jul 2020
@styk-tv this is great. I'm seeing a number of errors deploying redislabs/redisgraph:2.2.4 with this chart. I saw your repo with some of this work, but not details on the helm deployment. Would you mind sharing the helm chart and install command (or values file) used above?
 stevencox
on 21 Oct 2020
stevencox
on 21 Oct 2020
Related issues
 esokullu
·
6Comments
esokullu
·
6Comments
 Talha-B
·
5Comments
Talha-B
·
5Comments
 m4g005
·
3Comments
m4g005
·
3Comments
 WitchsCat
·
10Comments
WitchsCat
·
10Comments
 abevoelker
·
5Comments
abevoelker
·
5Comments
Most helpful comment
As a conclusion every single bit makes a difference. Instance size for c4.large is 3.75GB to compare m4.large is similar price but 8GB of ram instead (a bit slower EBS but who cares we don't use any), EBS is attached and all of database is loaded into memory.... i think, disk activity during entire operation was ZERO, not sure what are rules of persistence but we also didn't even talk to master. Only slaves provided by Sentinel.
Take note of everything you change as you will need to go back and forth many times as you adjust small details. Everything matters at scale. You also experience issues at scale that you have never experience otherwise.
Your query you will have to try yourself. My record of 821/s is still well above your reported 4/s not sure if this is query related.
Performance Test Repo: https://github.com/styk-tv/redisgraphql
Thank you @vvippark and big thumbs up to @jeffreylovitz and @swilly22 (couldn't do this without you)
Signing off.