Redash: Add support for funnel visualizations
When working with event data it is often required to visualize a funnel: a multi step journey in a particular direction towards a particular destination, in order to understand where in the funnel most users drop off.
Horizontal bar charts are a nice way of doing these: esp. if the bars can all be centered. (See the second diagram here.)
The Looker guys do this quite nicely: https://discourse.looker.com/t/funnel-visualization/4503/2
 yalisassoon
All 7 comments
Let's go with this form:
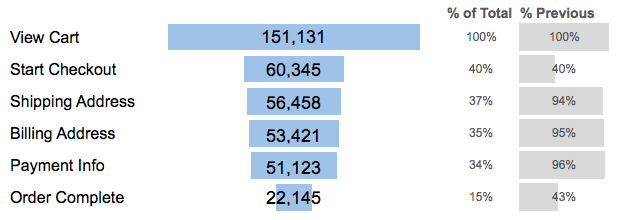
It's a simple table showing the data with the only tricky part is bars in the middle.
The configuration for the visualization will be:
StepcolumnValuecolumn- Show/Hide
% from Previous
The order will be based on the order of the results.
I would also consider having the % value on the bar and the actual value in a column (@yalisassoon wdyt?).
 arikfr
on 14 Feb 2018
arikfr
on 14 Feb 2018
@arikfr Hi, can I volunteer to work on this? Or do I have to have a pull request first?
 tonyjiangh
on 15 Feb 2018
tonyjiangh
on 15 Feb 2018
@tonyjiangh you're more than welcome! Thanks 🙏
arikfr
on 15 Feb 2018
@arikfr
Just wanna confirm before I start, is it OK to use Plotly.js for funnel chart? Or is there a plan here to isolate plotly only for chart? In that case I should explore D3.
I thought most visualization here is using plotly but obviously only Chart does after checking the code here.
With plotly.js the funnel implementation would look like this.
tonyjiangh
on 17 Feb 2018
@tonyjiangh
Thanks for the extra effort with providing an example. It's a clever use of Plotly, but I'm not sure it's the right tool for the job. Because of Plotly, the end result will be harder to style to match current look & feel (instead of inheriting fonts and other style definitions) and also has unnecessary controls - like the ability to zoom in.
D3 does feel like the more correct approach, as you can use it to transform the data into an HTML <table> with an SVG for the bars. But I'm not even sure D3 is needed here :) We can utilize Angular.js to iterate over the data and create the <table>.
I've been playing around with it over the weekend and created two options using HTML:
- Creating the bars with
backgroundstyles: https://codepen.io/arikfr/pen/JpMLvM - Creating the bars with
<div>s: https://codepen.io/arikfr/pen/VQygWK
The second one feels less hacky, although I did have to add a container div to be able to position the text in the center of each funnel step bar. Notice that due to it being simple HTML we gain nice interactions (the hover) but also able to copy paste the data.
I used jQuery there to fiddle with the DOM, but it will be much easier with Angular.js.
I'm not familiar enough with D3, but if it's easy to create the bars with D3 as pure SVG, it might produce nicer results and will feel less hacky.
Up to you to decide if you want to use D3 here. :-)
@kravets-levko if you have ideas, you're welcome to share.
arikfr
on 18 Feb 2018
This looks great @arikfr @tonyjiangh ! Very excited to see this happen...
yalisassoon
on 18 Feb 2018
@arikfr
Thank you for the example. I understand the stance here now.
I made some exploration with D3 and Angular.js first.
tonyjiangh
on 18 Feb 2018
Related issues
yalisassoon
·
4Comments
 alison985
·
3Comments
alison985
·
3Comments
 susodapop
·
3Comments
arikfr
·
3Comments
susodapop
·
3Comments
arikfr
·
3Comments
 atharvai
·
4Comments
atharvai
·
4Comments
Most helpful comment
@arikfr Hi, can I volunteer to work on this? Or do I have to have a pull request first?