Realm-cocoa: High CPU usage after writes associated with `LinkingObjects`
Goals
I'm trying to solve a problem we're experiencing in the WWDC Mac app. At a very high level, the problem is that the RLMRealm notification listener thread is using 100% of a core for relatively long periods of time. The typical case is 3 seconds, but I've seen 7 seconds.
I've traced the issue into realm_cooridinator.cpp and the large number of CollectionNotifiers it has to run. The owner of the CollectionNotifier is the LinkingObjects that are properties of one of our most used models, Session. The problem seems to scale with the complexity of the models involved, and how many objects that are in the table related by List properties (these are proven by the sample application).
The scenario that is causing it is this:
- A large number of model objects are being queried.
- They are sorted using a complex function which loads in
LinkingObjectsproperties - Explicit object observers are being added to those models. (Actually, all it takes is one)
- A change is made to 1 of those models
After this series of steps, the notifiers are run and take a long time. The huge CPU usage only happens on the first write after the LinkingObjects get cached.
So my questions are:
- Is this something that is behaving as expected?
- If it is, are there recommended changes that we could make to our models to reduce the effect?
I feel it's also worth mentioning that I have potentially worked around the large number of notifiers by replacing the LinkingObjects with explicit queries that aren't cached. This allows the notifiers to be unregistered before any writes happen. In this work around, I'm potentially trading off for loss of performance in other areas.
Expected Results
I would expect LinkingObjects to not have a deleterious effect on the performance of my application.
Actual Results
The cached queries from the LinkingObjects are creating a large amount of overhead by way of the CollectionNotifiers they are implicitly registering.
note: The LinkingObjects may be a red herring in all this, the problem might be complexity issues making the notification runners take much too long.
Steps to Reproduce / Code Sample
I've created a simple application that can be used to recreate the issue. Since it does not use the full set of data, the problem isn't as pronounced, but it is clearly reproducible.
To reproduce, run the Mac scheme and do the 3 steps: populate realm, load objects, modify object.
The general behavior of the sample application is profiled here:
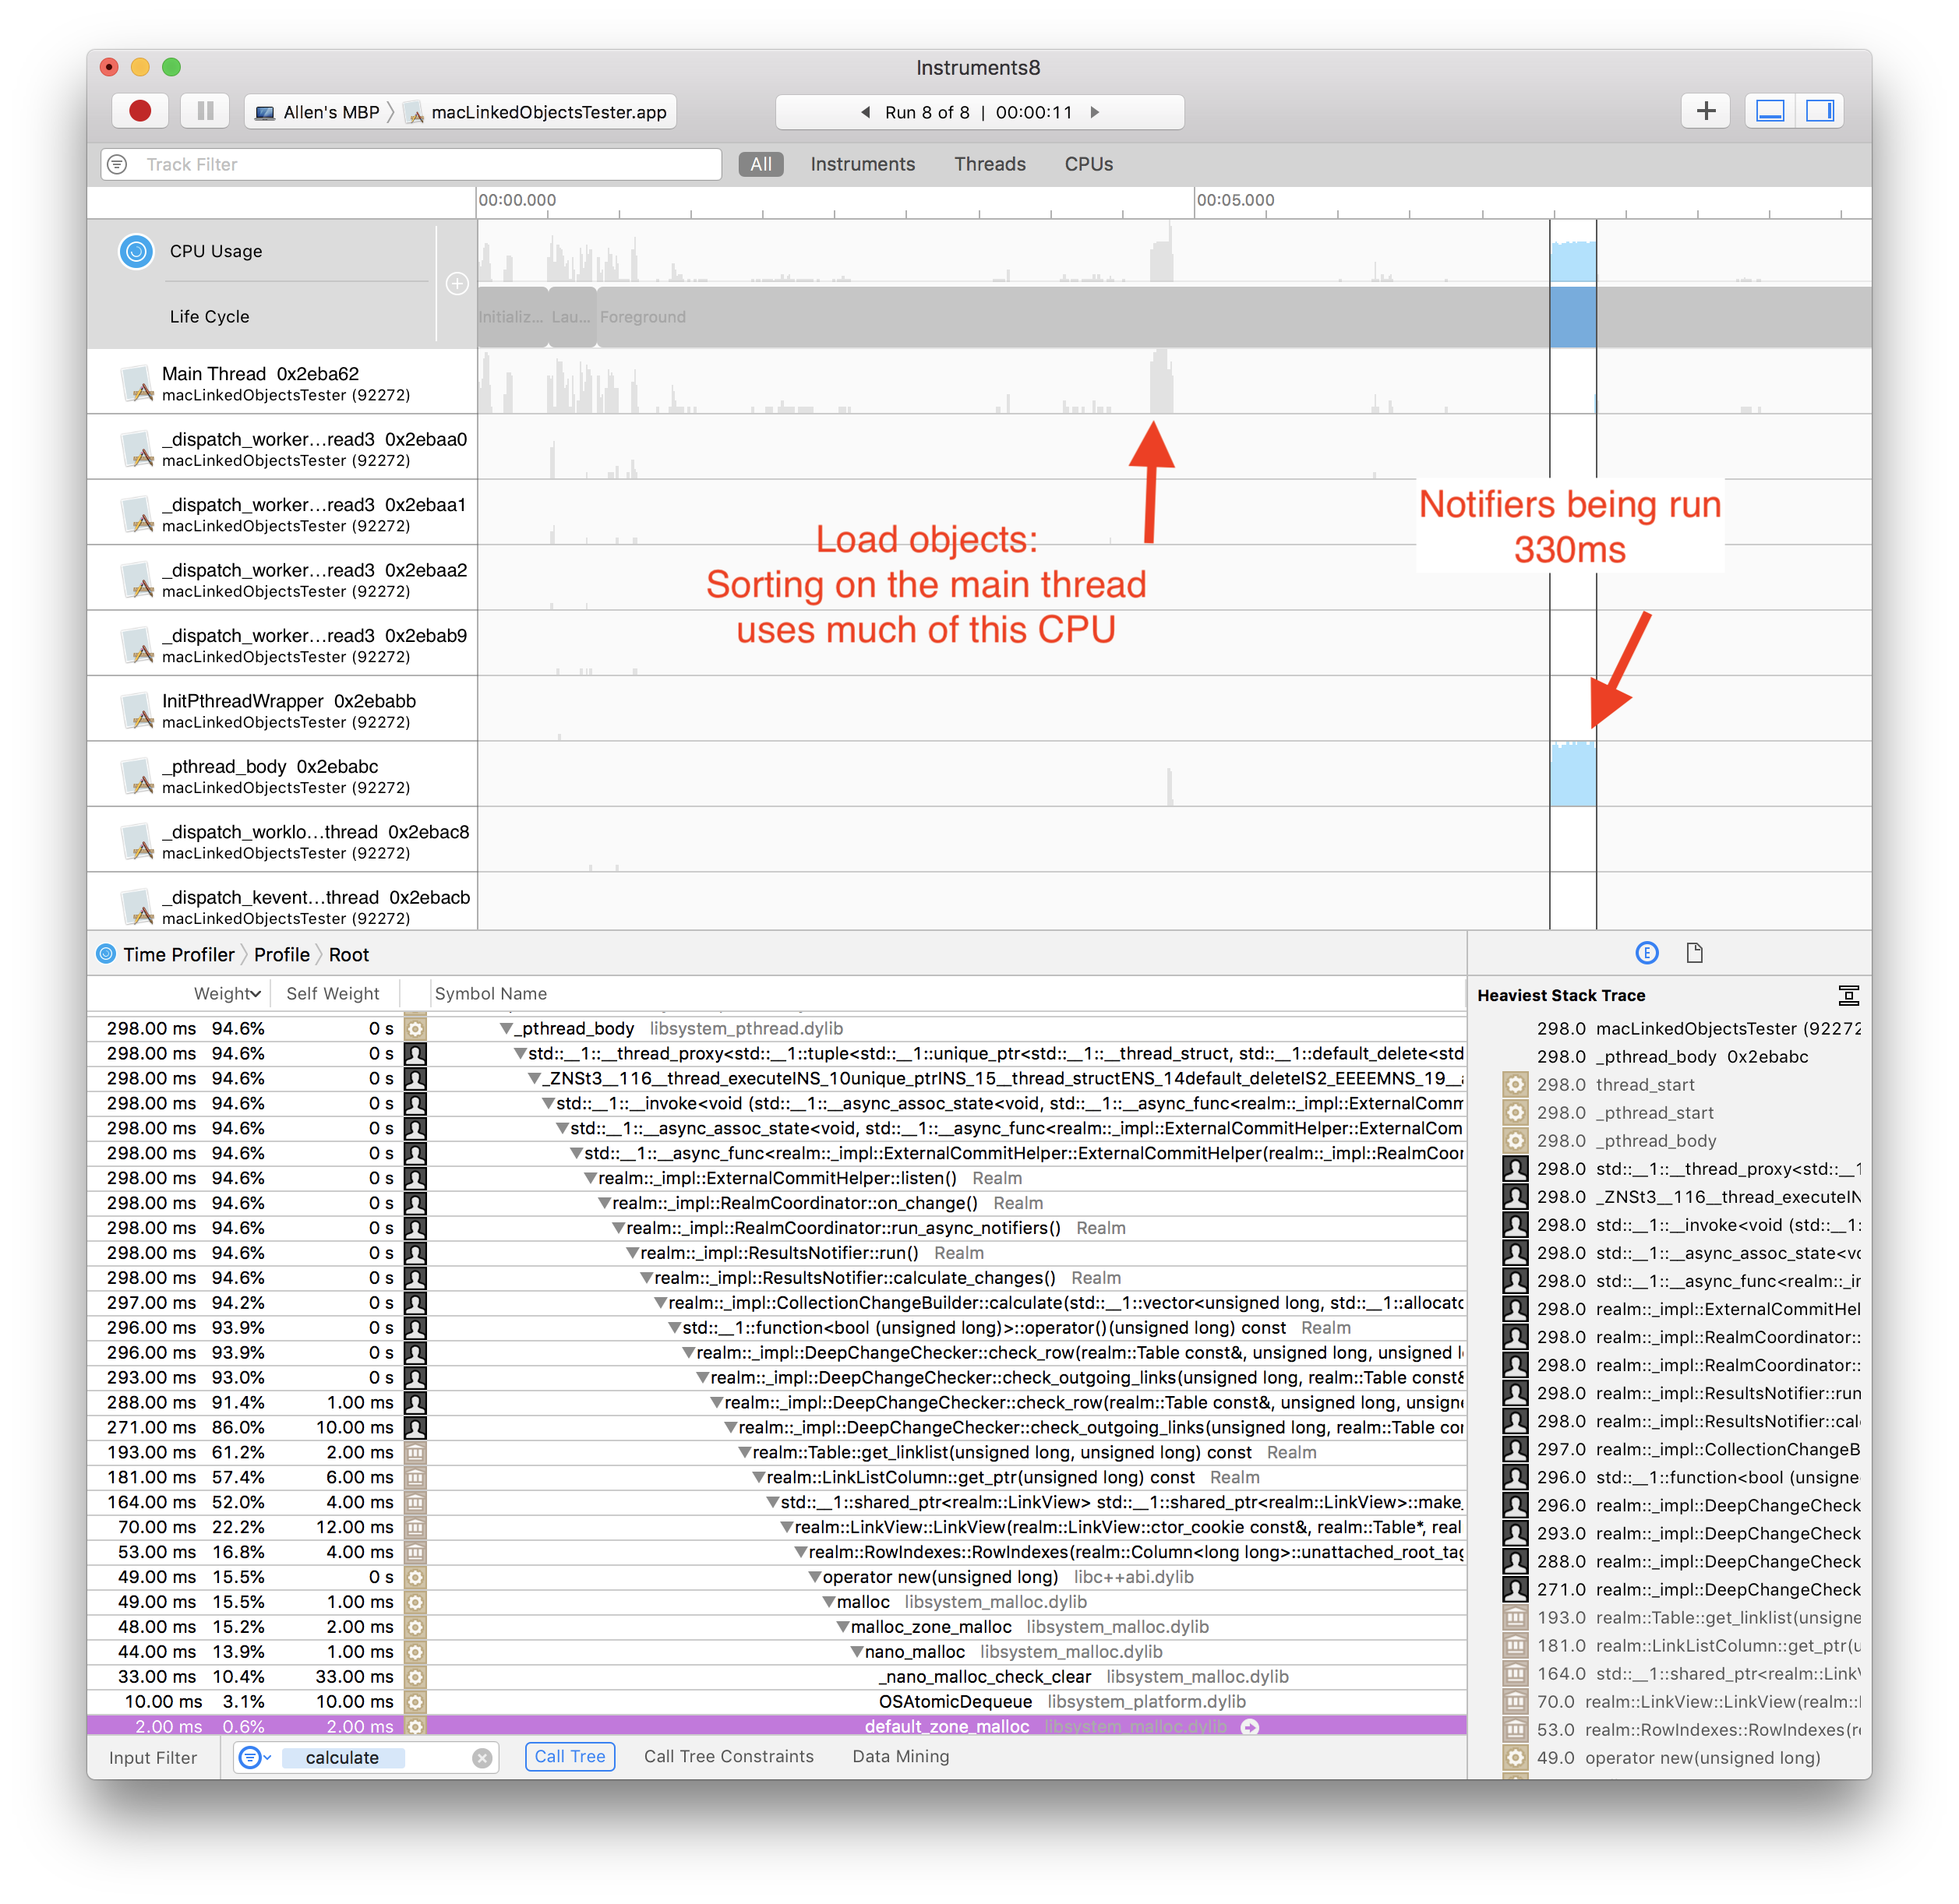
The behavior of the production app (from master) is profiled here:
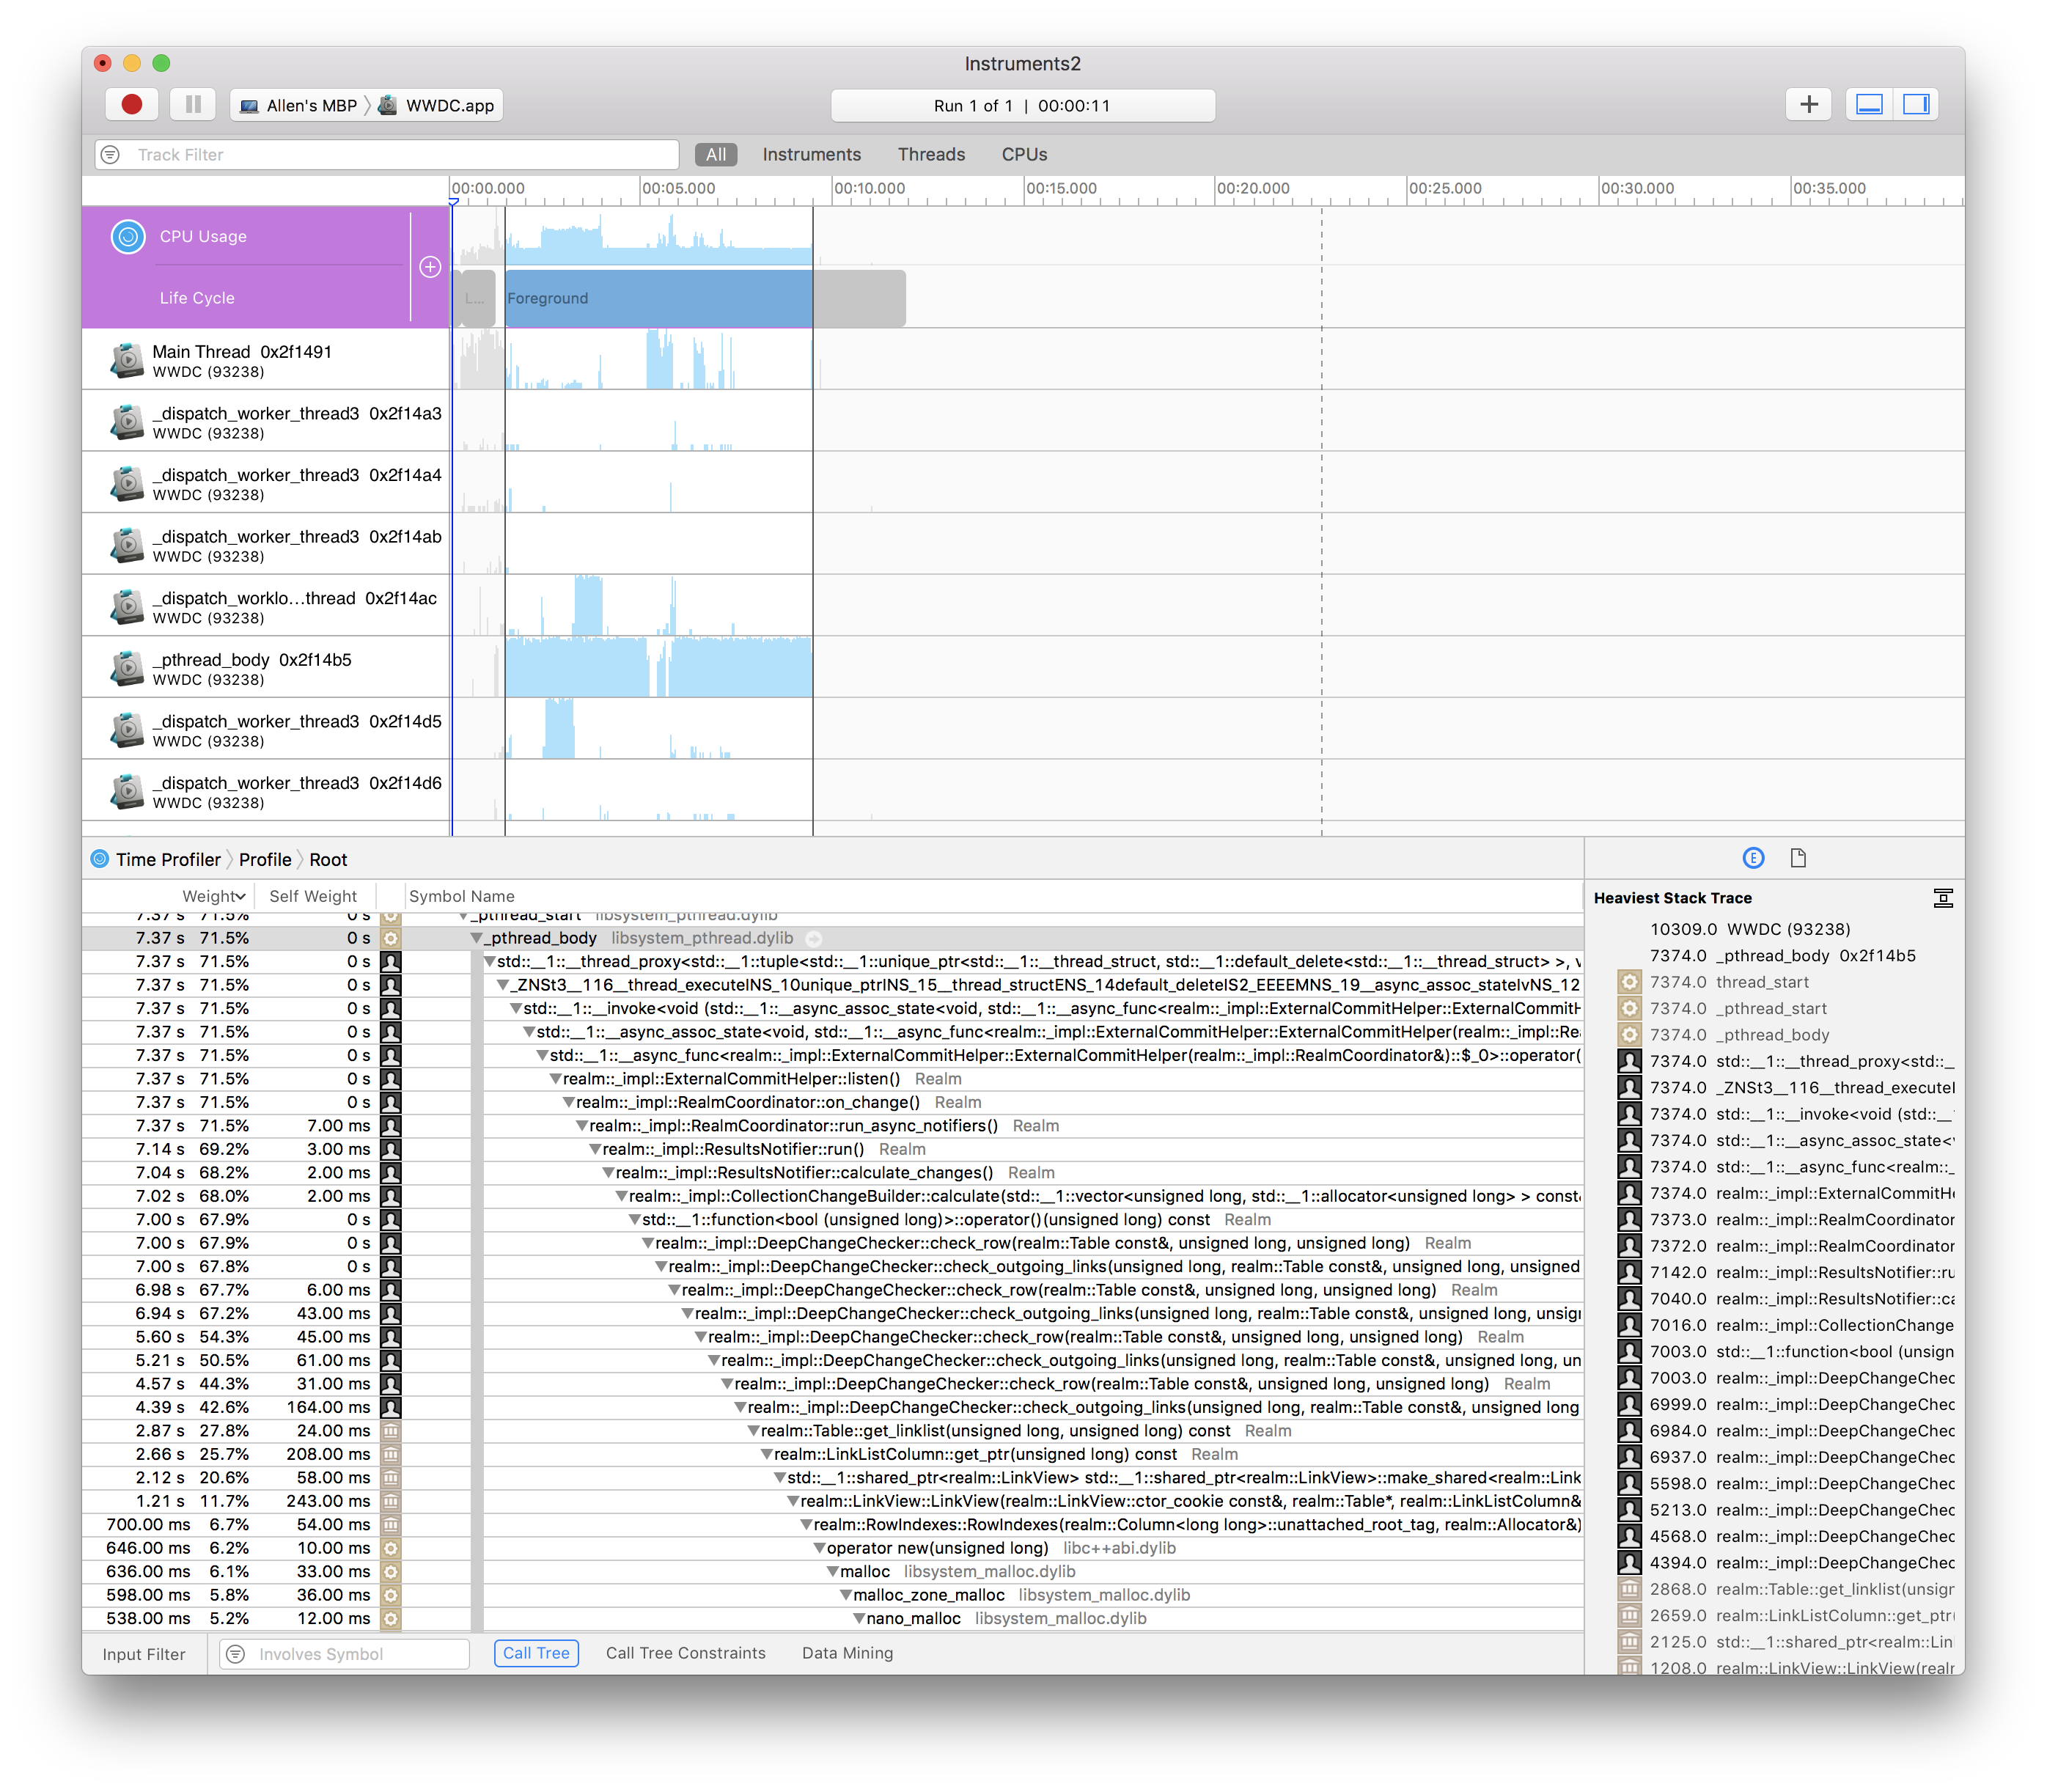
A more complete look at the schema and size of our tables:

Version of Realm and Tooling
Realm framework version: 3.7.1 (and early versions as well)
Xcode version: 9.4
iOS/OSX version: 10.13.5
Dependency manager + version: Cocoapods 1.5.3 / Carthage 0.29.0 (reproduced with both)
 allenhumphreys
All 6 comments
I can reproduce the bad behavior in the actual app locally.
- On launch, ~3000 LinkingObjects objects are created and accessed
- Each one registers itself as a Results that needs to be kept up-to-date
- A commit happens.
- Each of the queries for the LinkingObjects objects are rerun
- Each of the objects present in both the old and new states are checked for modifications, which takes a few seconds
- The information calculated in 4 and 5 are discarded because they aren't actually applicable to a LinkingObjects object with no observers
- Some time later most of the LinkingObjects objects are deallocated because they were just temporaries
On our side the things that need to be fixed are that we shouldn't be calculating the detailed change information for collections that don't actually have any change callbacks registered, and we also shouldn't even be implicitly registering LinkingObjects as async queries in the first place as the "query" is just reading some persisted data and doesn't benefit in any way from being run on a background thread.
You can probably work around this with careful use of autorelease pools to ensure that the LinkingObjects objects are deallocated promptly, but I think this will be a fairly easy one to fix.
 tgoyne
on 13 Jun 2018
tgoyne
on 13 Jun 2018
With the changes in https://github.com/realm/realm-object-store/pull/664 the time spent on the worker thread on startup is cut from ~5 seconds to ~300ms on my machine.
tgoyne
on 14 Jun 2018
I gave it a try in our project and it easily addresses our concerns, no question. Thanks for your help! Looking forward to your release that contains the fix :-)
allenhumphreys
on 14 Jun 2018
I am using RealmSwift 3.7.2 and creating Large number of parent object that in its initialisation creates large number of List objects and each List object further creates large number of List objects. And it takes a around 10-15 minutes. iOS Gloss https://github.com/hkellaway/Gloss is being used to initialise parents objects. Can you please help me with do this tasks in seconds? Thanks in advance.
 rohit-skycap
on 18 Jun 2018
rohit-skycap
on 18 Jun 2018
Please create a new issue describing your problem rather than commenting on an unrelated one.
tgoyne
on 18 Jun 2018
The fix for this was included in 3.7.3.
tgoyne
on 19 Jun 2018
Related issues
 duribreux
·
3Comments
duribreux
·
3Comments
 Bogidon
·
3Comments
Bogidon
·
3Comments
 javierjulio
·
3Comments
javierjulio
·
3Comments
 dennisgec
·
3Comments
dennisgec
·
3Comments
 xspyhack
·
3Comments
xspyhack
·
3Comments
Most helpful comment
With the changes in https://github.com/realm/realm-object-store/pull/664 the time spent on the worker thread on startup is cut from ~5 seconds to ~300ms on my machine.