Reactor-netty: Chunk data from parallel requests is occasionally swapped around
We've built an application using the spring-webflux framework which listens to inbound HTTP requests and forwards the received bodies to several destinations on the outbound. You can view it as a "one to many" data mapper. On the inbound, we're using a WebFlux handler and on the outbound we're using the reactive WebClient, both of which are built on top of reactor-netty. The handled payloads typically have a size of ~1MB.
Expected Behavior
The same inbound data should be sent over to all outbound connections.
Actual Behavior
The outbound data occasionally gets messed up, leading the outbound servers to return 400 error status codes. When this happens, said servers, which run Nginx, claim that the "client sent invalid chunked body", suggesting that the HTTP/1.1 chunked transfer encoding is not being performed correctly by our WebClient instance.
To better understand why Nginx is claiming that the data was invalid, we performed packet captures in two places:
- from within the Java app, after Netty's httpCodec handler, using functionality from the built-in
wiretaplogger. - from outside the Java app using
tcpdumpon the same machine, effectively dumping all outbound traffic.
Here's what we observed from one of the 400 error occurrences:
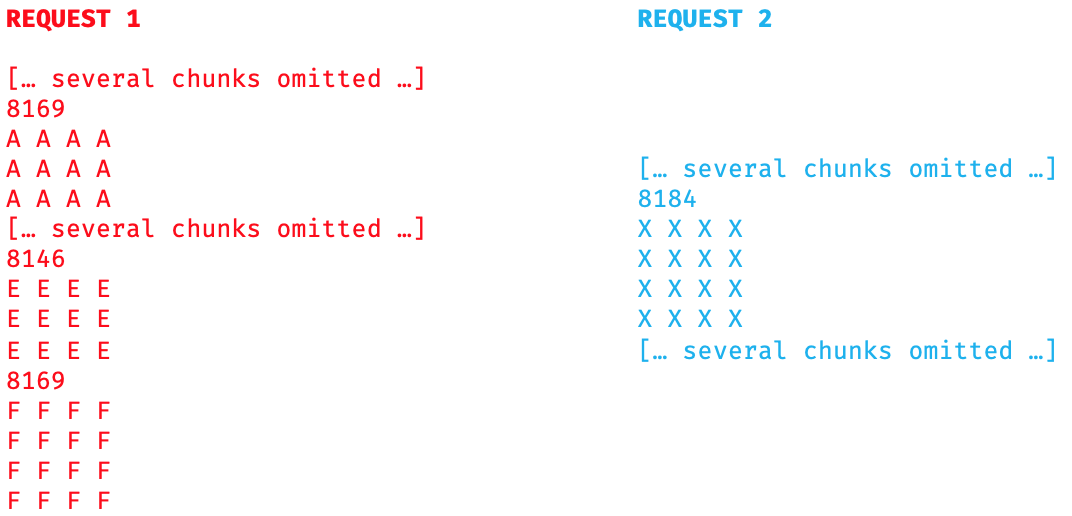
- a first request, labelled request 1, starts happily. The wiretap Java logs and the tcpdump both report identical chunks initially.
- at some point, a chunk size equal to 8146 comes out of httpCodec and is indeed followed by 8146 bytes of chunk data.
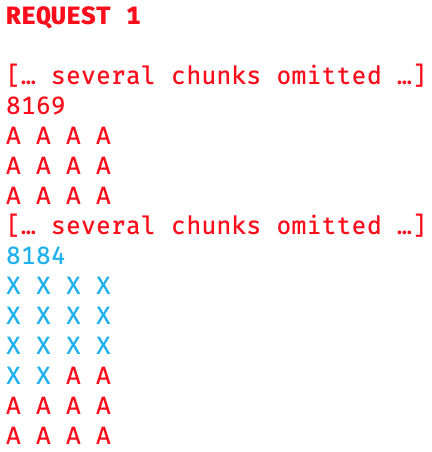
- however, the tcpdump disagrees. It indicates a chunk size equal to 8184 and the following chunk data is different.
- looking through the entire Java logs for request 1, the chunk data from the tcpdump is nowhere to be found.
- looking through the Java logs of a second request that was happening in parallel, request 2, we can find part of the chunk data that tcpdump saw in request 1 (blue X in pictures below).
- the Java logs for request 2 show that the chunk data contains 8184 bytes, but the tcpdump indicates that only 8146 bytes of that data chunk were swapped from request 2 into request 1.
- at this point there are 38 remaining bytes at the end of the contentious chunk data in the tcpdump. Looking for them in the Java logs, they correspond to a repeat of an earlier chunk data which was sent as part of request 1 (repeated red A in picture below).
Visually, here's what is produced by httpCodec according to the Java wiretap logs:
Visually, here's what actually comes out of the Java app for request 1:
Note that once the data leaves the Java wiretap logger, it only goes through a single remaining handler in the Netty pipeline, sslHandler. When we "skip" the sslHandler by configuring our application to send traffic to a plain HTTP server rather than a HTTPS one, we are no longer able to reproduce any bad requests, which suggests there is a bug in the sslHandler or the library code dispatching the Netty messages to the sslHandler. Worth emphasising that at that point, the Netty messages flowing through the pipelines are well outside the control of our own application code: we have not changed how WebClient operates underneath the hood or introduced any custom Netty handlers.
Steps to Reproduce
We have only seen errors in our production environment and have not managed to create a shareable piece of code that can reproduce these bad request errors in any local setup. Some of the challenges with reproducing include the following:
- the error happens very rarely, once every ~100000 requests.
- the error only seems to happen when there is a reasonable amount of latency involved, namely:
- on the inbound, the bodies are sent over a few hundred milliseconds.
- on the outbound, we forward the chunks to a remote content distribution network over public Internet, and the content distribution network is in a different geographical location.
Possible Solution
That fact that data from two parallel requests is being swapped around, that the error cannot be consistently reproduced and that it only seems to happen when some latency is involved (i.e. increasing the likelihood of concurrent requests overlapping in time) seems to indicate that there is a race condition somewhere. To confirm this, we overrode reactor-netty's default configuration to use a single, worker (i.e. .runOn(LoopResources.create("reactor-client", 1, true))) and indeed the problem goes away. We've managed to isolate the problem deep down somewhere around the sslHandler, but we're still unsure whether the problem is caused by Netty itself or reactor-netty.
Single threading WebClient on the outbound is not ideal, but we're content with this workaround for our use case. I'm mostly documenting the issue in case other users bump into the same problem or with the hope that someone more expert in the Netty libraries may be able to pinpoint the root cause of the problem with the details I've provided. :)
Your Environment
- Reactor version(s) used: 1.0.1 for reactor-netty, 3.4.0 for reactor-core
- Other relevant libraries versions (eg.
netty, ...): Netty 4.1.54.Final - JVM version (
java -version): openjdk 11.0.9.1 2020-11-04 LTS - OS and version (eg.
uname -a): CentOS Linux release 7.9.2009
 PyvesB
All 13 comments
@PyvesB Is it possible for you to test with the latest releases so that we are sure this is not fixed (Netty/Reactor Netty)
 violetagg
on 25 Jan 2021
violetagg
on 25 Jan 2021
I would also check with different netty versions to reduce the scope
 OlegDokuka
on 25 Jan 2021
OlegDokuka
on 25 Jan 2021
As part of our investigation we did actually update the aforementioned dependencies several times, I only indicated the latest versions we were running. Here are the three version pairs we tried, all of which had the problem:
Netty: 4.1.45.Final, 4.1.51.Final, 4.1.54.Final
Reactor-Netty: 0.9.5.RELEASE, 0.9.11.RELEASE, 1.0.1
Admittedly, we never performed a detailed analysis as described here with the oldest 4.1.45.Final-0.9.5.RELEASE pair, but we were observing 400 errors with similar symptoms at the time. Unfortunately, as these are fairly wide-ranging versions (beginning, middle and end of 2020), this won't reduce the scope as hoped by @OlegDokuka.
@violetagg the challenge with reproducing is that we basically have to pull out the single-threading workaround and reintroduce the bug in production, which really isn't ideal. With your more precise knowledge of what went in the last few releases, do you think there's a significant likelihood that this bug may have been solved since the end of last year?
PyvesB
on 25 Jan 2021
@PyvesB As you reproduce this with 1.0.1, I do not see anything relevant to this use case in the fixes for 1.0.2/1.0.3.
For Netty I cannot comment there are a lot of fixes and the current version is 4.1.58.Final.
For 0.9.x releases -> I don't think it is relevant but there is a regression in 0.9.10 that is fixed in 0.9.14 (1.0.1)
https://github.com/reactor/reactor-netty/releases/tag/v0.9.14.RELEASE
violetagg
on 25 Jan 2021
@violetagg @OlegDokuka I spent some time updating dependencies and temporarily pulled out the single-threading workaround from our application. I can confirm that the problem still occurs with reactor-netty 1.0.3 and netty 4.1.58.Final.
PyvesB
on 27 Jan 2021
@PyvesB From the logs that you have can you tell us the channel ids for both requests and the even loop names?
i.e.
... [reactor-http-nio-3] ... - [id: 0x9bd2b9b0, ...] ...
Also can you add here your pipeline configuration? For this you do not need to execute the scenario that is failing, just run one request and from the logs extract the following:
... [reactor-http-nio-3] ... - [id: 0x9bd2b9b0] Initialized pipeline DefaultChannelPipeline{(reactor.left.loggingHandler = io.netty.handler.logging.LoggingHandler), (reactor.left.httpCodec = io.netty.handler.codec.http.HttpClientCodec), (reactor.right.reactiveBridge = reactor.netty.channel.ChannelOperationsHandler)}
Also can you try to enable the wire logger for the SSL
https://github.com/reactor/reactor-netty/blob/91c651c15e8c39140c784078b4f3a32d4490efb4/reactor-netty-core/src/main/java/reactor/netty/ReactorNetty.java#L169
violetagg
on 27 Jan 2021
@PyvesB From the logs that you have can you tell us the channel ids for both requests and the even loop names?
i.e.
... [reactor-http-nio-3] ... - [id: 0x9bd2b9b0, ...] ...
Request 1: ... [or-http-epoll-2] ... - [id: 0x4840d836, ...] ...
Request 2: ... [or-http-epoll-1] ... - [id: 0x50755c4a, ...] ...
Also can you add here your pipeline configuration? For this you do not need to execute the scenario that is failing, just run one request and from the logs extract the following:
... [reactor-http-nio-3] ... - [id: 0x9bd2b9b0] Initialized pipeline DefaultChannelPipeline{(reactor.left.loggingHandler = io.netty.handler.logging.LoggingHandler), (reactor.left.httpCodec = io.netty.han
We didn't have those logs enabled at the time. Here's the new log message we get using the latest dependency versions I mentioned in my previous message.
Initialized pipeline DefaultChannelPipeline{(reactor.left.sslHandler = io.netty.handler.ssl.SslHandler), (reactor.left.sslReader = reactor.netty.tcp.SslProvider$SslReadHandler), (reactor.left.httpCodec = io.netty.handler.codec.http.HttpServerCodec), (reactor.left.httpTrafficHandler = reactor.netty.http.server.HttpTrafficHandler), (reactor.right.reactiveBridge = reactor.netty.channel.ChannelOperationsHandler)}
But this is the server io.netty.handler.codec.http.HttpServerCodec. Did I understand wrong that the problem is with the client?
violetagg
on 27 Jan 2021
Nope, you understood correctly, I just pulled out the wrong log line. Sorry for the confusion. This one should be correct:
Initialized pipeline DefaultChannelPipeline{(reactor.left.sslHandler = io.netty.handler.ssl.SslHandler), (reactor.left.sslReader = reactor.netty.tcp.SslProvider$SslReadHandler), (reactor.left.httpCodec = io.netty.handler.codec.http.HttpClientCodec), (reactor.right.reactiveBridge = reactor.netty.channel.ChannelOperationsHandler)}
OK thanks
From the logs it appears that we have two different connections: id: 0x4840d836 and id: 0x50755c4a. The connections do not share one and the same SslHandler, every time when we establish a connection to the remote peer we add to the channel pipeline a new SslHandler instance.
If you can enable reactor.netty.tcp.ssl.client.debug this will add wire logger for the SSL traffic so that we can check what's coming out from the SslHandler and we can compare it with the tcp dump (I know that most probably it will not be possible :( )
violetagg
on 27 Jan 2021
I know that most probably it will not be possible :(
We did manage to gather the data, but it was somewhat tricky to do in our production environment, hence the delay in my response. :)
we can check what's coming out from the SslHandler and we can compare it with the tcp dump
After adding the wire logger and performing a tcpdump in parallel, the encrypted bytes logged by Java for a request that got a 400 error back are identical to the TCP payloads captured by the tcpdump.
PyvesB
on 29 Jan 2021
@PyvesB just if you are able to confirm... Do you see for these two connections log similar to the one below (eventually in the logs)
... [reactor-http-nio-2] DEBUG reactor.netty.tcp.SslProvider - [id: 0xf956eac5] SSL enabled using engine ...
also do you use JDK or OpenSsl as SslProvider
violetagg
on 29 Jan 2021
@PyvesB just if you are able to confirm... Do you see for these two connections log similar to the one below (eventually in the logs)
... [reactor-http-nio-2] DEBUG reactor.netty.tcp.SslProvider - [id: 0xf956eac5] SSL enabled using engine ...
Yep, I can see them, SSL enabled using engine SSLEngineImpl and SNI *** for the different connections.
also do you use JDK or OpenSsl as SslProvider
How can I tell for sure? Worth noting that we haven't overridden reactor-netty defaults in this area.
PyvesB
on 29 Jan 2021
Related issues
 philwebb
·
3Comments
philwebb
·
3Comments
 izeye
·
3Comments
izeye
·
3Comments
 eugene-sadovsky
·
8Comments
eugene-sadovsky
·
8Comments
 dsyer
·
8Comments
dsyer
·
8Comments
 anh-dev
·
3Comments
anh-dev
·
3Comments