Reaction: [1.12.0+] Setting breakpoints in server code doesn't work as expected
Issue Description
Unfortunately on release-1.13.0 branch, server debugging seems to be off. I put breakpoints on a specific line and the debugger stops on another. We used to have that issue in the past in some previous version as well.
Steps to Reproduce
- Put a breakpoint anywhere server side
- Do an action or call a method that would trigger that part of the code you set the breakpoint
- See whether it actually stops on the correct line you've putted the breakpoint
Possible Solution
Versions
Node: 10.2.1
NPM: 6.1.0
Meteor Node: 8.11.2
Meteor NPM: 5.10.0
Reaction CLI: 0.29.0
Reaction: 1.13.0
 stevaras
All 22 comments
@stevaras Are there any additional plugins that you're using when seeing this behavior or will a fresh clone of the release-1.13.0 branch cause this behavior?
Will you highlight some examples of specific lines that the debugger is failing to stop on?
 spencern
on 18 Jun 2018
spencern
on 18 Jun 2018
Could this issue be related https://github.com/meteor/meteor/issues/9275?
spencern
on 18 Jun 2018
@stevaras I'm unable to reproduce this issue.
Added a breakpoint here:
https://github.com/reactioncommerce/reaction/blob/release-1.13.0/imports/plugins/core/catalog/server/methods/catalog.js#L964
Then changed the vendor name of a product from the operator view of the PDP. Using the vscode debugger, the execution of the code stopped as expected.
spencern
on 18 Jun 2018
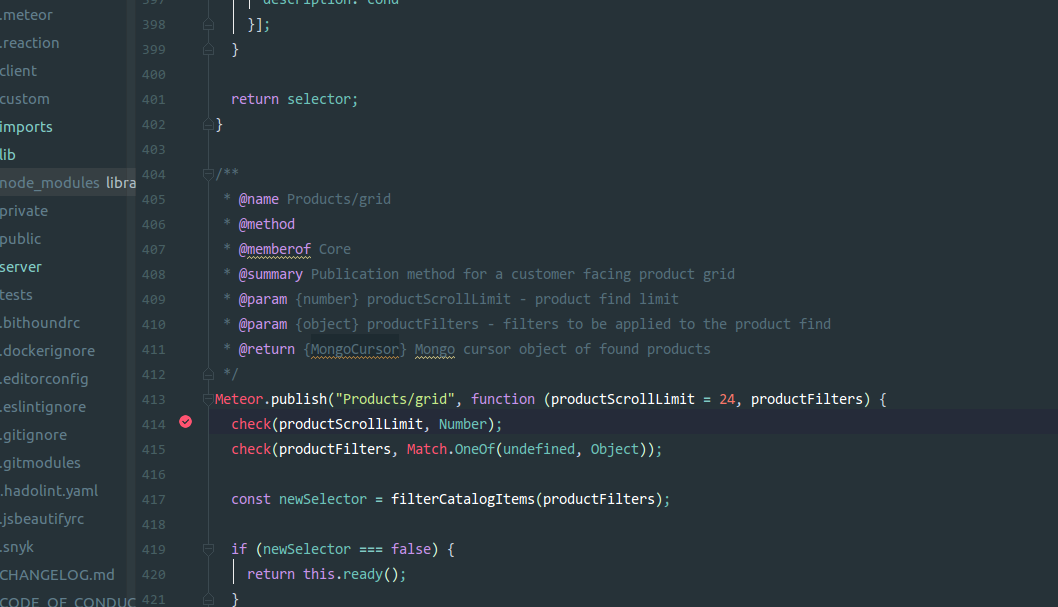
@spencern I was able to reproduce it on Webstorm 2017.3(linux) & 2018.1.5(linux - current) .
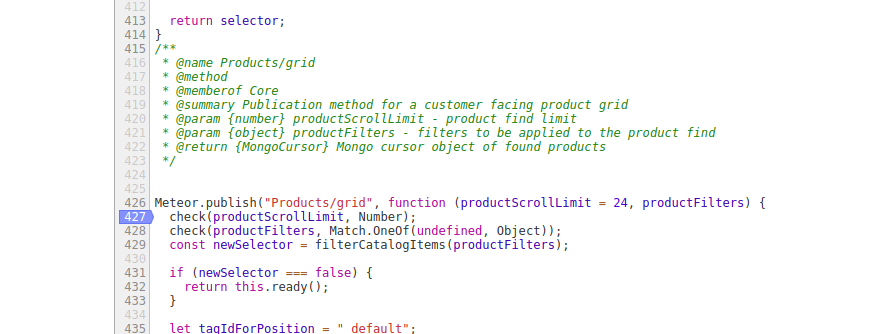
I Added a breakpoint at line 414 . However WebStorm debugger stopped at line 370
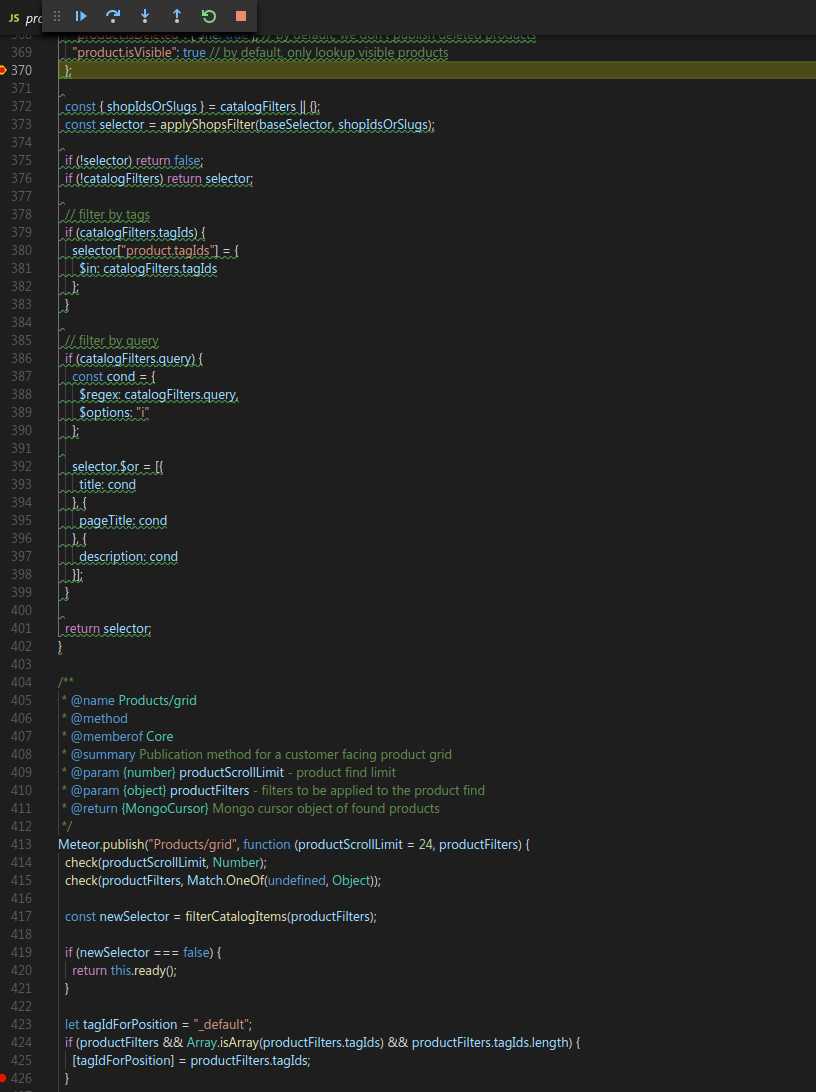
Then I added a breakpoint at the same line in Chrome's(v66) node debugger. Execution of code didn't stop at all there. Another weird thing is that the same code showed up in line 427 instead of 414, in Chrome.
Webstorm
Chrome
 prosf
on 18 Jun 2018
prosf
on 18 Jun 2018
are you certain that line of code is executing?
spencern
on 18 Jun 2018
Yes absolutely ! I'm visiting localost/ with the default db.
I just tried latest version of vs code(1.24.1 - linux):
I was not able to put a breakpoint in line 414. So I tried at 417 ,but the red bullet showed-up on 426.
While the breakpoint was visible in 426 I visited localhost and again the execution point showed-up in line 370:
After giving a glance at https://github.com/meteor/meteor/issues/8611 I did rm -rf ~/.babel-cache but this didn't help at all
Here is my reaction -v
Node: 8.9.4
NPM: 6.0.1
Meteor Node: 8.11.2
Meteor NPM: 5.10.0
Reaction CLI: 0.29.0
Reaction: 1.13.0
Reaction branch: release-1.13.0
prosf
on 18 Jun 2018
@prosf I see the same issue putting a breakpoint on the lines you specified. I don't think that this is a Reaction issue, but it does appear to be an issue in Meteor and/or V8.
Can you specify which version of Reaction this last worked in? Is it 1.12 or a previous version?
Related Meteor issues to follow: https://github.com/meteor/meteor/issues/9875 or meteor/meteor#9275
I haven't tested any specific workarounds, though setting a breakpoint above or below the desired location and stepping though may work as suggested in one of those Meteor issues. There is an active PR in the chromium V8 tracker that may be worth following: https://chromium-review.googlesource.com/c/v8/v8/+/833260
I'd like to close this issue with your permission unless you're certain this is a bug specific to Reaction.
spencern
on 18 Jun 2018
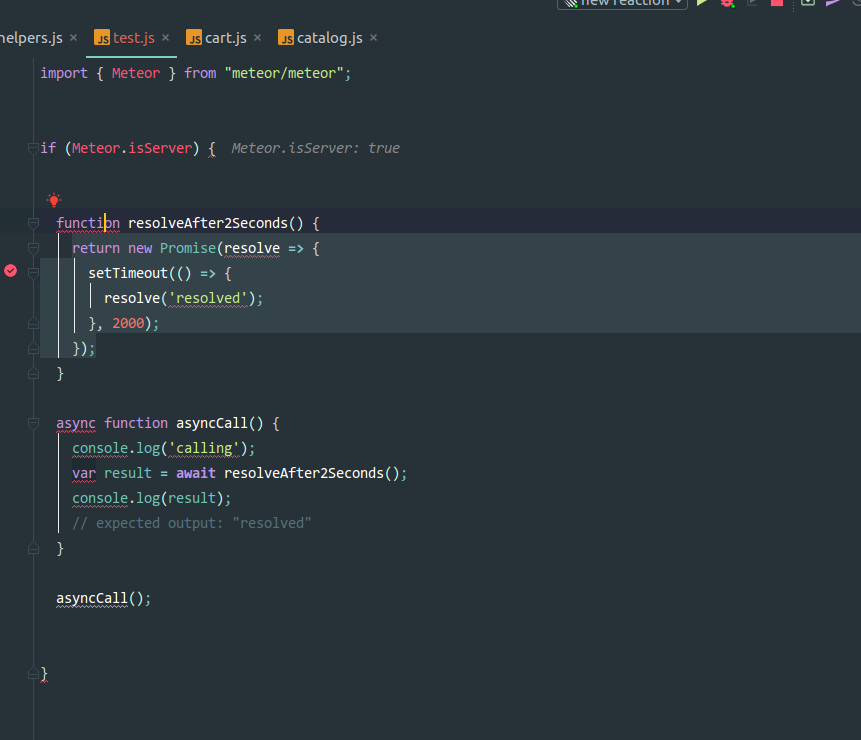
@spencern I did a test ,that probably implies that is more of a Reaction specific(or the specific babel setup maybe?), bug:
I created a bare app with [email protected] using meteor create --bare .
There I threw a test.js in root with some server side code . I put a breakpoint in line 9 and the debugger paused there properly
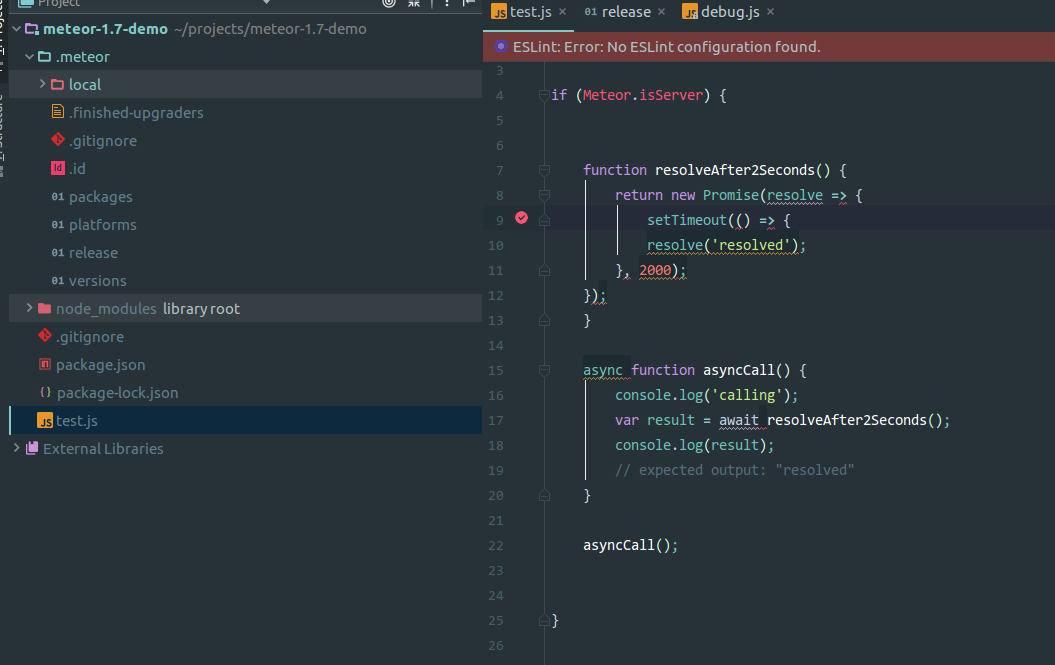
Then I did the same test in release-1.13.0 , there the debugger paused on a wrong line (7):
prosf
on 19 Jun 2018
@prosf Do you know the most recent version of Reaction that this worked for you?
spencern
on 19 Jun 2018
@spencern I can see the same problem in the current master(1.12). The last version without this problem was 1.11 which had [email protected]
prosf
on 19 Jun 2018
Interesting. I'm still not sure how any core Reaction change could have caused this, but we have bumped beta versions for Babel 7 since then, not sure what else might have changed. If you're able to isolate or narrow the problem down any more that would be helpful. As of now I'm not really sure where to start.
spencern
on 19 Jun 2018
Okay .If I 'll have any news ,I ll post back.
prosf
on 19 Jun 2018
Thanks for reporting this, it is something that I'd like to see working.
spencern
on 19 Jun 2018
I am having similar problems, the current line(the get's highlighted) on UI is not actually where the control is. So it looks like the debugger is jumping between random positions.
Editor - VSC
 Akarshit
on 21 Jun 2018
Akarshit
on 21 Jun 2018
+1
 lcampanis
on 21 Jun 2018
lcampanis
on 21 Jun 2018
This seems to be impacting a number of people and I'd like to be able to get it resolved. In order to do that we need to drill into what could have caused this a little more specifically.
@prosf has indicated that this issue exists in both 1.12 and 1.13.
I'm curious if there were any significant changes to node, babel, or other dependencies that could have caused this type of behavior.
spencern
on 22 Jun 2018
When using chrome, try using https://chrome.google.com/webstore/detail/nodejs-v8-inspector-manag/gnhhdgbaldcilmgcpfddgdbkhjohddkj
 veered
on 6 Jul 2018
veered
on 6 Jul 2018
Thanks @veered
spencern
on 9 Jul 2018
@lcampanis Does the workaround suggested in https://github.com/meteor/meteor/issues/9875#issuecomment-394535661 work for you?
spencern
on 9 Jul 2018
@spencern it doesn't. Debugging is still a massive issue and don't see any progress on Meteor's side either. So somewhere between Webstorm, Node and Meteor debugging is broken.
lcampanis
on 2 Aug 2018
Yep, still an issue in meteor 1.7 -- debugger; works, setting breakpoints in UI doesn't.
 RealHandy
on 15 Aug 2018
RealHandy
on 15 Aug 2018
We'll try again in Meteor 1.8 🤞
spencern
on 15 Sep 2018
Related issues
 coooolers
·
4Comments
coooolers
·
4Comments
 focusaurus
·
4Comments
focusaurus
·
4Comments
 janus-reith
·
4Comments
janus-reith
·
4Comments
 ticean
·
4Comments
ticean
·
4Comments
 nnnnat
·
4Comments
nnnnat
·
4Comments