React: DevTools crashes (`levelChildren` is undefined) when selecting a component in Flamegraph view
Do you want to request a feature or report a bug?
Bug
What is the current behavior?
React DevTools crashes in the code below because levelChildren is undefined.
callstack is:
backend.js:formatted:6593 Uncaught TypeError: Cannot read property 'push' of undefined
    at S (backend.js:formatted:6593)
    at _ (backend.js:formatted:6638)
    at inspectHooksOfFiber (backend.js:formatted:6682)
    at rt (backend.js:formatted:2372)
    at Object.inspectElement (backend.js:formatted:2753)
    at t.<anonymous> (backend.js:formatted:3484)
    at t.r.emit (backend.js:formatted:978)
    at backend.js:formatted:7407
    at t (backend.js:formatted:4954)
I haven't been able to reproduce this yet outside my app, but here's the steps that trigger the crash in my app:
1) open dev tools
2) start profiling
3) stop profiling
4) select the CalendarMiddle component in the Flamegraph view
5) crash!
What is the expected behavior?
no crash
Which versions of React, and which browser / OS are affected by this issue? Did this work in previous versions of React?
I'm running:
- React 16.12
- RDT 4.2.1 (11/27/2019) revision 3816ae7c3
- Chrome 79.0.3945.88 (Official Build) (64-bit)
- MacOS Catalina 10.15.2 (19C57)
I've never seen this crash before today. Interestingly, the crash only happens when I select some components in the flamegraph, but doesn't happen when I select other components. I haven't figured out the pattern yet of which components will trigger a crash.
I know that this repro isn't particularly actionable at this point, but I'm hoping that someone who knows the RDT code better than I do might have an idea about why this might be happening.
 justingrant
All 18 comments
metoo
 jansedlon
on 20 Dec 2019
jansedlon
on 20 Dec 2019
I've never seen this particular bug when using the Profiler, so I think some repro case would be helpful.
 bvaughn
on 20 Dec 2019
bvaughn
on 20 Dec 2019
@bvaughn This is happening also in Components tab. I scratched my head for two days for why is this happening
jansedlon
on 20 Dec 2019
@jansedlon Could you give me a repro case? I inspect a lot of components with hooks and I haven't seen this.
Maybe something about the specific version of React you're using, or your specific app..
bvaughn
on 20 Dec 2019
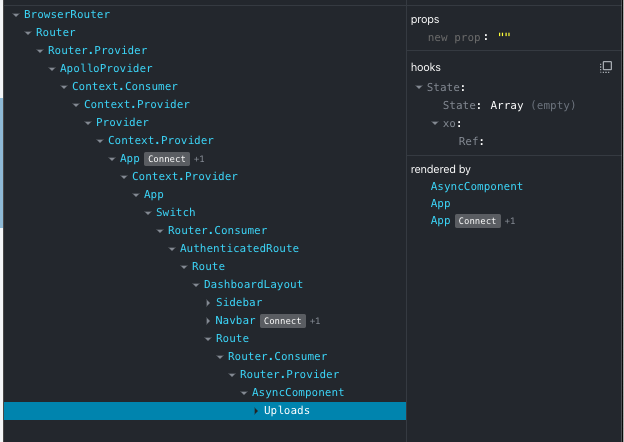
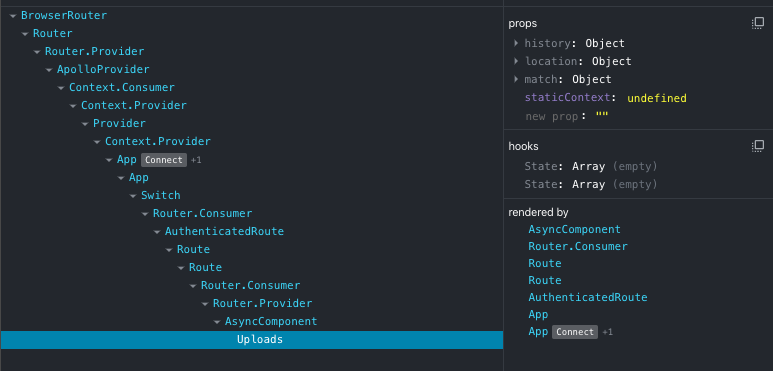
@bvaughn I'm not able to reproduce it in any way /facepalm/. However I've tried to make an almost same component hierarchy and I noticed a few differences.
In the first screen is a component that throws this devtools error. What's interesting about it is it does not have a router props as well as that nested hook state is really weird. If you look at the second screen, there's a completely new project with (almost) same structure, but it does have a router props and normally looking state hooks. Does this help?
jansedlon
on 20 Dec 2019
Does this help?
Nope :smile: Not really, but thanks all the same.
Props shouldn't be related in any way.
The "weird" looking hooks is probably because react-debug-tools is seeing your xo function as a custom hook (even though it doesn't follow the naming convention).
bvaughn
on 20 Dec 2019
Yea, well, there's no function called xo, I had to delete 95% of the code to make it run. The Uploads component now contains only one useState and some JSX.
The devtools errors is thrown also in Navbar, App and Provider components. Provider is seventh component from the top which is not event a start of my code.
It's really weird..
jansedlon
on 20 Dec 2019
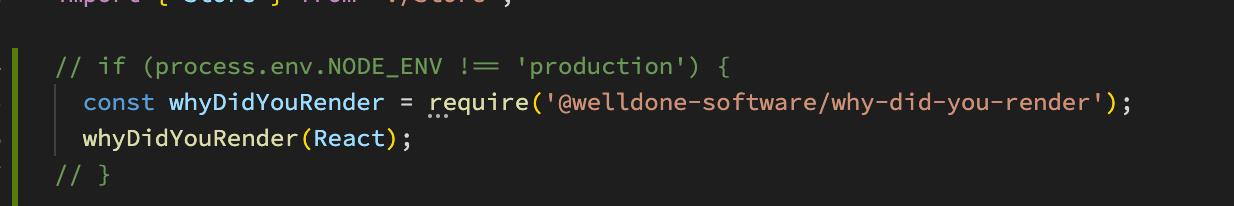
Haha.. Solved..
why-did-you-render causes this error.
jansedlon
on 20 Dec 2019
Yea, well, there's no function called
xo
The logic fo this is here. In particular, this is the function that decides what the "custom hook" function name is:
https://github.com/facebook/react/blob/3e09677836df6272472e3049b04a94b55fb6577b/packages/react-debug-tools/src/ReactDebugHooks.js#L408-L420
So that makes me think there's either an xo function or a usexo function in the app code you're referring to.
I had to delete 95% of the code to make it run. The Uploads component now contains only one useState and some JSX.
That's probably accurate for the second screenshot, which just shows two state hooks with arrays. The one up top though looks to have a different hooks usage? Either that, or DevTools has a bug :smile: It's hard to say without seeing it though.
why-did-you-rendercauses this error.
Oh, good to know!
bvaughn
on 20 Dec 2019
Anyway, thanks for your help! 😄 This issue will be discussed further in why-did-you-render repo.
jansedlon
on 20 Dec 2019
Thanks for the follow up info.
@justingrant Could why-did-you-update be the cause of the problem you reported as well?
bvaughn
on 20 Dec 2019
@bvaughn - yep, I'm also using why-did-you-render, so I think we can safely assume that it's the culprit here. Interestingly, I only started seeing this crash yesterday even though I've been using why-did-you-render for a while. why-did-you-render had a recent release so I tried reverting to a version that I was using before, but the crash still happens which surprised me. I assume this means that I did something different in my own code that exposed the bug, or there's some other change in another dependency that triggered the problem.
@jansedlon - I'll add more details over in https://github.com/welldone-software/why-did-you-render/issues/77
justingrant
on 20 Dec 2019
Cool, thanks for the update!
I'll leave this issue open for now too until we can track down the cause. Please keep me posted.
bvaughn
on 20 Dec 2019
@bvaughn - Will do. Two quick questions:
1) when DevTools renders function components to inspect hooks, will it render them twice if the component is inside <StrictMode>? I'm asking because why-did-you-render has a simplistic way of dealing with StrictMode: it ignores every other render for StrictMode components. If double-rendering doesn't happen twice when DevTools does it, then I can definitely see how it could cause problems with why-did-you-render. That's not the only problem happening here because this crash also happens without StrictMode, but I'd like to also fix StrictMode + why-did-you-render + DevTools while we're at it.
2) Is there a way to detect that a currently-executing render is a "DevTools render" as opposed to a normal render by React? I know that this difference shouldn't matter because render-phase code should never have side effects, but I can definitely see how libraries like why-did-you-render might want to know. Also, I can see how userland code (e.g. logging to a logfile or other custom logging that doesn't go through console) might want to behave differently when being fake-rendered by DevTools.
If any future readers of this issue are curious about what DevTools is doing with all this re-rendering, here's a link to the docs: https://github.com/facebook/react/blob/master/packages/react-devtools/OVERVIEW.md#inspecting-hooks
justingrant
on 21 Dec 2019
There wouldn't be value in DevTools double rendering. It renders once:
https://github.com/facebook/react/blob/85d9655d6f72fc34b71b6b25b1f76a307db81c96/packages/react-debug-tools/src/ReactDebugHooks.js#L577-L597No. It shouldn't matter and it's not meant to be detectable (though you _could_ detect if if you really wanted to). Render methods shouldn't have side effects- console logging being kind of an odd exception, but DevTools accounts for this explicitly:
https://github.com/facebook/react/blob/85d9655d6f72fc34b71b6b25b1f76a307db81c96/packages/react-devtools-shared/src/backend/renderer.js#L2326-L2339
I'd like to caution against making external code too "smart" about what React is doing with internal/implementation details like this because they may change between versions without warning.
bvaughn
on 21 Dec 2019
Hi @bvaughn - I'm copying below a 14-line repro case for this crash that I posted over in https://github.com/welldone-software/why-did-you-render/issues/77
Even if this crash is caused by why-did-you-render, the crash callstack is all Dev Tools, which will probably make you an issue magnet next time some other package figures out a way to make devtools crash.
Is there an easy way for devtools to throw a friendlier exception message that ideally points the finger at the actual culprit? Even something generic could help, e.g. "_Hook state is corrupt. This is usually caused by code in your app (not React Dev Tools code) improperly patching or changing React's internal code and/or data._"
What do you think?
Anyway, here's the repro.
import React, { useState, useMemo } from "react";
import ReactDOM from "react-dom";

const whyDidYouRender = require("@welldone-software/why-did-you-render");
whyDidYouRender(React);

function Repro() {
  const [count] = useState(0);
  const obj = useMemo(() => ({ count }), [count]);
  return <div>count: {obj.count}</div>;
}

const App = () => <Repro />;
ReactDOM.render(<App />, document.getElementById("root"));
Repro Steps
git clone https://github.com/justingrant/repro-why-render-hooks(this is a just-created CRA app with non-essential files removed and only one dependency added:@welldone-sofwtare/why-did-you-render)cd repro-why-render-hooksnpm inpm start- open http://localhost:3000 in Chrome
- right-click + Inspect to open dev tools
- select the ⚛Profiler tab
- click the "Reload and start profiling" button (it looks like a little refresh icon)
- click on the
Reprocomponent in the Flamegraph view
Expected: no crash
Actual: crash! TypeError: Cannot read property 'push' of undefined inside React Dev Tools
justingrant
on 21 Dec 2019
fixed on version 3.5 of @welldone-software/why-did-you-render
 vzaidman
on 21 Dec 2019
vzaidman
on 21 Dec 2019
Thanks for the repro info.
Even if this crash is caused by
why-did-you-render, the crash callstack is all Dev Tools, which will probably make you an issue magnet next time some other package figures out a way to make devtools crash.
Perhaps! I think this is a pretty unique situation though. Hot-patching React APIs is not something we encourage because it can break things (like DevTools). It's hard to write code that can withstand parts of it being overridden in unexpected ways 😄I'll keep this in mind and reevaluate if it comes up again though!
Thanks for the follow up @justingrant and the quick fix @vzaidman! I'm going to close this issue because I don't think DevTools needs to make any changes at the moment in response to this issue.
bvaughn
on 21 Dec 2019
Related issues
 huxiaoqi567
·
3Comments
huxiaoqi567
·
3Comments
 hnordt
·
3Comments
hnordt
·
3Comments
 jmullo
·
3Comments
jmullo
·
3Comments
 zpao
·
3Comments
zpao
·
3Comments
 jvorcak
·
3Comments
jvorcak
·
3Comments
Most helpful comment
Thanks for the repro info.
Perhaps! I think this is a pretty unique situation though. Hot-patching React APIs is not something we encourage because it can break things (like DevTools). It's hard to write code that can withstand parts of it being overridden in unexpected ways 😄I'll keep this in mind and reevaluate if it comes up again though!
Thanks for the follow up @justingrant and the quick fix @vzaidman! I'm going to close this issue because I don't think DevTools needs to make any changes at the moment in response to this issue.