React: [Dev Tools] Chrome component console errors get output from "backend.js"
Do you want to request a feature or report a bug?
Bug
What is the current behavior?
When I get a component stack trace, the log trace comes from the dev tools extension:

What is the expected behavior?
I use that trace usually to click and set a debugger so I can debug some React internals.
 natew
natew
All 7 comments
Click on the message and the arrow on the left should expand. It gives you the JS stack.
 gaearon
on 4 Sep 2019
gaearon
on 4 Sep 2019
Yea, just wondered if this was intentional or avoidable, I believe without extension you get that two steps faster. Not a big one.
natew
on 4 Sep 2019
This is how DevTools injects "component stacks" for errors and warnings. (Check out the "Component Stacks" blurb from the changelog.)
Component stacks
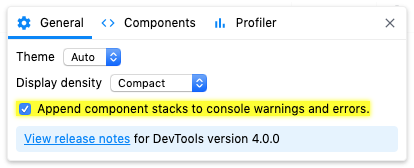
React component authors have often requested a way to log warnings that include the React "component stack". DevTools now provides an option to automatically append this information to warnings (console.warn) and errors (console.error).

It can be disabled in the general settings panel:
You can turn this off in Settings if the override is getting in the way :smile: I understand the reported location is kind of an annoying quirk.
We've started a dialog about ways that we could perhaps implement this sort of functionality in a less invasive way but the conversation is ongoing: https://github.com/whatwg/console/issues/163
I'm going to close this issue since it's a question and it's been answered. Happy to keep talking though if there's follow up.
 bvaughn
on 4 Sep 2019
bvaughn
on 4 Sep 2019
Missed that, thanks!
natew
on 4 Sep 2019
This also has the very nasty side effect of causing the Chrome dev tools to hang if you try to put in a breakpoint to find out where exactly this error comes from, because the backend.js is (now?) minified 😢
Maybe include source maps for backend.js if the console stack traces are going to get hijacked?
 vdh
on 24 Mar 2020
vdh
on 24 Mar 2020
I'm not sure I understand - backend.js has always been minified.
Either way, a minified JavaScript file should not cause Chrome to hang on a breakpoint.
bvaughn
on 24 Mar 2020
@bvaughn It does if for example you put a breakpoint on line 6 and that minified line contains the entire contents of the file.
It's a known issue with Chrome: https://bugs.chromium.org/p/chromium/issues/detail?id=593679
Normally it can be avoided by not attempting to debug minified code, but that's hard when this code injects into the stack trace.
vdh
on 25 Mar 2020
Related issues
 tleunen
·
3Comments
tleunen
·
3Comments
 zpao
·
3Comments
zpao
·
3Comments
zpao
·
3Comments
zpao
·
3Comments
 jimfb
·
3Comments
jimfb
·
3Comments
 hnordt
·
3Comments
hnordt
·
3Comments
Most helpful comment
This is how DevTools injects "component stacks" for errors and warnings. (Check out the "Component Stacks" blurb from the changelog.)
Component stacks
React component authors have often requested a way to log warnings that include the React "component stack". DevTools now provides an option to automatically append this information to warnings (
console.warn) and errors (console.error).It can be disabled in the general settings panel:
You can turn this off in Settings if the override is getting in the way :smile: I understand the reported location is kind of an annoying quirk.
We've started a dialog about ways that we could perhaps implement this sort of functionality in a less invasive way but the conversation is ongoing: https://github.com/whatwg/console/issues/163
I'm going to close this issue since it's a question and it's been answered. Happy to keep talking though if there's follow up.