React: React Devtools perf issue with 16.7.0
Do you want to request a feature or report a bug?
Bug
What is the current behavior?
When using a component that creates new Date objects inside an interval while having the Devtools extension open, the performance are really slow.
With React 16.4.1, I don't have the same issue so it might be related to the Profiler tab (even if it also happen when being on the Elements tab).
Reproduction:
16.7.0 version with performance issues: https://codesandbox.io/s/w6zrvx1y98
16.4.1 version without perf issues: https://codesandbox.io/s/4x4jmx8zx4
Open the devtools on the standalone page (https://w6zrvx1y98.codesandbox.io) while watching the Chrome task manager and you will see the memory go up quickly and the CPU be higher than 100%.
You might want to adjust the ARRAY_SIZE and INTERVAL constants based on your computer performance.
What is the expected behavior?
The page should not slow down that much. In my app, I display a list of 30 lines where each of them contains this component and the refresh rate is one second (the time change there). There was no issue at all with React 16.4.1 (I actually didn't know that this component existed 😄).
Which versions of React, and which browser / OS are affected by this issue? Did this work in previous versions of React?
16.7.0 is affected while 16.4.1. I also had the same issue with 16.6.0 and I thought it was related to #14365 but it is actually a different one.
By the way, I'd be happy to make a PR for this if this makes sense. 🙂
 ValentinH
All 18 comments
By the way, I'd be happy to make a PR for this if this makes sense. 🙂
If you know what's causing it, sure!
 gaearon
on 8 Feb 2019
gaearon
on 8 Feb 2019
Haha unfortunately I have no idea but if I get point to some places where I could investigate, I'd be happy to help here :)
ValentinH
on 8 Feb 2019
Did you try profiling it?
gaearon
on 8 Feb 2019
Do you mean profiling the app or React devtools itself?
ValentinH
on 8 Feb 2019
I don't know :-) Depends on where the slowdown is.
gaearon
on 8 Feb 2019
The slowdown seems to be in the devtools because I see it getting really high on CPU and memory. Of course, the app is rerendered many times due to the intervals, but it runs fine when devtools is not open.
ValentinH
on 8 Feb 2019
I mean that while slowdown may be caused _by_ the profiler mode (which is enabled when devtools is detected) it may still happen _inside_ React. Look at https://github.com/facebook/react/issues/14365 for an example.
gaearon
on 8 Feb 2019
Ok I'll try to investigate again on tomorrow. Thanks for the answers 🙂
ValentinH
on 8 Feb 2019
I've just profile the example I've shared above and here are the results:
With React 16.4.1

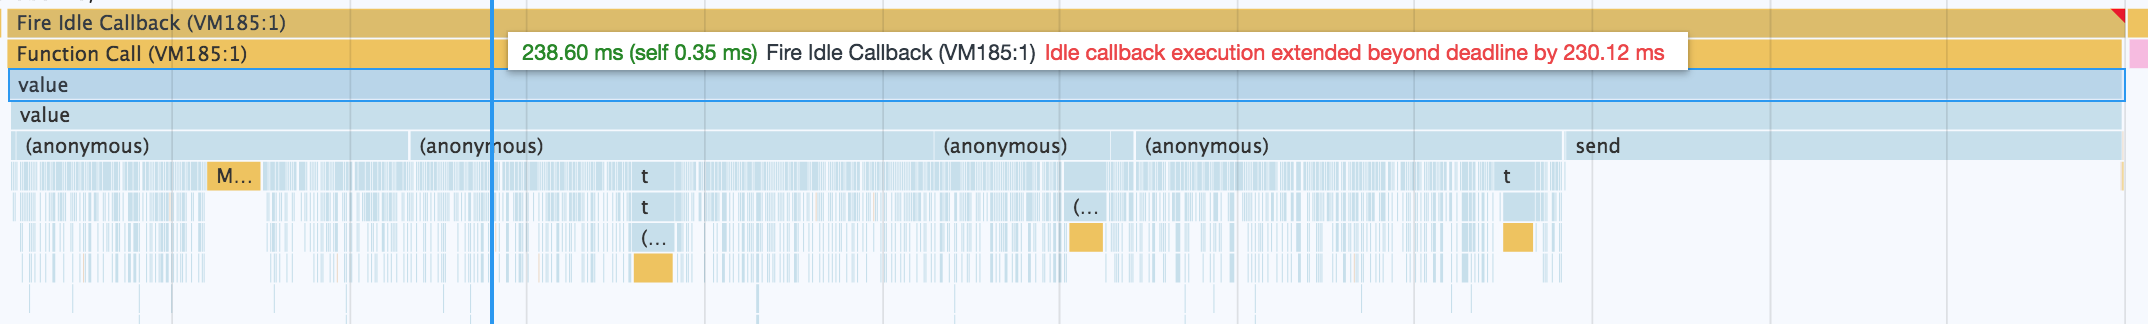
With React 16.7.0 (same with 16.8.1)

As you can see, with 16.7, there is some big chunks of function calls in the devtools extension, especially this one:
I'm installing the development version of Devtools so I can better understand what this function is doing.
ValentinH
on 9 Feb 2019
Thanks! That function flushes events from the bridge to DevTools I think.
gaearon
on 9 Feb 2019
Indeed, this is flushBufferWhileIdle():

What else can I do to investigate more?
ValentinH
on 9 Feb 2019
Figure out why it’s spending more time there? What is it doing that it doesn’t do otherwise?
gaearon
on 9 Feb 2019
I've dig more into this issue and here some more details:
The difference in flushBufferWhileIdle when devtools is used with or without profiler is the updateProfileTimes event.
Indeed, in both case, we have the update event being sent twice per rendered <DateCell /> (the one being rendered by setInterval()). Basically, it is called 2n with n being the number of <DateCell />.
However, updateProfileTimes is sent way more times per render. After looking carefully at them, I've noticed that the number of times when updateProfileTimes is called meet the following formula:
count = parents_count + (n-1) * (parents_count + n)
with:
- count: number of times
updateProfileTimesis called - parents_count: number of element above
<DateCell />including the root - n: number of
<DateCell />instances
Basically, for each interval, a updateProfileTimes is sent multiple times for the same element.
I'm wondering if all those events are really needed and also if they need to be sent when the profiler is not running.
ValentinH
on 9 Feb 2019
As a first improvement, I've submitted a PR on the Devtools side to stop sending the profiling data via the bridge when the devtools is profiling.
I don't know if this is a good idea but this is a first try.
Next, I'm still wondering if the amount of data generated for the profile is correct.
ValentinH
on 9 Feb 2019
So the dates were a red herring?
gaearon
on 9 Feb 2019
Indeed, I can even reproduce the issue by getting rid of them and just use plain numbers.
Given this very simple component:
class DateCell extends React.Component {
  state = {x: 1};

  componentDidMount() {
    this.interval = setInterval(this.updateRemainingSeconds, this.props.interval);
  }

  componentWillUnmount() {
    clearInterval(this.interval);
  }

  updateRemainingSeconds = () => {
    this.setState({x: 1});
  };

  render() {
    return <div>1</div>;
  }
}
If I render it 100 times and set the interval to 500ms, flushBufferWhileIdle takes up to 2s.
ValentinH
on 9 Feb 2019
This issue has been automatically marked as stale because it has not had recent activity. It will be closed if no further activity occurs. Thank you for your contribution.
![stale[bot] picture](https://avatars3.githubusercontent.com/in/1724?v=4&s=40) stale[bot]
on 10 Jan 2020
stale[bot]
on 10 Jan 2020
It does not happen anymore on the new devtool.
ValentinH
on 10 Jan 2020
Related issues
 kocokolo
·
3Comments
kocokolo
·
3Comments
 zpao
·
3Comments
zpao
·
3Comments
 krave1986
·
3Comments
zpao
·
3Comments
krave1986
·
3Comments
zpao
·
3Comments
 jimfb
·
3Comments
jimfb
·
3Comments
Most helpful comment
I've just profile the example I've shared above and here are the results:
With React 16.4.1
With React 16.7.0 (same with 16.8.1)
As you can see, with 16.7, there is some big chunks of function calls in the devtools extension, especially this one:

I'm installing the development version of Devtools so I can better understand what this function is doing.