Do you want to request a feature or report a bug?
bug
What is the current behavior?
Accumulating listeners after interacting with input elements and then un-mounting them. If the elements are not interacted with the listener is garbage collected correctly.
Here is a screenshot of the accumulation in a production build:

If the current behaviour is a bug, please provide the steps to reproduce and if possible a minimal demo of the problem. Your bug will get fixed much faster if we can run your code and it doesn't have dependencies other than React. Paste the link to your JSFiddle (https://jsfiddle.net/Luktwrdm/) or CodeSandbox (https://codesandbox.io/s/new) example below:
Use either of the following repros and follow the reproduction instructions in the comments/readme.
For convenience it is reproduced here:
https://codesandbox.io/s/317j2lz8l6
But it is better illustrated by pulling this repro as there is less going on:
https://github.com/hally9k/listener-leak-test
What is the expected behavior?
No accumulation of event listeners.
Which versions of React, and which browser / OS are affected by this issue? Did this work in previous versions of React?
[email protected]
[email protected]
[email protected]
[email protected]
 hally9k
All 26 comments
@hally9k Why are you doing this?
Puting
() => ({ edit: !this.state.edit })
inside setState()
The above happened because of this
https://reactjs.org/docs/faq-state.html#what-is-the-difference-between-passing-an-object-or-a-function-in-setstate
 whs-dot-hk
on 31 May 2018
whs-dot-hk
on 31 May 2018
Is this fix ok?
whs-dot-hk
on 31 May 2018
@whs-dot-hk I have changed the setState calls from:
() => ({ edit: !this.state.edit })
to:
prevState => ({ edit: !prevState.edit })
As I realise I shouldn't have been referencing this.state directly from the function.
Otherwise there isn't anything wrong with that piece of code as far as I can tell. My understanding is that if you want to reference the component's internal state in a setState call then a function must be used.
This is unsafe:
this.setState({
   edit: !this.state.edit
})
I pulled your changes and it doesn't stop the leak, there are instructions on the repo explaining how to reproduce the leak in chrome dev tools. Have a go at testing if your fix works and note the accumulation of listeners in the performance chart.
hally9k
on 31 May 2018
I had a first read of the source yesterday. I think I found where the event listeners are getting added but failed to find the code that tidies them up.
Here is where I assume the listeners for events that do not bubble up are added to elements. Apologies if I'm way off, first timer here. 😬
If anyone could help show me where these listeners are removed when the component is unmounted that would be awesome.
hally9k
on 31 May 2018
These event listeners aren't explicitly removed. GC will do that when nothing references the DOM element. If something keeps a reference then it sounds like a bug. Generally React is expected to clean up a reference to something that was deleted during the next update.
 gaearon
on 1 Jun 2018
gaearon
on 1 Jun 2018
@hally9k Want to look into what's holding onto the element?
gaearon
on 1 Jun 2018
@gaearon Sure I can have a look, would you mark this as a "Good beginner bug" though? I literally started reading the source yesterday. Either way I'll get stuck in and see how we go.
hally9k
on 1 Jun 2018
@hally9k Happy to help answer any questions there. Please don't hesitate to reach out!
 nhunzaker
on 1 Jun 2018
nhunzaker
on 1 Jun 2018
@hally9k are you profiling with any extensions enabled? I tried running your test app locally, and while I do see that the listener count increases over time, they do eventually get GC'd.
 aweary
on 1 Jun 2018
aweary
on 1 Jun 2018
The Performance tab is indicating that there's an increase in the Node count, even after GC, but I've taken a few heap snapshots and there's no clear indicator that DOM nodes aren't being cleaned up. The only positive delta is for things like (array)
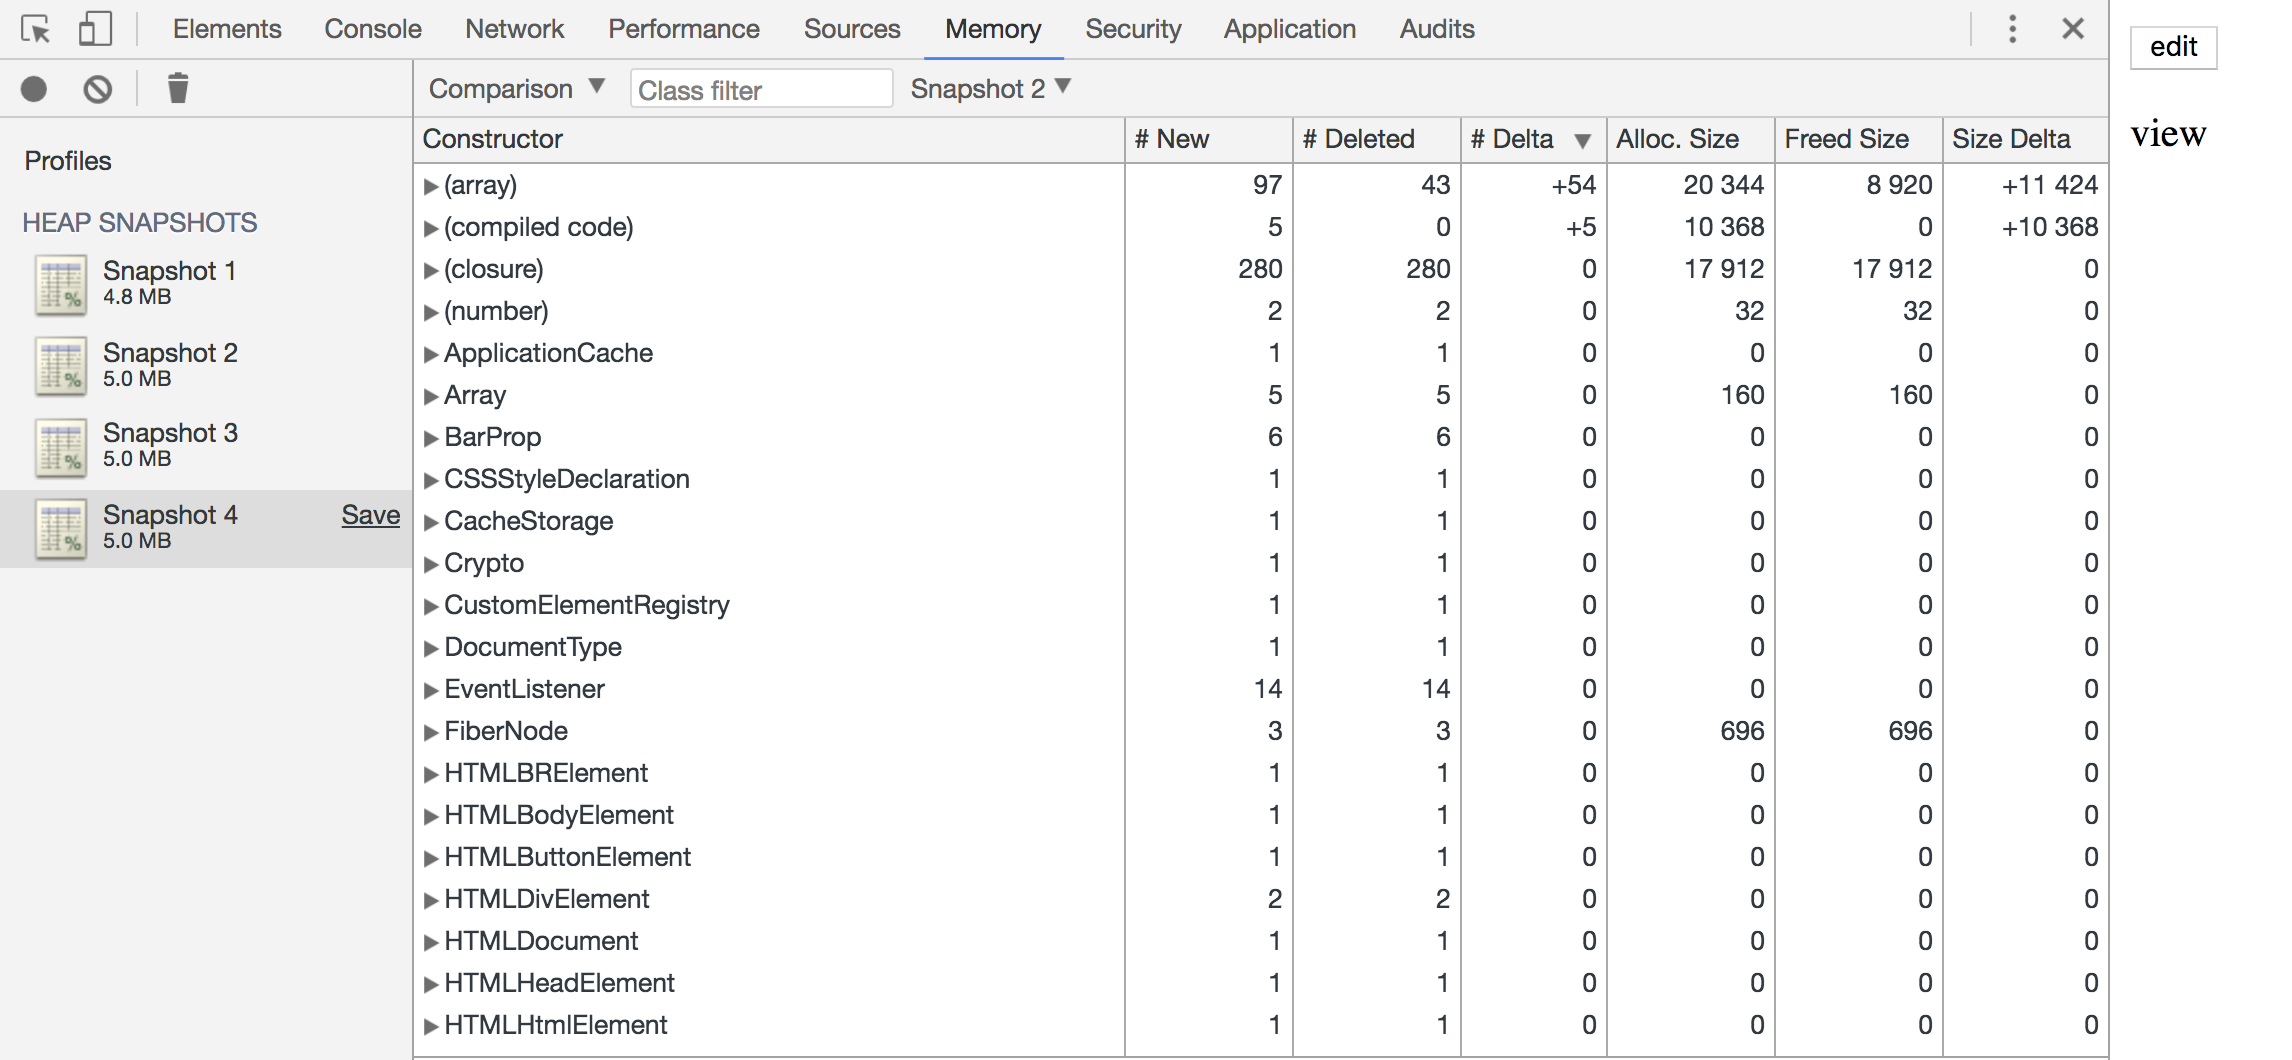
aweary
on 1 Jun 2018
I can see an Detached DOM tree when transitioning between states

this matches the count of new nodes recorded in performance tab.
I've updated my code to be a bit smaller:
{this.state.edit ? <b>lol</b> : <p>view</p>}
in order to eliminate any native listeners on input fields etc.
 BTMPL
on 1 Jun 2018
BTMPL
on 1 Jun 2018
I think a few detached nodes would be expected, since the Fiber may store a reference to the previous node for a short time. After the next update the node should be dereferenced though. I would expect a constant number of detached DOM nodes.
aweary
on 1 Jun 2018
Yeah, that looks to be the case. Multiple state changes after that and the delta between previous snapshot is the same (2).
The only change I see (that is meaningfull) is array and system.
Maybe it's an error in the Chrome profiller? Anyone checked with Firebug?
BTMPL
on 1 Jun 2018
@aweary I profiled in incognito, no extensions. Based on the screenshot you posted the listeners don't get GC’d and neither do the nodes - The yellow and green lines never drop back to their original positions. I'm relatively new to the performance tooling so please let me know if I'm interpreting this incorrectly. I had trouble accurately tracing the exact listeners and nodes in the heap snapshot comparison but it looked like the invalid listener that gets added directly to the <input />was the one that was leaking.
@BTMPL If you use elements that don’t have those listeners that are attached here...
...then, based on my testing, there are no listeners attached directly to the nodes themselves and there is no leak. I added a <form> around the <input /> and saw that the two listeners added here...
... increased the leak by 2 per iteration as expected and I could see those additional reset and submit listeners in the heap snapshot comparison. Again I'm no battle hardened perf guy so please let me know if I'm reading this wrong.
When running these tests I did multiple iterations to see if the nodes and listeners would be eventually cleaned up but based on tests doing 6-10 iterations they continued to accumulate.
Would anyone mind pointing me towards the piece of code that handles the node references, just out of interest. I read through the reconciler and scheduling of updates yesterday but still a little disoriented to be honest.
hally9k
on 2 Jun 2018
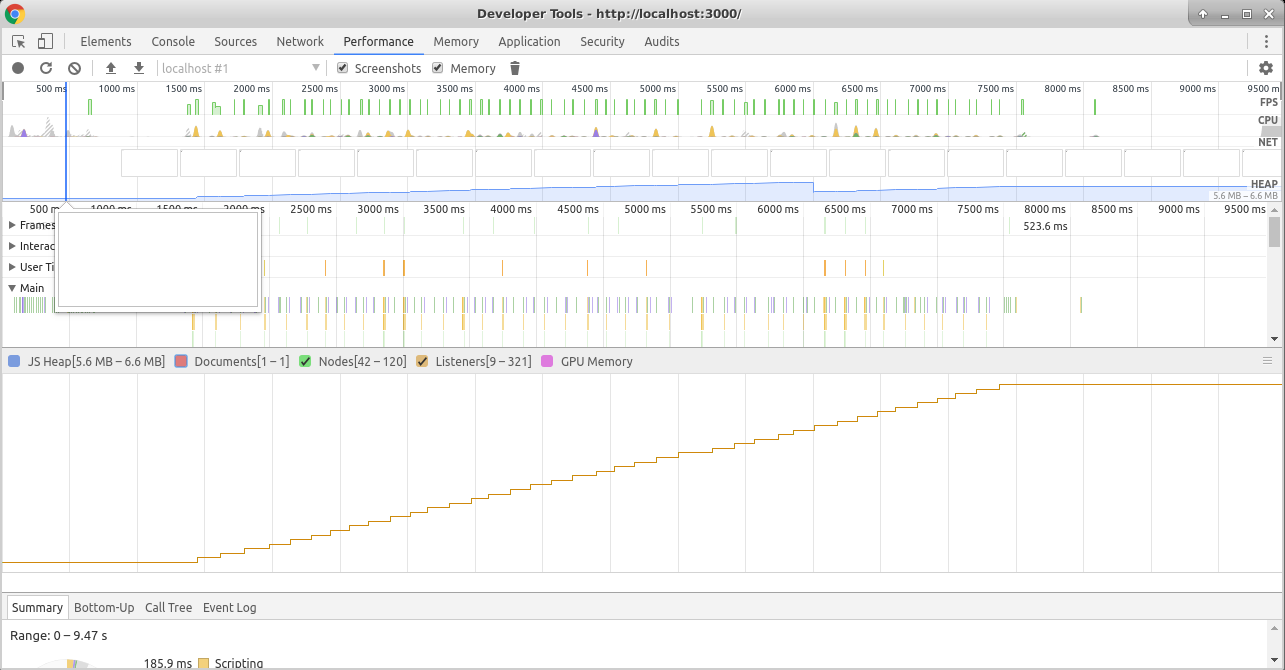
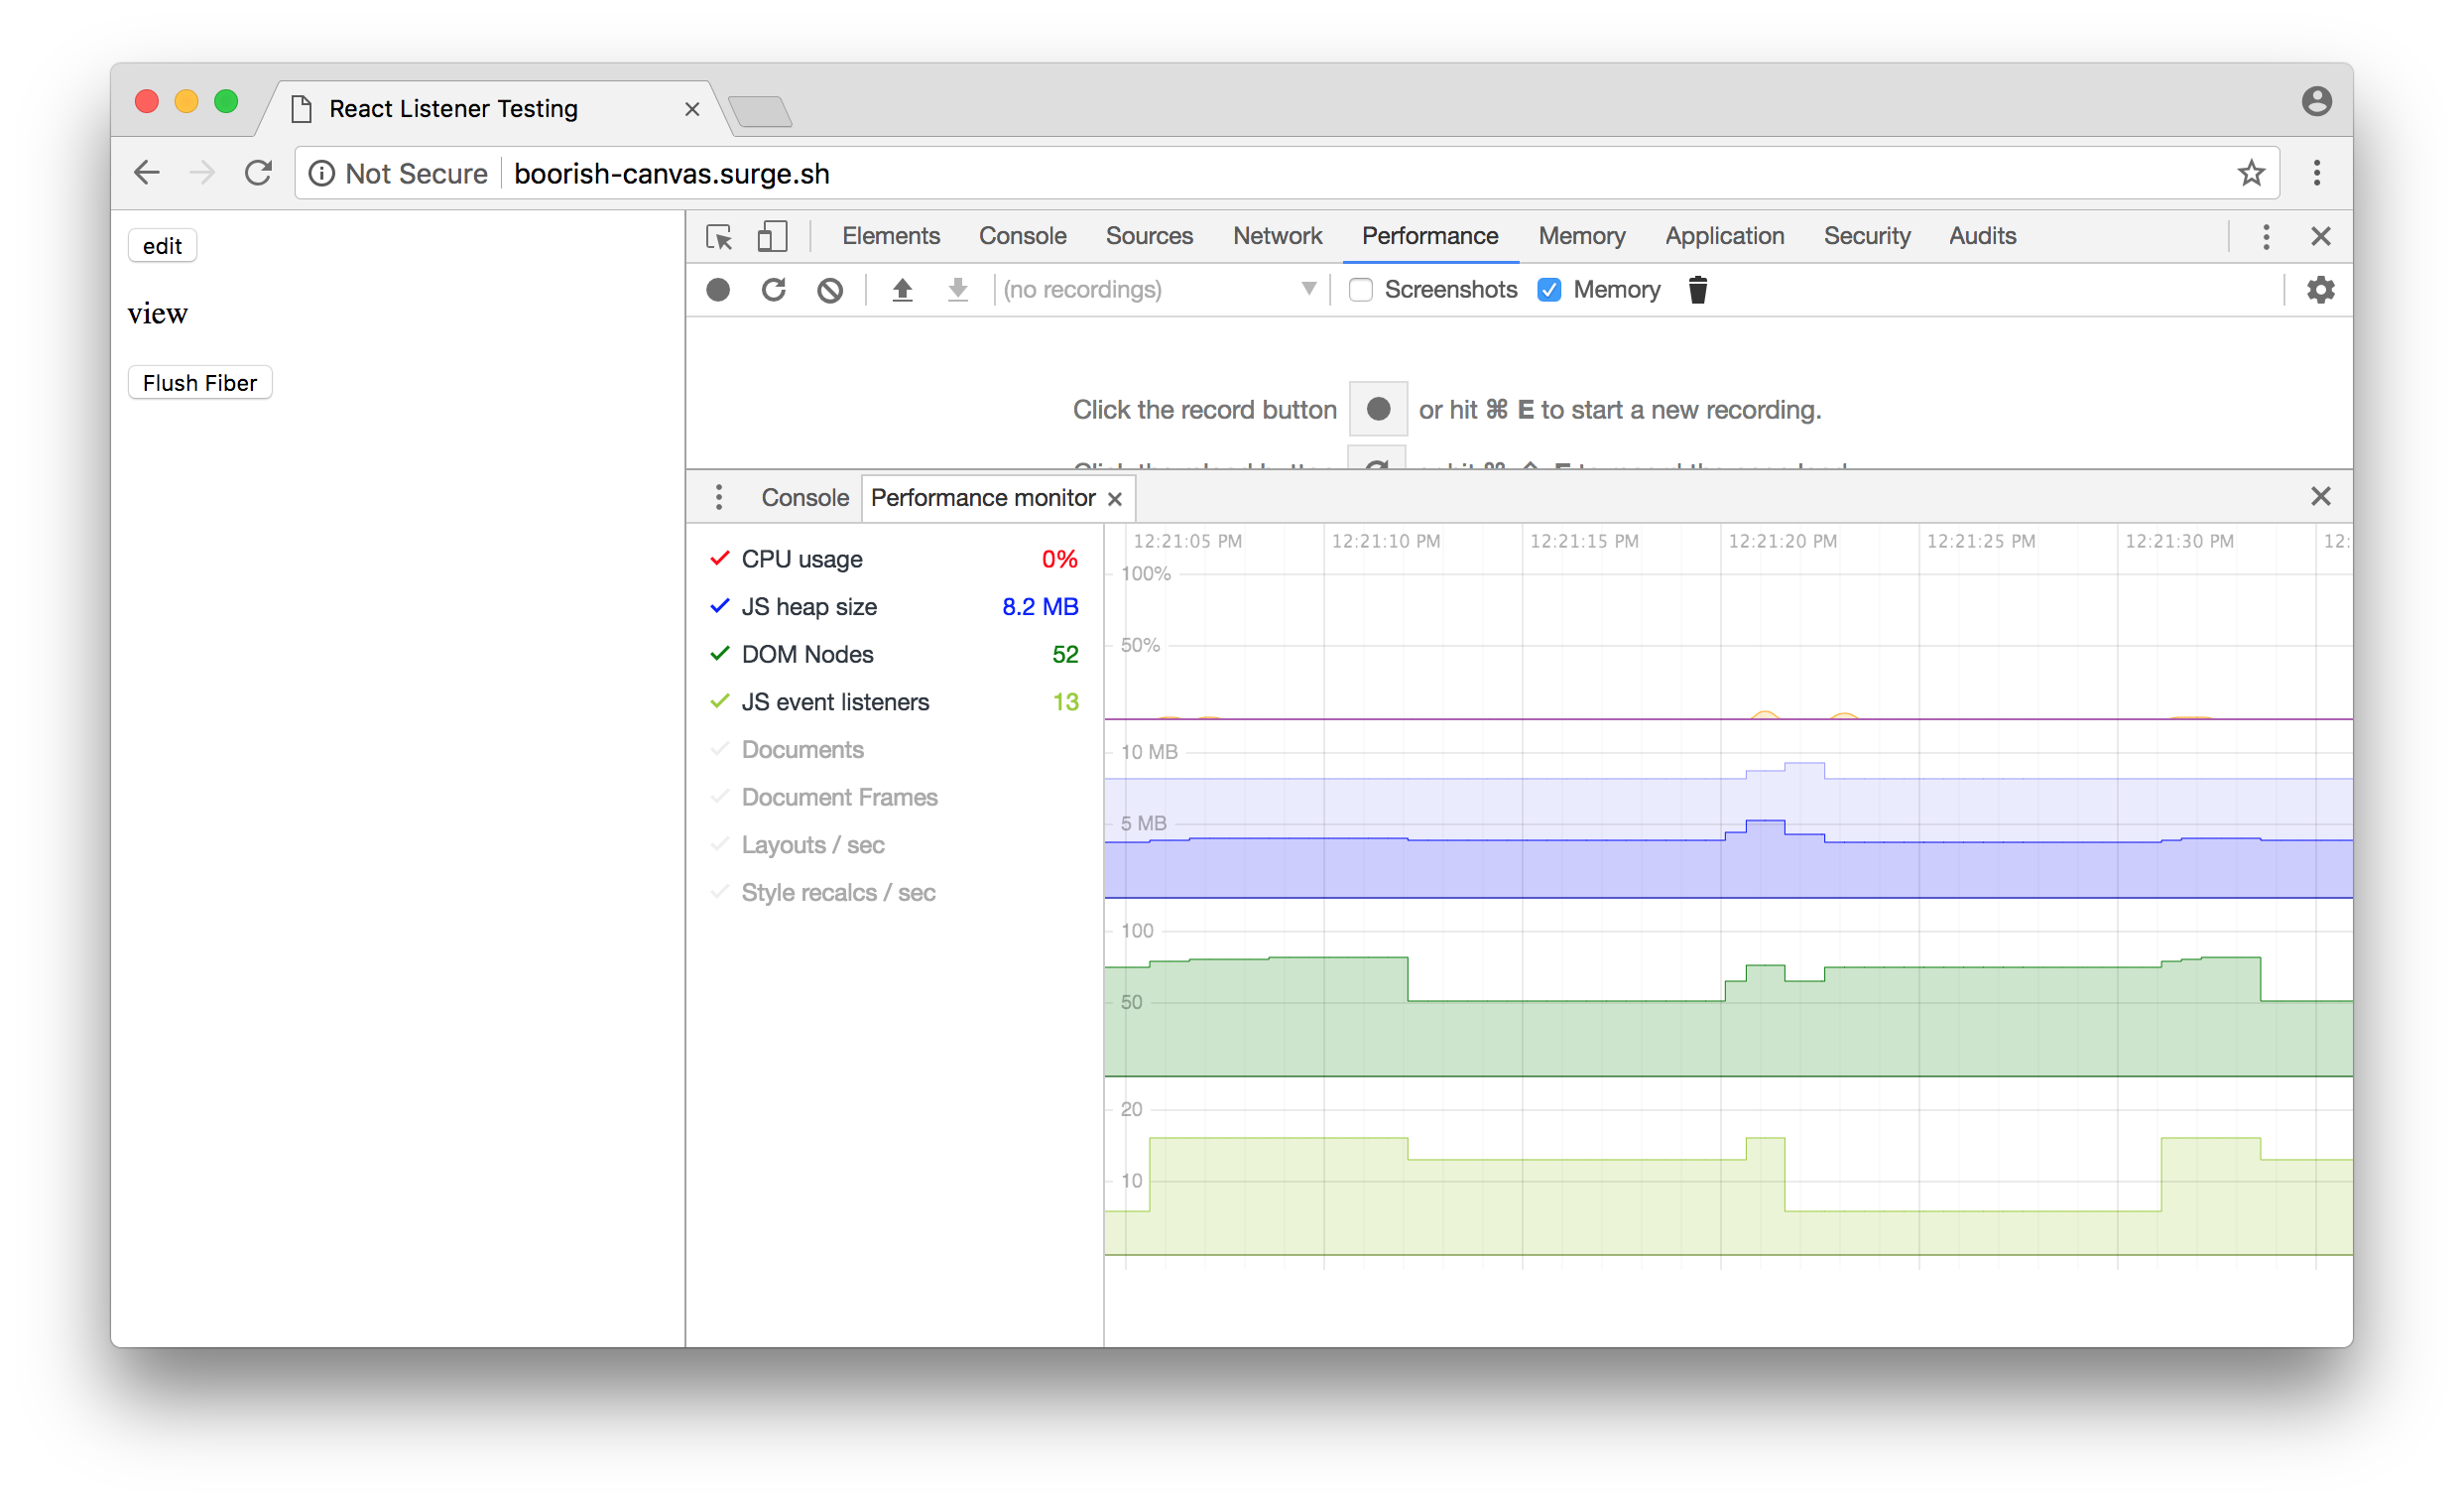
@hally9k alright, I did some more profiling using the production build of the test application you provided. Here's a profile from just clicking the edit button over and over, without interacting with the input element:
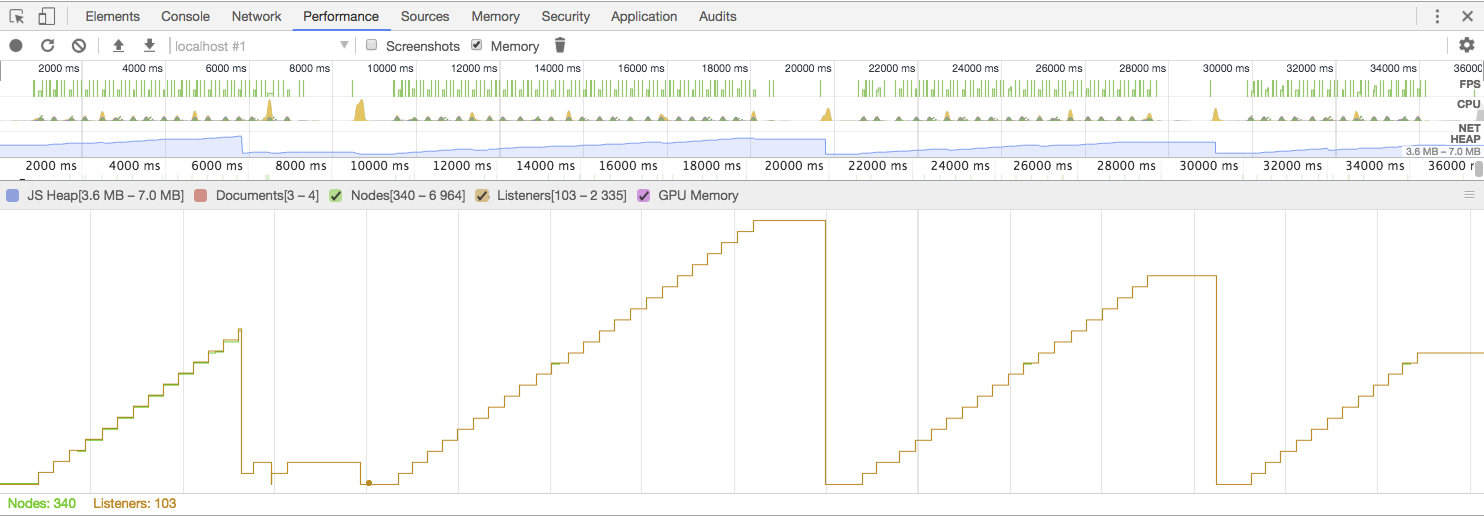
The valleys in the graph are from manually triggering a GC event. Each time, the total node/listener count returned to the same value. Here's a profile doing the same thing, except every time the input appears I typed in some content:

This appears to indicate that there is a leak related to the actual input event processing. This suggests that it's likely not related to the trapBubbledEvent calls, since those would be called regardless of whether the input was interacted with.
Somewhere in the event handling code path a reference is being retained to the DOM node causing it to not be GC'd.
aweary
on 2 Jun 2018
@hally9k Ok, but I'm seeing increase in both listeners and node count with my change (so transition from b to p):
(the two lines overlap perfectly, that's why only one is shown).
Manually triggering GC resets the node/listeners count.
BTMPL
on 2 Jun 2018
@aweary - oh awesome I’m not going crazy, yes this is exactly what I’m getting my end, only when focusing on the input during each iteration are the listeners getting leaked. I’ll have another look at the event handling code shortly and try and track down where the reference to the node might be being held.
hally9k
on 2 Jun 2018
Ooops, didn't mean to close this, reopening.
hally9k
on 2 Jun 2018
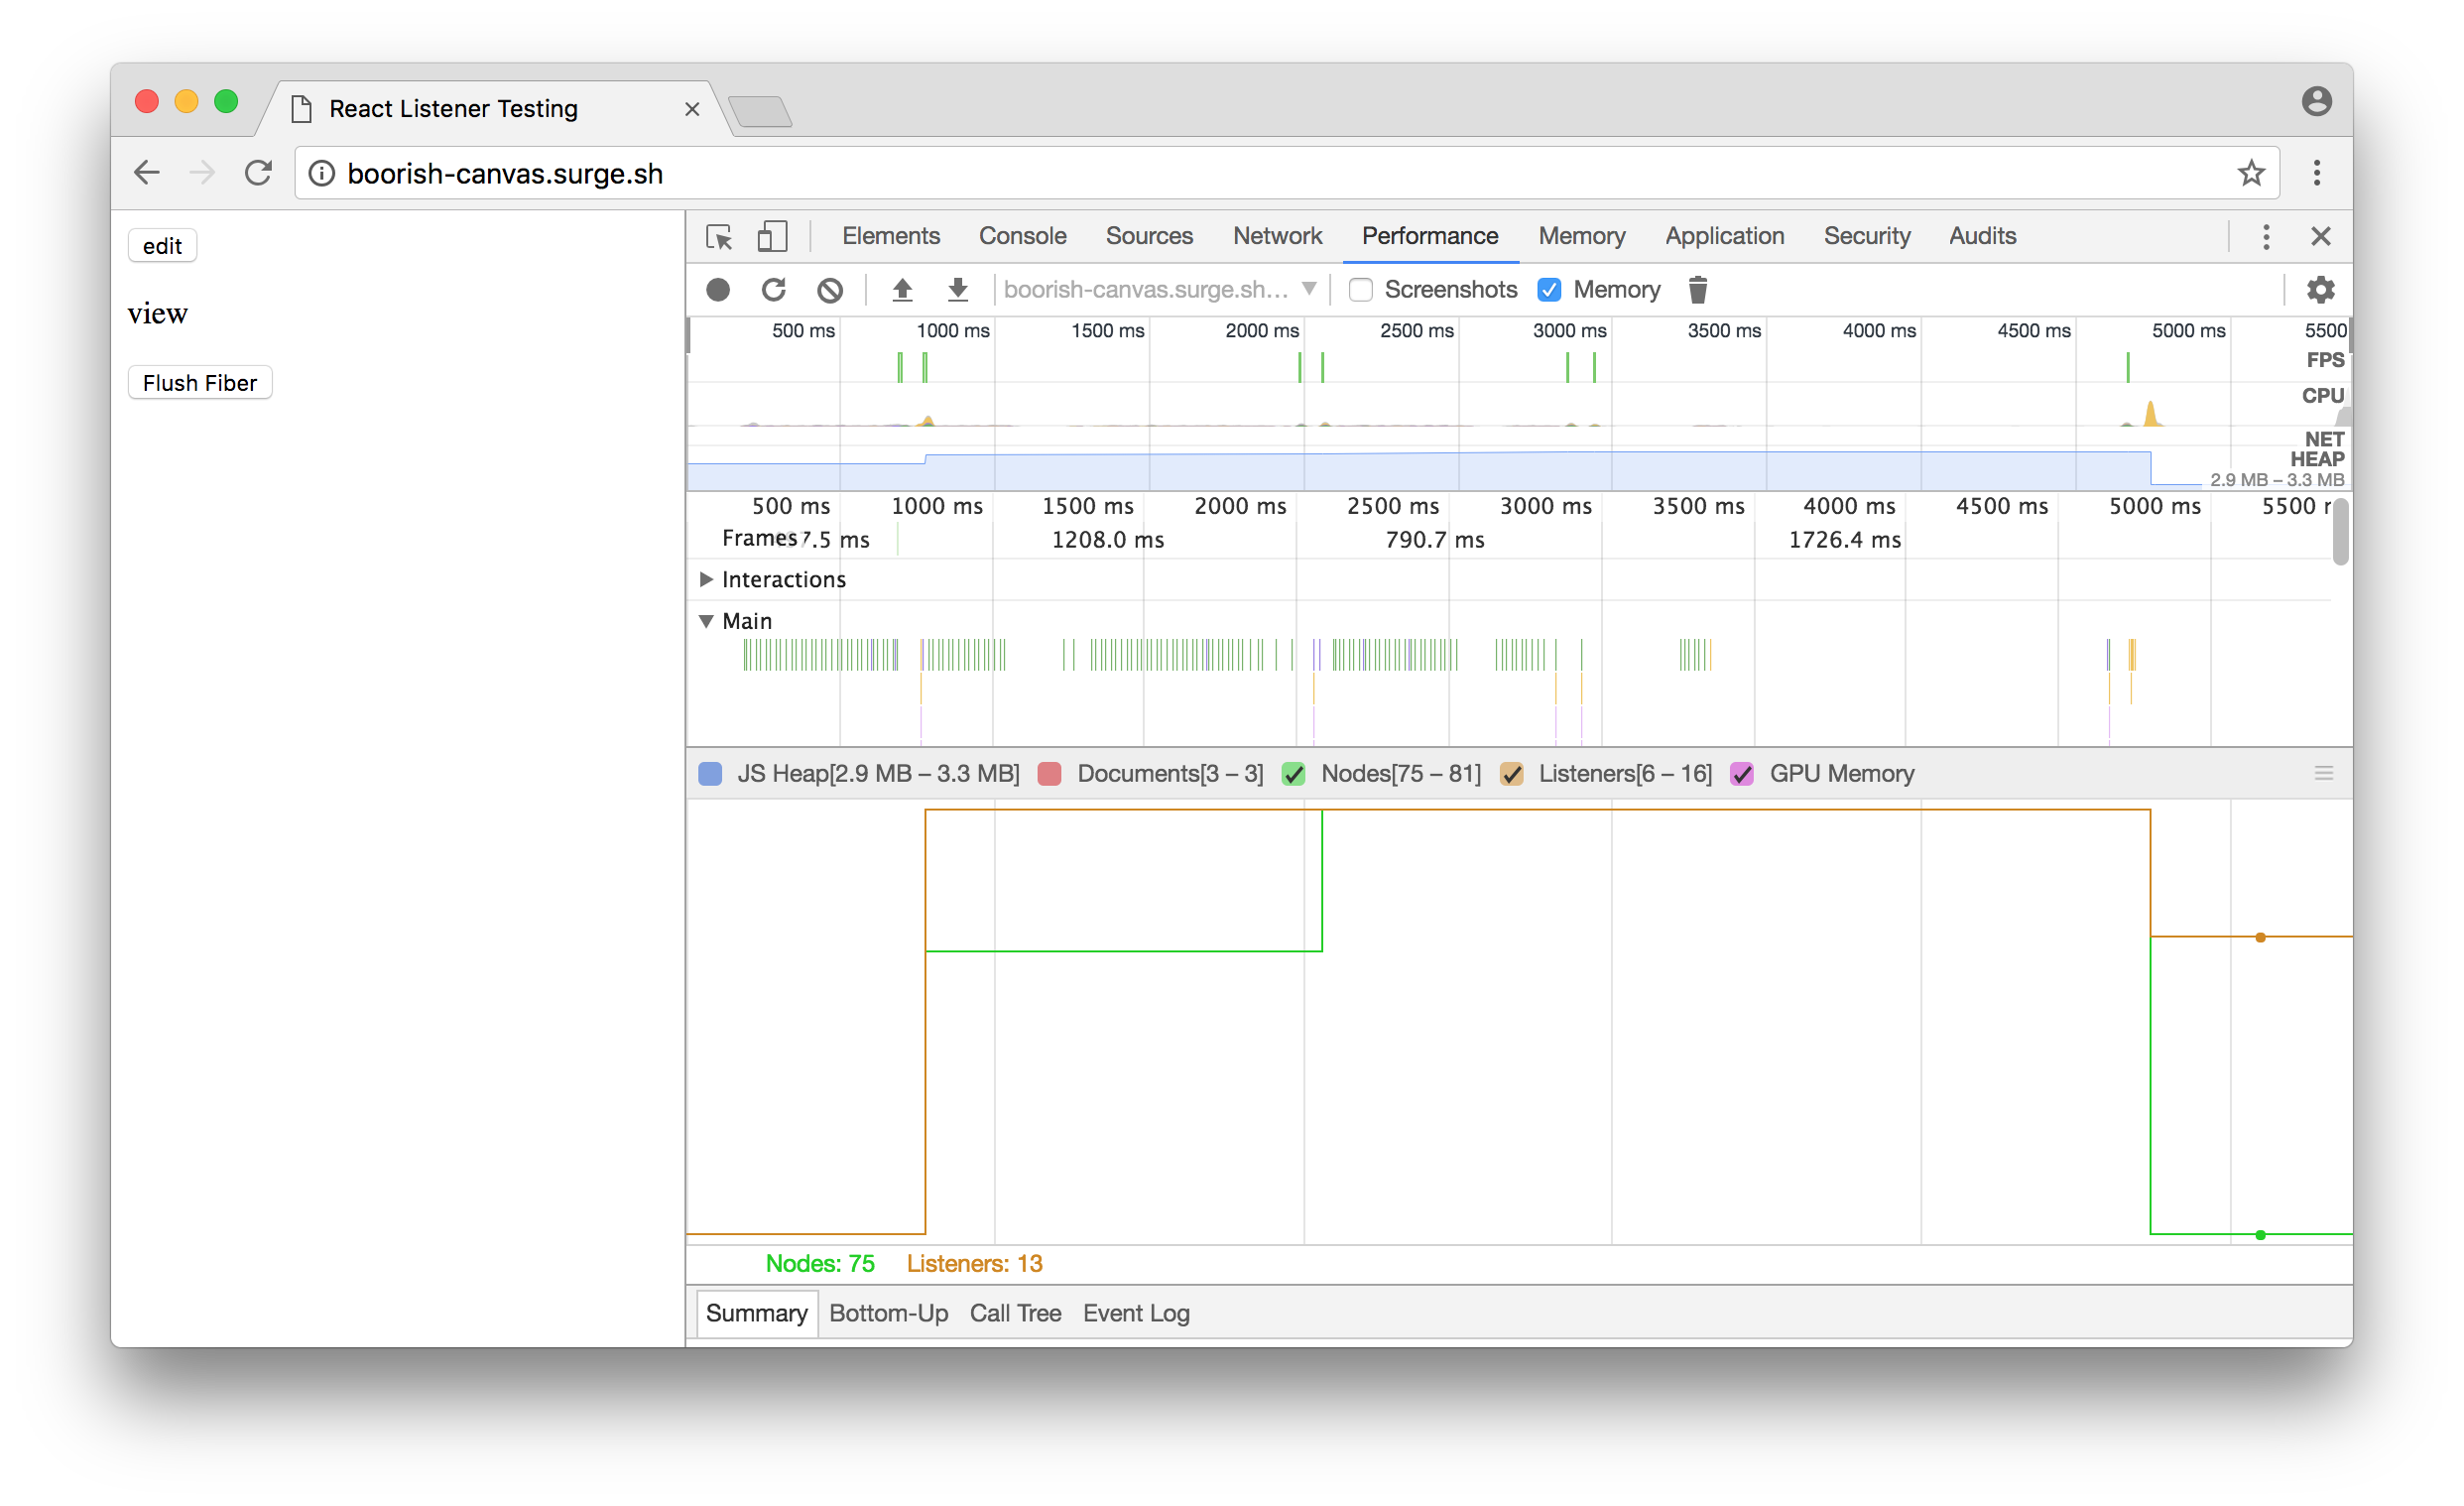
I might have an answer.
I made a modification to @hally9k's example that adds a revision counter to flush the prior DOM tree and I think it illustrates that there isn't a leak:
http://boorish-canvas.surge.sh
https://github.com/nhunzaker/listener-leak-test
Try the following steps:
First, this is the initial snapshot after a GC:

6 Listeners, 75 DOM nodes
Now do this
- Clear GC
- Click the record button on the performance tab
- Click "edit" to open a form"
- Close "view" to close the form
- Click "flush" to purge the last tree
- Clear GC
- End session
DOM nodes will not increase, however you will see event listeners increase by 7. These listeners are, precisely:
- blur
- change
- focus
- input
- keydown
- keyup
- selection change
They are attached to the document to support the event plugin system when the input attaches to the page. They are one time bindings.
It is also worth noting that submit, and reset are attached to the form element and invalid is attached to the input. They are cleaned up when the "flush" button is clicked and the nodes are purged from memory on GC.
Now, without refreshing the page:
- Clear GC
- Click the record button on the performance tab
- Click "edit" to open a form"
- Type text into the input
- Click "view" to collapse the form
- Click "flush" to purge the last tree
- Clear GC
- You will not see a net increase in event listeners or DOM nodes.

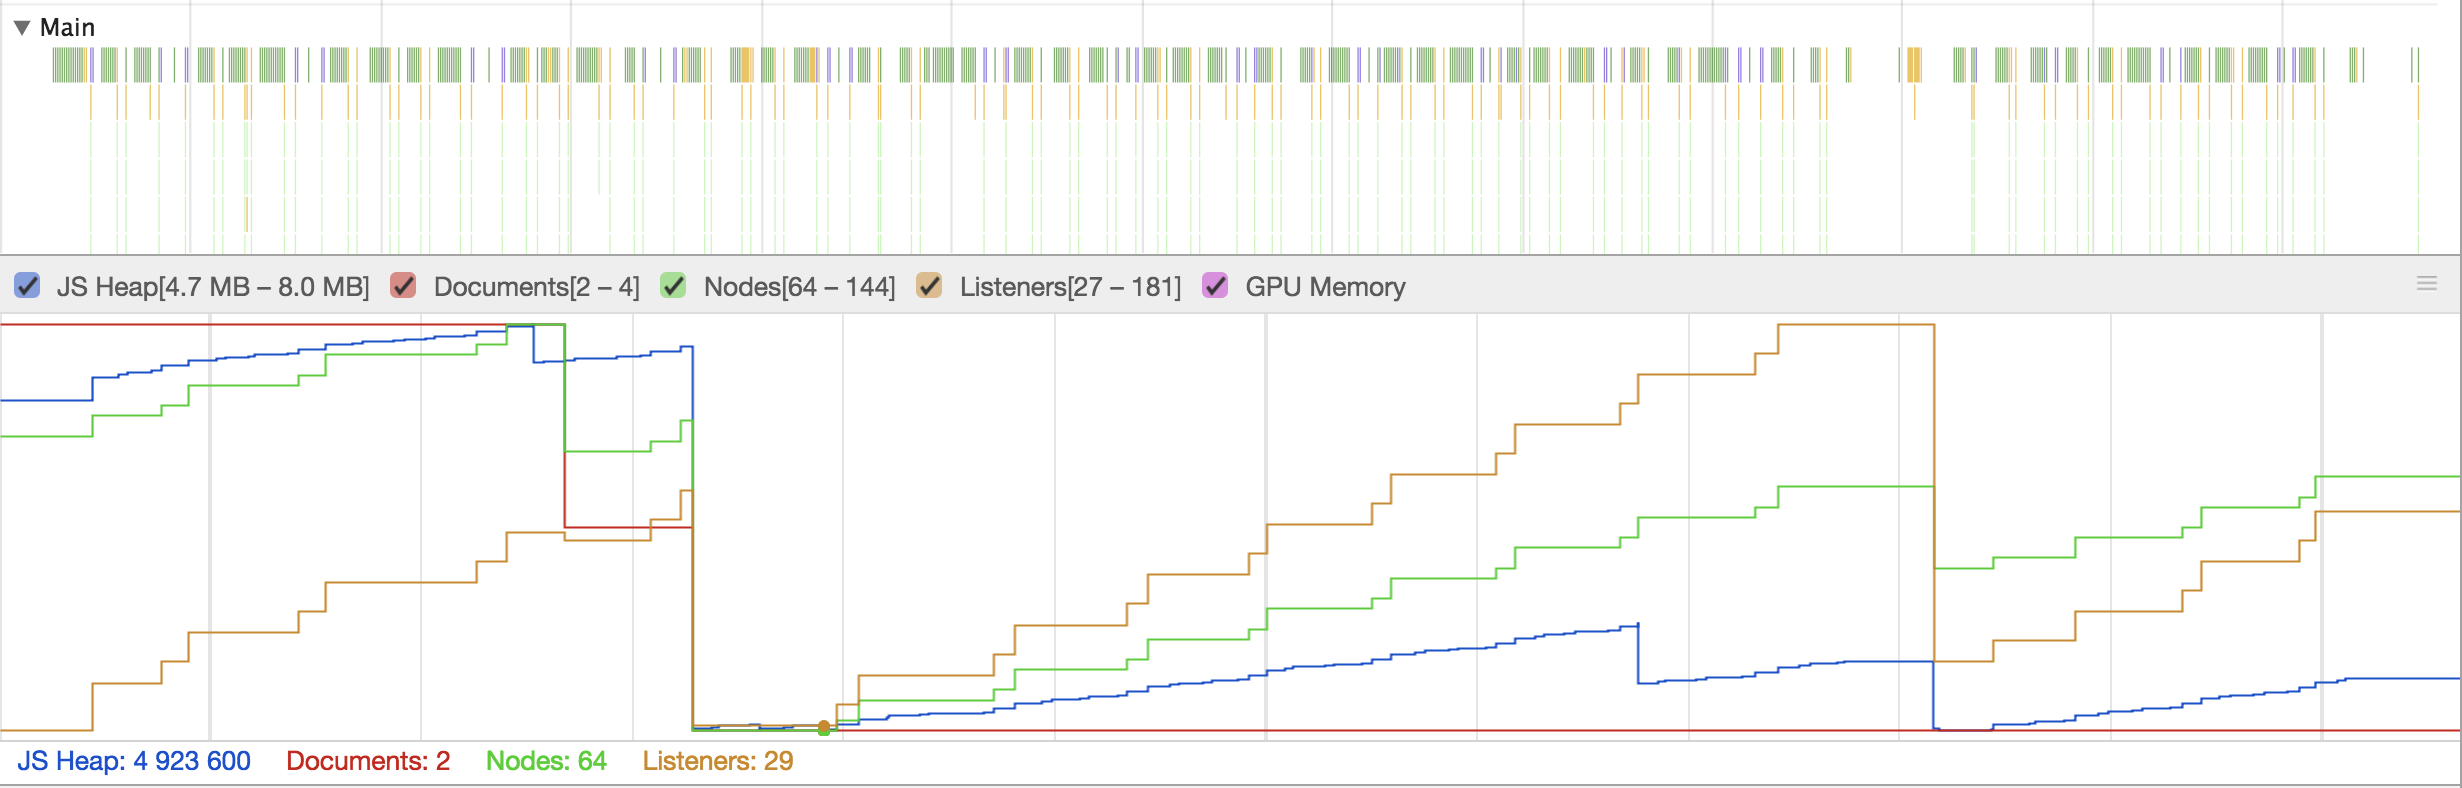
Final JS Performance graph
DOM Nodes for this chart actually went down, but I think that's probably something else. Confirmation that nodes do not leak should be empirically evident in the Performance tab recording.
nhunzaker
on 2 Jun 2018
I had some time this morning but Chrome 67 seems to have a bug in the performance memory profiling that makes the y axis max out at 1 obscuring the chart, I can't get the chart to show in Canary or Chromium either. So frustrating! Is anyone else experiencing this? I've lodged a bug with the Chromium team:
https://bugs.chromium.org/p/chromium/issues/detail?id=849057
@nhunzaker Thanks for taking the time and the detailed explanation of your findings. Unfortunately, after downloading an older version of chrome (non-trivial 🙄) and finally profiling with your changes I couldn't see any difference in the number of GC'd listeners after "flushing" the reconciler's node references by firing that additional setState you added. The listeners accumulate as before and the number of listeners doesn't drop back to the original number.
From a high level position, even if the flush did release the references, I'm not entirely sure I would be satisfied with this behaviour. It appears that the stringing together of particular interactions would cause an accumulation of listeners until an update is scheduled that, by chance, allows the references to be released.
As a side note: I installed Preact on the example repo out of interest and it was stable.
I will be digging into the code later this evening (NZT)
hally9k
on 3 Jun 2018
From a high level position, even if the flush did release the references, I'm not entirely sure I would be satisfied with this behaviour
Totally. I struggle with this being the intended behavior as well. I am not familiar enough with the data Fiber component data structure, but it seems like the memory growth should flat-line similarly to forcing an unrelated update via setState.
Still, from what I'm seeing, it looks like event listening attachment leaking is a side-effect of DOM nodes failing to GC, as far as I can tell, the leak isn't happening at the post-mount step where local listeners attach.
I'm really curious what you find!
nhunzaker
on 3 Jun 2018
Hi. Have you guys had any progress on this since then?
I've just been forced to helplessly stare into memory profiler for the past week while trying to figure out the ever-increasing listeners count.
 kubijo
on 28 Apr 2019
kubijo
on 28 Apr 2019
Out of curiosity, are you using Sentry to log errors? I noticed A LOT of detached nodes and the root of the problem seems to be related to Sentry adding event listeners to various things. Still looking into it. My app reaches about 3-4 GB after 3 days running. (A slideshow website).
 raRaRa
on 7 May 2019
raRaRa
on 7 May 2019
Out of curiosity, are you using Sentry to log errors? I noticed A LOT of detached nodes and the root of the problem seems to be related to Sentry adding event listeners to various things. Still looking into it. My app reaches about 3-4 GB after 3 days running. (A slideshow website).
Nope, not in JS anyway.
kubijo
on 7 May 2019
This issue has been automatically marked as stale because it has not had recent activity. It will be closed if no further activity occurs. Thank you for your contribution.
![stale[bot] picture](https://avatars3.githubusercontent.com/in/1724?v=4&s=40) stale[bot]
on 10 Jan 2020
stale[bot]
on 10 Jan 2020
Closing this issue after a prolonged period of inactivity. If this issue is still present in the latest release, please create a new issue with up-to-date information. Thank you!
stale[bot]
on 17 Jan 2020
Related issues
 DimitarChristoff
·
3Comments
DimitarChristoff
·
3Comments
 trusktr
·
3Comments
trusktr
·
3Comments
 varghesep
·
3Comments
varghesep
·
3Comments
 framerate
·
3Comments
framerate
·
3Comments
 bloodyowl
·
3Comments
bloodyowl
·
3Comments
Most helpful comment
I might have an answer.
I made a modification to @hally9k's example that adds a revision counter to flush the prior DOM tree and I think it illustrates that there isn't a leak:
http://boorish-canvas.surge.sh
https://github.com/nhunzaker/listener-leak-test
Try the following steps:
First, this is the initial snapshot after a GC:
6 Listeners, 75 DOM nodes
Now do this
DOM nodes will not increase, however you will see event listeners increase by 7. These listeners are, precisely:
They are attached to the document to support the event plugin system when the input attaches to the page. They are one time bindings.
It is also worth noting that
submit, andresetare attached to the form element andinvalidis attached to the input. They are cleaned up when the "flush" button is clicked and the nodes are purged from memory on GC.Now, without refreshing the page:
Final JS Performance graph
DOM Nodes for this chart actually went down, but I think that's probably something else. Confirmation that nodes do not leak should be empirically evident in the Performance tab recording.