React-spring: Performance issue when there are lot's of components rendered
🐛 Bug Report
This is a critical issue affecting DevHub:
If there are few [animated?] components rendered, the animation is fast. If there are a lot of [animated?] components, even if they are on other places of the react tree, the performance is affected.
PS: Not sure yet if it's lot's of "animated" components that affects performance or simply lot's of normal components
Screenshot
Here just one column content is rendered and there are no lags:

Here with more columns rendered you can see some lags (ps: gets worse if I add more columns):
Expected behavior
I don't believe the other columns should affect the animation performance of this one, right? Because they are not in the same subtree. Something is wrong. Maybe this logic/implementation?
Link to repro (highly encouraged)
Didn't make a small reproducible demo yet.
You can fork devhub and change this line to {columnIndex === 1 && children({ to only render one column instead of all of them.
Environment
react-springv8.0.27reactv16.8.6 (react-native-web)
 brunolemos
All 7 comments
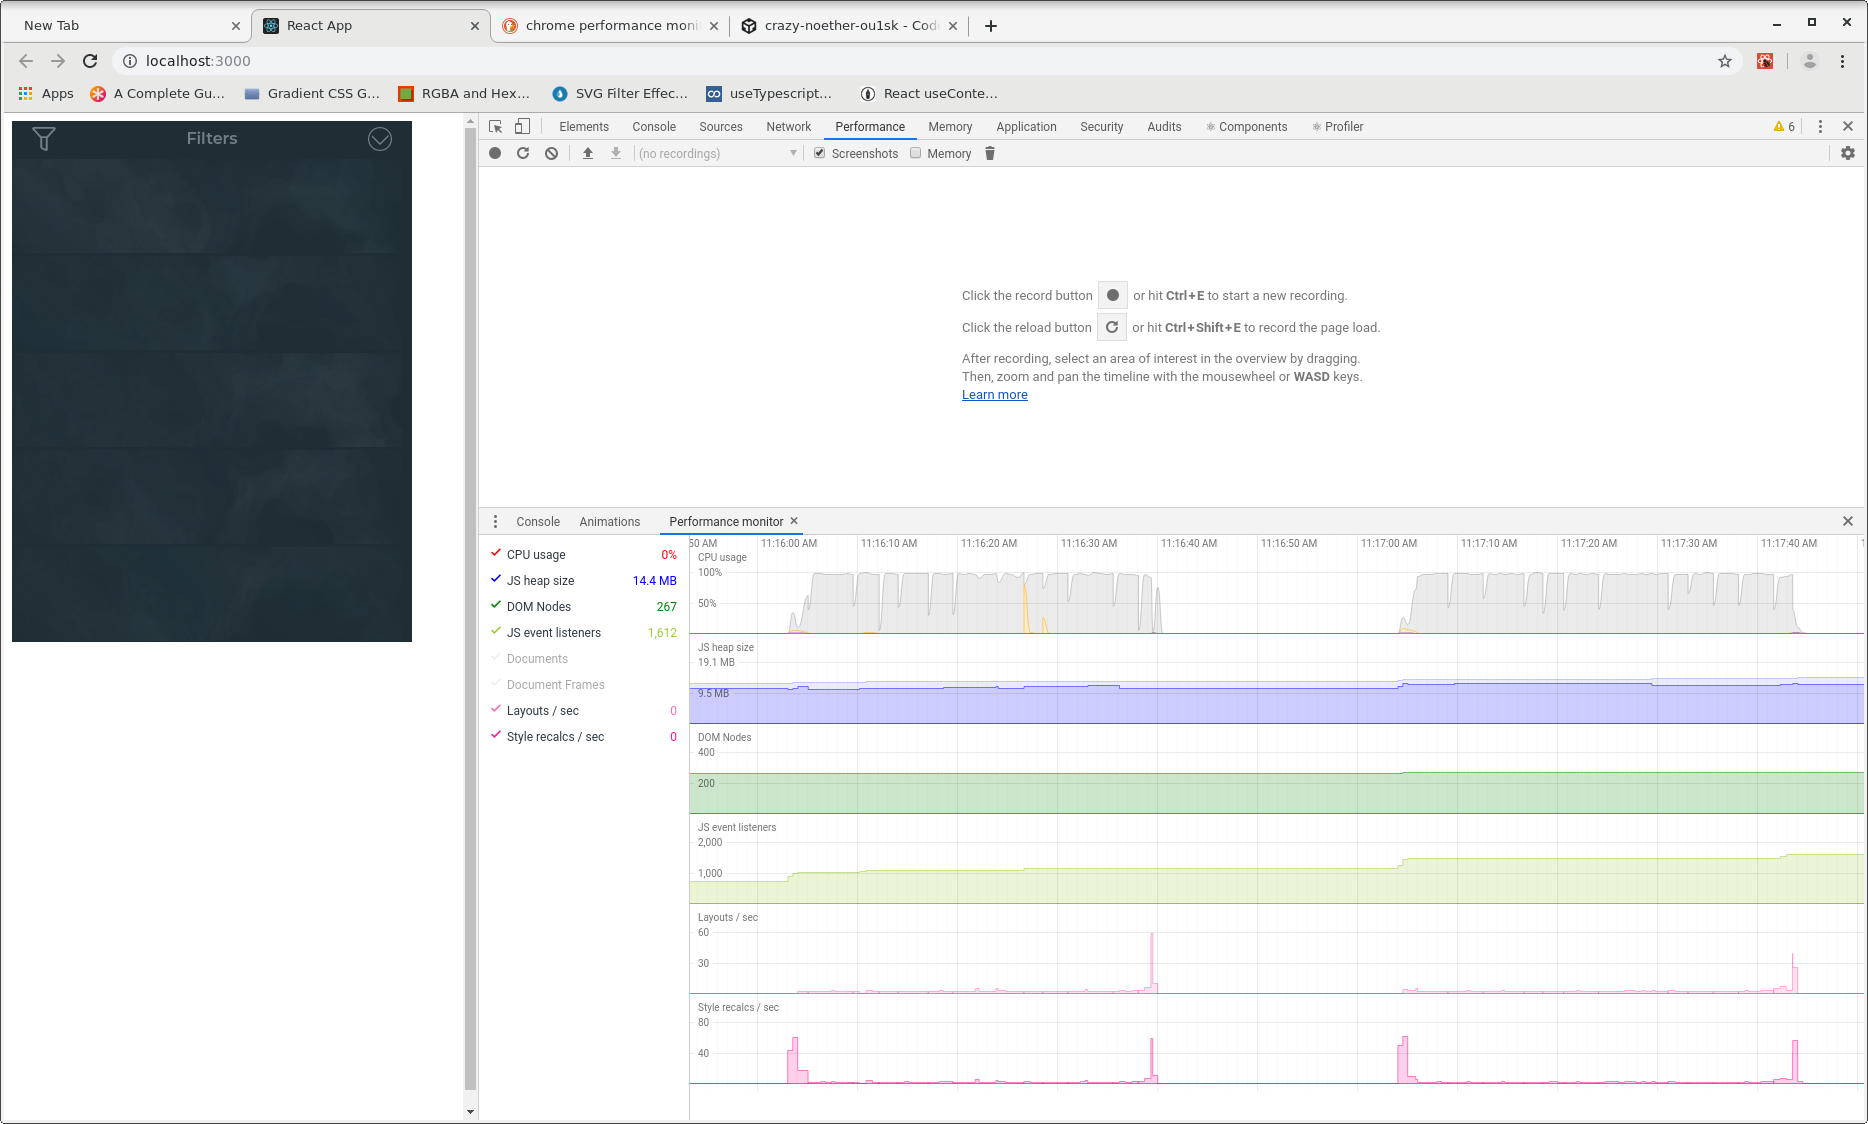
CPU Usage goes from 0.2% to >80% when animating (see red text at the left):
brunolemos
on 17 Aug 2019
I second this issue as I am also experiencing a degradation in performance when animating a listView with listViewItems which have complex content (in my case multiple box-shadows creating a cloudlike appearance. The animation can be seen here. I have also attached a screen shot of performance monitor for a similar setup on my dev machine - as you can see triggering the toggle causes the CPU to jump to nearly 100% for the duration of the animation. I also notice that the number of JS event listeners continues to increase whether opening or closing and they do not seem to be being GC'd (could be wrong on this)
I have tried using useMemo and React.memo() to isolate items from the DOM which do not require rerendering but this has not been effective.
Here is a screenshot of performance monitor comparing a full page reload (on left) with a toggle open (on right). As you can see the page loads and renders efficiently.
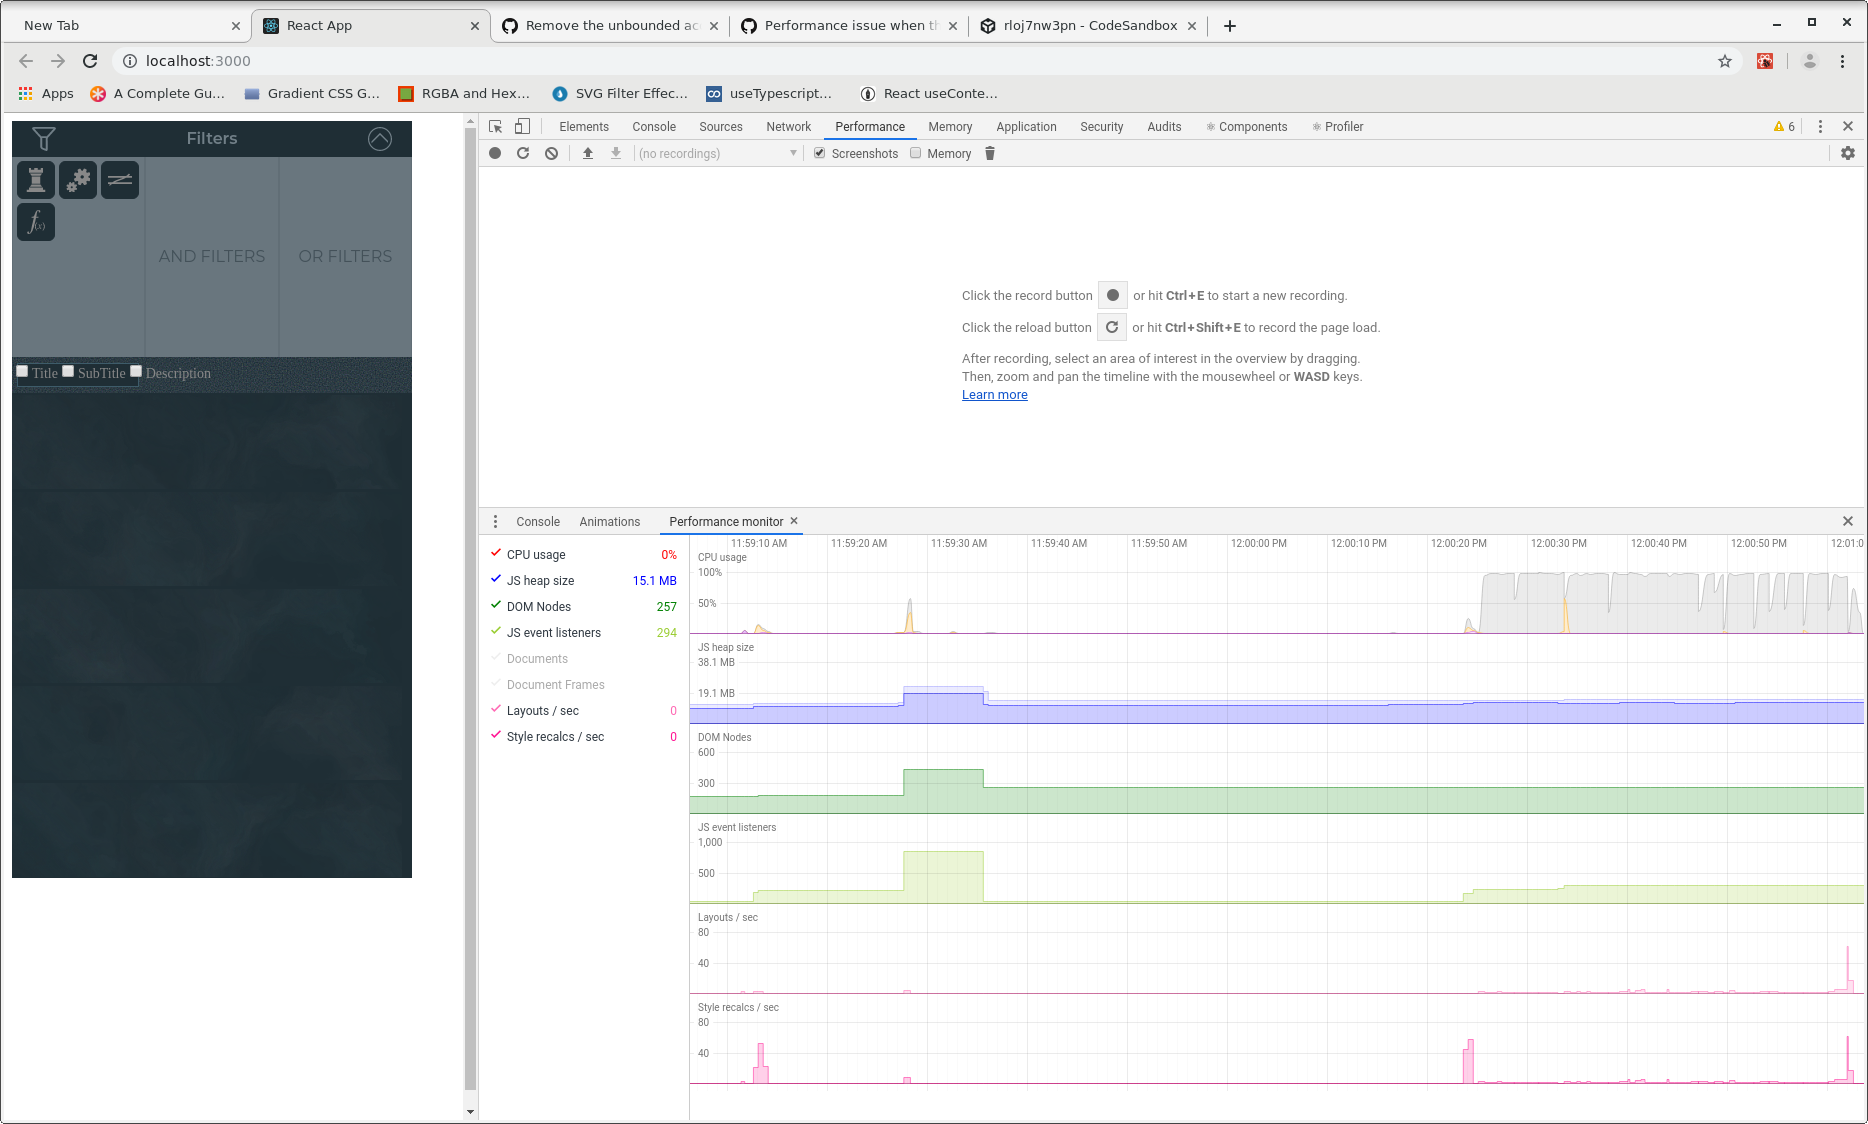
On the performance tab I am seeing a "Composite Layers" task 600-800ms long duirng the animation
 carsoni
on 28 Aug 2019
carsoni
on 28 Aug 2019
IMHO, it might be a performance issue with applyAnimatedValues where there's a _read-write-read-write_ situation, causing multiple layout trashing and layer repaints on each frame update.
The performance degradation varies for different use cases. If there are lots of DOM elements, the time needed to re-calculate layout is increased, despite few repaints. If there are heavy-styled elements (like using box-shadows), the time needed to repaint is increased, despite few DOM elements.
Refactor proposal for FrameLoop and applyAnimatedValues:
- Before frame loop starts: batch read from the DOM node instance, only to gather data necessary for setting up the loop (
instance.nodeName,instance.parentNode,instance.hasAttribute(), etc). - On each frame: batch apply animated values to the DOM node instance, avoid any read access from it. Maybe also use
style.cssTextto only write once per frame? - After frame loop ends: wait for orchestrated animations to finish, then cleanup (unmount if necessary) on the same tick.
Or maybe use 3rd-party lib like fastdom?
 guopengliang
on 8 Sep 2019
guopengliang
on 8 Sep 2019
@guopengliang can you verify that claim? where in applyAnimatedValues is layout thrashing happening (use this list to know which properties trigger reflows)?
 aleclarson
on 8 Sep 2019
aleclarson
on 8 Sep 2019
@aleclarson I assume there are two places where performance might be improved. But I haven't found a way to make benchmark tests to pin down as which exact lines of code is causing problem.
Besides the list you suggested, I found this talk by Paul Lewis about read-write-read-write performance issue most-likely relevant to the issue we are talking about.
https://github.com/react-spring/react-spring/blob/caec34387ffc28c289265f55280a5163a8fe2b8c/src/targets/web/globals.ts#L96-L122
First, some small code changes inside applyAnimatedValues (identical in v8 and v9) might be useful. With the two for-loops used to set style properties and node attributes:
- avoid
hasAttributeaccess before eachsetAttribute. - move
isFilterElementoutside the loop, to the very start of loop (where we set up the loop). - move
setAttributeandsetPropertyout from these loops and to their dedicated loop at the very end ofapplyAnimatedValuesfunction, making it _read-read-write-write_ (or just use fastdom to handle the lifting).
Second, again in the FrameLoop.advance method, a for loop is used to apply animated values for multiple instances. JS calculations can be very heavy if there are a lot of nested values to be iterated via getValue. The stack is identical to _calc-write-calc-write_ where _calc_ takes a few milliseconds to complete and the layout become invalidated immediately after each _write_. Perhaps we can optimize it by synchronously apply all the nested values at once at the very end of each frame.
guopengliang
on 10 Sep 2019
Following up on my earlier comment - I'd like to withdraw my concerns. On running my code on a GPU accelerated machine the performance issue has disappeared.
I imagine this is due to "already rendered" textures being managed by the GPU. My dev machine is a bare bones Linux machine (lots of ram and cores but no fancy gpu) and it was on this machine that I experienced the performance issue.
Hope this wasn't too much of a red herring. Note that I haven't actually measured performance but subjectively I'm not concerned.
Regards
Ian
carsoni
on 13 Sep 2019
@guopengliang Your comments have been addressed in this commit. Feel free to review it.
aleclarson
on 21 Sep 2019
Related issues
 eDubrovsky
·
3Comments
eDubrovsky
·
3Comments
 mkhoussid
·
3Comments
mkhoussid
·
3Comments
 VincentCtr
·
3Comments
VincentCtr
·
3Comments
 MaximeDenuit
·
4Comments
MaximeDenuit
·
4Comments
 fortezhuo
·
3Comments
fortezhuo
·
3Comments
Most helpful comment
CPU Usage goes from 0.2% to >80% when animating (see red text at the left):