Hi!
My app includes only one home screen, and it should run for a long period of time(In kiosk mode, for weeks).
After a while, I have noticed that it is crashing due to memory growth(it became something like 500,000K).
I started to investigate this bug, and created a simplified version of this app: one component that all it does is changing the UI every 500ms, and ran it over night.
(The code of this component can be found below)
As you can see, all it does is just increase the counter by 1 every 500ms and update the parameter.
The result component is:

When I started to run this app, memory usage was around 46,000k.
After a night running, memory usage is 214,338K:

Can someone please tell me what am I missing? why this huge memory growth happening?
About setInterval: I know that setInterval can cause memory leaks, but the GC suppose to clear it(please check https://stackoverflow.com/questions/14034107/does-javascript-setinterval-method-cause-memory-leak)
React Native version: 0.60.5
Steps To Reproduce
- Create new React-Native app
- Use the Home component that I posted, which changes some parameters in the UI every 500ms using setInterval function
- Check the memory usage of this app
- Give this app a night run
- Check the memory usage again
Describe what you expected to happen:
Memory usage not growing
Snack, code example, screenshot, or link to a repository:
import React, {useEffect, useState} from 'react';
import {StyleSheet, View, Text} from 'react-native';


let counter = 0;

const Home = ({
}) => {
  // State
  const [param1, setParam1] = useState(0);
  const [param2, setParam2] = useState(0);
  const [param3, setParam3] = useState(0);
  const [param4, setParam4] = useState(0);
  const [param5, setParam5] = useState(0);
  const [param6, setParam6] = useState(0);

  // Effects
  useEffect(() => {
    // <- component did mount + unmount equivalent
    const interval = setInterval(() => {
      counter += 1;
      setParam1(counter)
      setParam2(counter)
      setParam3(counter)
      setParam4(counter)
      setParam5(counter)
      setParam6(counter)
    }, 500);

    return () => {
      clearInterval(interval)
    };
  }, []);

  const connectivitySummary = () => {
    return (
      <View>
        <Text>{param1}</Text>
        <Text>{param2}</Text>
        <Text>{param3}</Text>
        <Text>{param4}</Text>
        <Text>{param5}</Text>
        <Text>{param6}</Text>
      </View>
    );
  };

  return (
    <View style={{flex: 1}}>
      <View>{connectivitySummary()}</View>
    </View>
  );
};

export default Home;
Thank you for your help!!
 DanielPiflaks
All 38 comments
Anyone?
DanielPiflaks
on 22 Sep 2019
Not immediately helpful, but we're seeing the same symptoms in our app. It is a somewhat more complex app, but also meant to be long-living, and instead getting killed for out-of-memory. Depending on device spec, somewhere between daily and weekly.
We'll gladly assist in collect any data that would help troubleshoot this, if someone could tell us what would be helpful.
 carlpett
on 10 Oct 2019
carlpett
on 10 Oct 2019
I don't have a good solution either, but we're facing similar issues. Leaving the app running without touching it causes the memory consumption to keep rising until it's killed by the OS after a couple of days (depending on device). Our current work around strategy is to unload react native and show a native iOS/Android view instead. It seems to mostly work. Still having issues with memory not being cleared on iOS on unload.
 othorin
on 23 Oct 2019
othorin
on 23 Oct 2019
This issue seams to be missing tags or interactions from @react-native-bot – any way to trigger that?
 brodin
on 23 Oct 2019
brodin
on 23 Oct 2019
This issue seams to be missing tags or interactions from @react-native-bot – any way to trigger that?
@DanielPiflaks do you know why?
brodin
on 29 Oct 2019
This issue seams to be missing tags or interactions from @react-native-bot – any way to trigger that?
@DanielPiflaks do you know why?
I'm sorry, this is my first post here and I don't really know what is a "react-native-bot", ways to trigger it or tags.
Can you explain please?
DanielPiflaks
on 29 Oct 2019
@shergin sorry for the personal ping, but what can @DanielPiflaks can do to get more attention to this issue? Seams to be ignored by @react-native-bot or any other feedback. Huge thanks in advance! 🙏
brodin
on 6 Nov 2019
I can easily replicate this issue on mac with ios simulator, and plain project created with rn cli on react-native 0.65
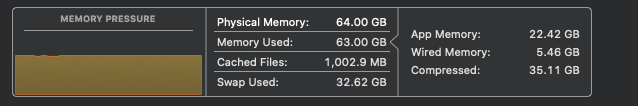
If I leave the app open over night it'll continue to grow to 100s of GBs in ram

I can reproduce it every time with 2 active react native projects, and just replicated it with a newly created empty react-native project.
 arrygoo
on 18 Dec 2019
arrygoo
on 18 Dec 2019
I am dealing with the same problem...
I made a double check and run meminfo on Facebook app.
The memory is continue to grow if u leave the app in the UI. The memory is not cleaned until u close the app, even close the screen (change to sleep mode) does not help.
 LiorAhronovich
on 26 Dec 2019
LiorAhronovich
on 26 Dec 2019
Do you use react-navigation ? I have a memory leak in my app due to stack navigator (https://github.com/react-navigation/stack/issues/251).
 MichaelBorde
on 30 Dec 2019
MichaelBorde
on 30 Dec 2019
Do you use
react-navigation? I have a memory leak in my app due to stack navigator (react-navigation/stack#251).
No, sorry
DanielPiflaks
on 30 Dec 2019
Ok I had to ask because I have a memory leak in may app and react-navigation is responsible for the most of it.
Do you experience the same behaviour with hermes ? It may be related to garbage collection.
What about using a pure component instead of hooks ?
MichaelBorde
on 30 Dec 2019
Yes, I have already tried hermes and pure component with this app and the result remains the same.
DanielPiflaks
on 30 Dec 2019
I have also tried to create native application(on Android) that do the same thing and after 4 days of running the memory consumption remains the same. It really looks like something in the RN causing this problem.
How can I get more attention to this problem? I'm really thinking about rewriting my app in different platform...
DanielPiflaks
on 5 Jan 2020
I'm experiencing this on a plain react-native app in the iOS simulator
arrygoo
on 7 Jan 2020
So sorry about this, but @cpojer @hramos @mdvacca @osdnk @PeteTheHeat @rickhanlonii @RSNara @TheSavior - the issue bot doesn't seem to work, and your names turned up as committers from the RN Team. Could anyone have a look? Or inform what more needs to be done for someone to investigate?
One of our developers tried leaving the FB app open for a long time, and it seems to happen there too, by the way.
carlpett
on 17 Jan 2020
Can you see if this repros on the latest RC? I remember seeing something about a React memory leak retaining fibers in memory that I know we fixed. I’m curious if that is the problem here.
 TheSavior
on 17 Jan 2020
TheSavior
on 17 Jan 2020
Can you see if this repros on the latest RC? I remember seeing something about a React memory leak retaining fibers in memory that I know we fixed. I’m curious if that is the problem here.
Something you could try @DanielPiflaks ?
brodin
on 20 Jan 2020
We have tried the latest RC(0.62) and after a night run the RAM double itself(from 70 MB to 143 MB).
DanielPiflaks
on 23 Jan 2020
We use the simple test below with both versions 0.61.4 and 0.62. Memory increases by 10-15MB per day.
import React from 'react';
import {SafeAreaView, Text, StatusBar} from 'react-native';

class Refreshed extends React.PureComponent {
  constructor(props) {
    super(props);
    this.state = {value: 0};
  }

  componentDidMount() {
    this._interval = setInterval(
      () => this.setState({value: this.state.value + 1}),
      100,
    );
  }

  componentWillUnmount() {
    clearInterval(this._interval);
  }

  render() {
    return <Text style={{color: 'white'}}>{this.state.value}</Text>;
  }
}

const App: () => React$Node = () => {
  return (
    <>
      <StatusBar barStyle="dark-content" />
      <SafeAreaView style={{flex: 1, backgroundColor: 'black'}}>
        <Refreshed />
      </SafeAreaView>
    </>
  );
};

export default App;
Thanks for the info. Can you make that repro case any smaller? Does the StatusBar need to be rendered for the memory growth? Does the safe area view? Or is it purely incrementing the counter with a timer?
TheSavior
on 23 Jan 2020
@TheSavior You can check the code in the original post, there we have just increment the numbers on the screen every 500ms using interval.
DanielPiflaks
on 23 Jan 2020
@TheSavior You can remove those components it does not matter. We use tablets configured to be always on and I wanted to set a black background to avoid damaging the screens.
MichaelBorde
on 23 Jan 2020
@TheSavior do you need a smaller repo to continue with this?
brodin
on 13 Feb 2020
A more focused repro would definitely be better
TheSavior
on 13 Feb 2020
What about:
import React from 'react';
import {Text} from 'react-native';

class App extends React.Component {
  constructor(props) {
    super(props);
    this.state = {value: 0};
  }

  componentDidMount() {
    this._interval = setInterval(
      () => this.setState({value: this.state.value + 1}),
      100
    );
  }

  componentWillUnmount() {
    clearInterval(this._interval);
  }

  render() {
    return <Text>{this.state.value}</Text>;
  }
}

export default App;
Now that we have a more focused repo; is this something that you can look into? Would be much appreciated 🙏
brodin
on 11 Mar 2020
What about:
import React from 'react';
import {Text} from 'react-native';

class App extends React.Component {
  constructor(props) {
    super(props);
    this.state = {value: 0};
  }

  componentDidMount() {
    this._interval = setInterval(
      () => this.setState({value: this.state.value + 1}),
      100
    );
  }

  componentWillUnmount() {
    clearInterval(this._interval);
  }

  render() {
    return <Text>{this.state.value}</Text>;
  }
}

export default App;
@TheSavior anything new in the changelog that could mitigate this issue?
brodin
on 27 Apr 2020
I don’t think I’ve seen a PR or commit go by addressing this
TheSavior
on 27 Apr 2020
FWIW, I’m not surprised this uses additional memory and causes growth. Every render call creates new objects and every state change creates new objects and book keeping in React that triggers another render.
I would expect that memory to be garbage collected though. Does the application end up running out of memory and crashing?
Also, similar to the stack overflow post in the OP, have you tried getting a memory trace over time to see if there is a sawtooth pattern? Just checking at two points doesn’t necessarily mean it isn’t being collected.
TheSavior
on 27 Apr 2020
@TheSavior The application ends up in crashing after a while (in the case I have presented in the post, it is crashing after a ~day running, on a device with 1G RAM).
I also expected that the memory will be garbage collected, but this is not the case - it will just grow until there is no enough free RAM, and then it will crash.
About the memory trace over time - I used memory profiler using Android Studio and indeed saw the sawtooth pattern (even when you could clearly see the garbage collection calls).
DanielPiflaks
on 28 Apr 2020
The sawtooth pattern is good! That means stuff is getting garbage collected. Are you able to use that profiler to see what memory is being retained and not freed?
TheSavior
on 28 Apr 2020
I saw the sawtooth pattern, but in overall the memory increased - each sawtooth peak was higher then the previous one.
From that I figured out that some of the memory is not garbage collected.
Sorry about not being clear about that.
DanielPiflaks
on 28 Apr 2020
We have monitored this app over a month: https://github.com/facebook/react-native/issues/26407#issuecomment-577585708
We are using react-native 0.61.5 on android 8.
Some PSS results:
2020-01-16:  60MB
2020-01-20: 111MB
2020-01-24: 164MB
2020-01-30: 244MB
2020-02-04: 317MB
2020-02-10: 342MB
We are now monitoring an even simplier version: https://github.com/facebook/react-native/issues/26407#issuecomment-585858911
Most PSS usage is in unknown native memory.
We tried to tweak JavaScriptCore GC based on this issue without significant success: https://github.com/facebook/react-native/issues/23259
MichaelBorde
on 29 Apr 2020
We have monitored the same app for 5 days with v8 instead of JSC thanks to https://github.com/Kudo/react-native-v8.
Memory is stable, we do not suspect any leak.
Here is a procstats: 42MB-44MB-49MB (min-avg-max pss).
With JSC we observe that PSS increases 15MB per day. Even after 5 days only we would have detected a memory issue. That's not the case with v8.
MichaelBorde
on 6 May 2020
Hey there, it looks like there has been no activity on this issue recently. Has the issue been fixed, or does it still require the community's attention? This issue may be closed if no further activity occurs. You may also label this issue as a "Discussion" or add it to the "Backlog" and I will leave it open. Thank you for your contributions.
![stale[bot] picture](https://avatars3.githubusercontent.com/in/1724?v=4&s=40) stale[bot]
on 8 Aug 2020
stale[bot]
on 8 Aug 2020
Closing this issue after a prolonged period of inactivity. If this issue is still present in the latest release, please feel free to create a new issue with up-to-date information.
stale[bot]
on 16 Aug 2020
Has this problem been solved?
 zhanggang99
on 8 Sep 2020
zhanggang99
on 8 Sep 2020
Related issues
 jobsamuel
·
3Comments
jobsamuel
·
3Comments
 jlongster
·
3Comments
jlongster
·
3Comments
 ghost
·
3Comments
ghost
·
3Comments
 WG-Com
·
3Comments
WG-Com
·
3Comments
 vikeri
·
3Comments
vikeri
·
3Comments
Most helpful comment
We use the simple test below with both versions 0.61.4 and 0.62. Memory increases by 10-15MB per day.