React-native-svg-charts: [Feature] Direct manipulation of the data prop (Specifically Line Charts)
Hi all,
First of all, thanks for the great library. I love using it. Also, apologies if this is a duplicate issue, or if I'm missing something simple. I have searched around and couldn't find issues related to this.
The Requirement
My most recent project requires an auto scrolling realtime line chart (like an ECG/EKG plot) which I've been able to create like this so far -
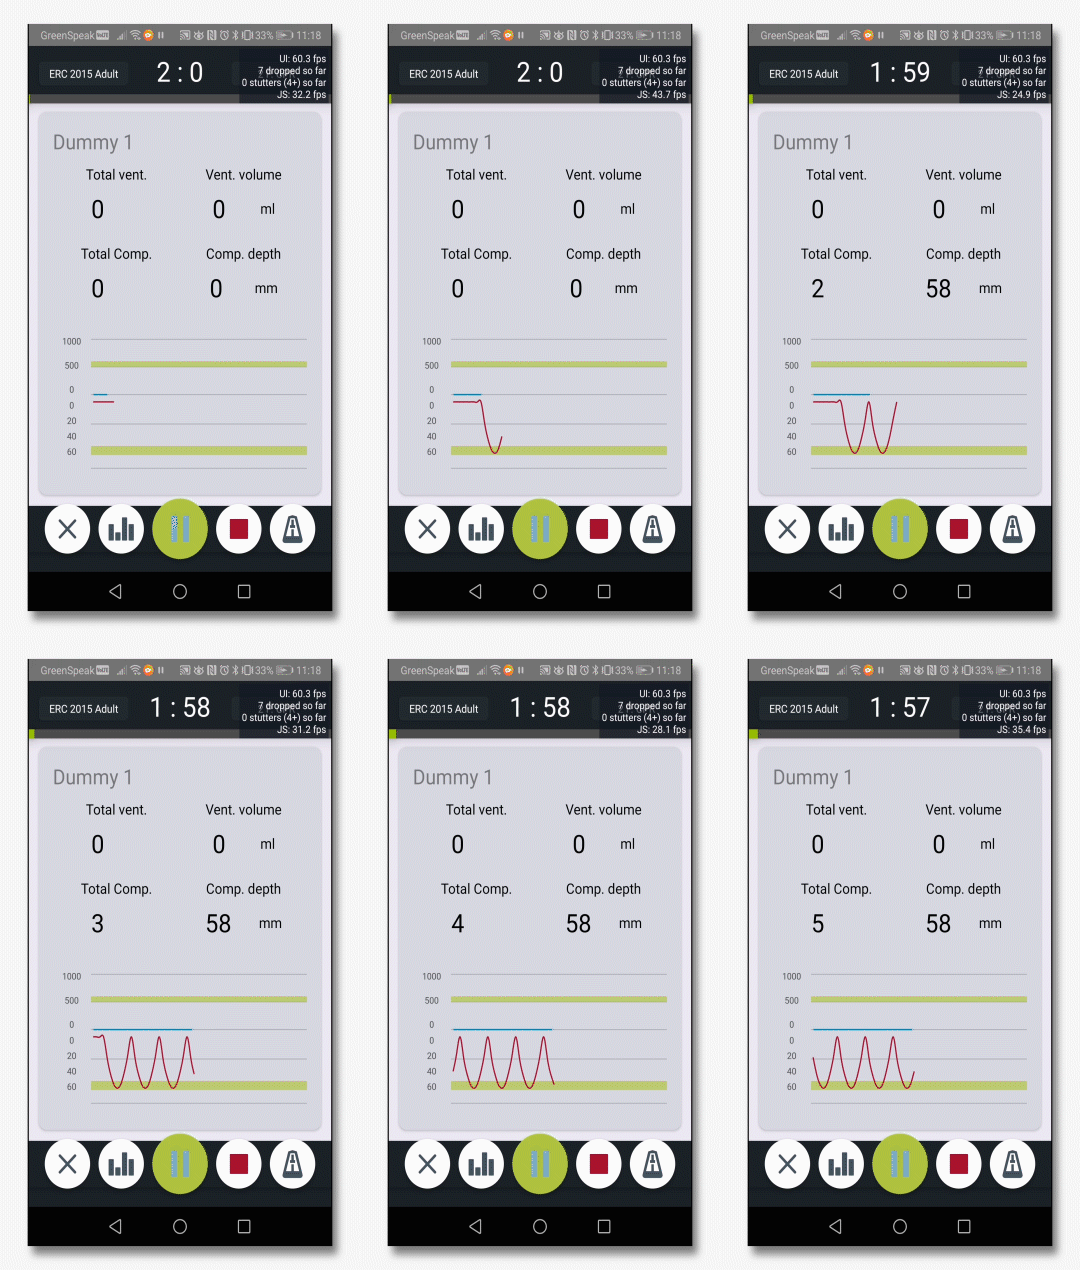
This is done by receiving sensor data every 50ms (20Hz) and pushing this to an array that contains the sensor data for the active session. I then slice the last couple of seconds from the total array, and store it in a new windowArray, I then pad the windowArray, with a bunch of undefineds to give the blank right hand side of the chart.
The Problem
The problem is, that this requires redrawing the whole graph every 50ms which has a big performance overhead, and the project requirements stipulate that we need to have multiple charts (for monitoring multiple sensors) on the screen at once.
The Solution?
Therefore it would be great to have an ability to directly manipulate the Line Chart using something like this:
this.chartRef.setNativeProps({data: windowArray});
The Attempt
So far I have tried to test the setNativeProps() by using the following code.
`
export class TestChart extends Component<{}> {
public chartRef?: LineChart<number> | null = undefined;

public constructor(props: any) {
  super(props);
  this.updateChart();
}

public render() {
    return(
      <View style={styles.container}>
        <View style={styles.scrollContainer}>
          <LineChart
            ref={(ref) => this.chartRef = ref}
            style={{flex: 1}}
            data={[] as number[]}
            svg={{ stroke: Color.ambuRed, strokeWidth: 1.5}}
            contentInset={{left: 10, right: 10, top: 10, bottom: 10}}
            numberOfTicks={5}
            curve={shape.curveNatural}
          >
          <Grid/>
          </LineChart>
        </View>
      </View>
    )
}
private updateChart = () => {
  setInterval(() => {
    console.debug("UPDATE CHART");
    const chartData = [] as number[];
    for (let index = 0; index < 30; index++) {
      chartData.push(Math.round(Math.random() * 100));
    }
    if(this.chartRef != null){
      console.debug("CHART REF IS VALID");
      //@ts-ignore
      if(this.chartRef.setNativeProps){
        console.debug("SHOULD BE UPDATING");
      // @ts-ignore
        this.chartRef.setNativeProps({data: chartData});
      }
    }
  }, 1000);
}
} `
And I get a yellow RN warning stating -
Warning: Function components cannot be given refs. Attempts to access this ref will fail. Did you mean to use React.forwardRef()?
Is it possible to get this to work with the LineChart?
 NeilMcGuiness
>All comments
I'd like this feature as well - being able to access the x & y coords of the chart's data would be nice.
 AlexCatch
on 27 Mar 2020
AlexCatch
on 27 Mar 2020
Related issues
 antoinerousseau
·
4Comments
antoinerousseau
·
4Comments
 jayesbe
·
5Comments
jayesbe
·
5Comments
 lotcz
·
3Comments
lotcz
·
3Comments
 vjsingh
·
6Comments
vjsingh
·
6Comments
 zeroed-tech
·
4Comments
zeroed-tech
·
4Comments
Most helpful comment
I'd like this feature as well - being able to access the x & y coords of the chart's data would be nice.