React-native-svg-charts: multi-line chart
Is it possible to create a multi-line chart, similar to the stacked-area (but not stacked)?
I tried with the line chart but it received only one set of data.
thank you
 GSreact
All 5 comments
+1. Id like to put 3 lines on one chart, all using the same axis. Except they each scale to 100% height automatically even though the axis is the same for all 3 charts.
 philsalesses
on 29 May 2018
philsalesses
on 29 May 2018
Right now the easiest way to do so is to place several charts on top of each other with absolute positioning. See this example. Just make sure that the have the same gridMin and gridMax, and of course an equal length data prop
 JesperLekland
on 31 May 2018
JesperLekland
on 31 May 2018
@JesperLekland
This is a good solution to my problem also with this technique I can create mixed charts (such as Line + Area)!
thank's for your job !
GSreact
on 31 May 2018
There is another undocumented solution (not for long I hope), more powerful, that allows sharing a single Y axis between multiple lines, see this PR : https://github.com/JesperLekland/react-native-svg-charts-examples/pull/15

 Bigood
on 5 Mar 2020
Bigood
on 5 Mar 2020
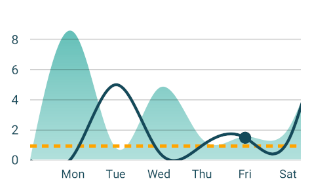
How can you put two lines on the same y-axis scale if you are using the approach with 2 area charts ? I use 2 charts with 2 different datasets. The code below is simplified to the most essential parts . The real chart is displayed on the screenshot.
 <YAxis
                    style={{ top: 0, bottom: 0, height: 180, marginTop: 30 }}
                    data={[0.3, 5, 0.54, 0.99, 1.5, 1.30, 8.5]}
                    contentInset={{ top: 50, bottom: 0 }}
                    numberOfTicks={5}
                    svg={{
                      fontSize: 13,
                      fill: '#174A5A',
                      strokeWidth: 0.3,
                      alignmentBaseline: 'baseline',
                      baselineShift: '25',
                    }}
  <AreaChart
                      style={{ flex: 1 }}
                      data={[200, 0.45, 2.8, 0.8, 0.90, 1.2, 4.4]}
                      contentInset={{ top: 50, bottom: 0 }}
                      numberOfTicks={5}
                      curve={shape.curveNatural}
                      showGrid={false}
                    />
 <AreaChart
                      style={{
                        position: 'absolute',
                        flexDirection: 'row',
                        width: '100%',
                      }}
                      data={0.3, 5, 0.54, 0.99, 1.5, 1.30, 8.5}
                      contentInset={{ top: 50, bottom: 0 }}
                      curve={shape.curveNatural}
                      numberOfTicks={5}
                    </AreaChart>
 DavidDolyak
on 24 Apr 2020
DavidDolyak
on 24 Apr 2020
Related issues
 jfr3000
·
5Comments
jfr3000
·
5Comments
 zeroed-tech
·
4Comments
zeroed-tech
·
4Comments
 vjsingh
·
6Comments
vjsingh
·
6Comments
 escobar5
·
3Comments
escobar5
·
3Comments
 BBenGit
·
6Comments
BBenGit
·
6Comments
Most helpful comment
@JesperLekland
This is a good solution to my problem also with this technique I can create mixed charts (such as Line + Area)!
thank's for your job !