React-native-debugger: Help to track chrome devtools memory bug (Chromium >= 59)
Context: https://github.com/jhen0409/react-native-debugger/pull/130#issuecomment-330034816 and this troubleshooting
The current version of RNDebugger (~ 0.7.x, Chromium 58) haven't this problem, but it will caused when we must to upgrade Chromium version (#130), so official remote debugger (Chrome browser) also does.
- [x] Confirm it caused since Chromium 59 (still on 62 Beta / 63 Canary)
- [ ] Confirm the problem still on the latest commit of ChromeDevTools/devtools-frontend
- [ ] Help to find related Chromium bug report, or just report with initial RN project
 jhen0409
All 8 comments
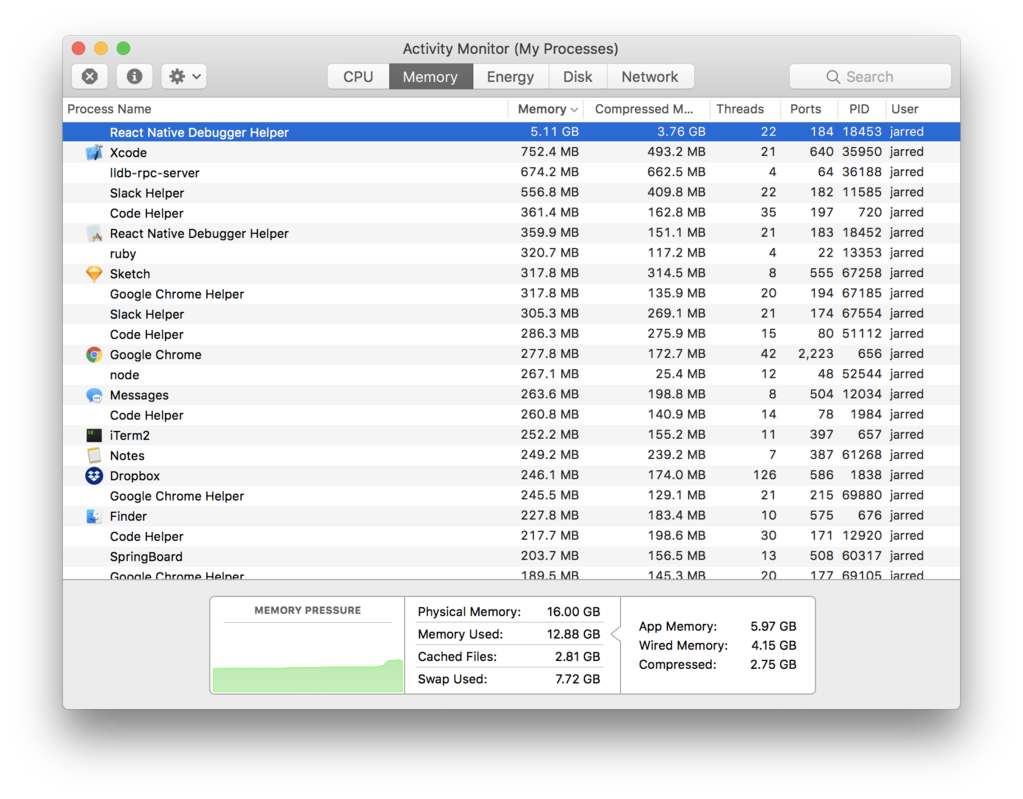
Got here via search. Latest update has a huge memory footprint, makes my app unusable under RN debugger, wondering if this is related.
EDIT: running 0.7.10
 blackxored
on 11 Oct 2017
blackxored
on 11 Oct 2017
It shouldn't related. What version did you use before?
jhen0409
on 12 Oct 2017
Not sure. IIRC one that said something about shortcuts in the update dialog.
blackxored
on 12 Oct 2017
Otherwise it may related to #147? If no, you can open an another issue.
jhen0409
on 12 Oct 2017
I don't know how helpful this can be, but I've updated to latest (7.1.2) this morning and while remote debugging a react-native 0.49 app on an Android (OS=7.1.2) device, the app keeps crashing with this log:
Fatal Exception: java.lang.OutOfMemoryError: pthread_create (1040KB stack) failed: Try again
       at java.lang.Thread.nativeCreate(Thread.java)
       at java.lang.Thread.start(Thread.java:730)
       at java.util.concurrent.ThreadPoolExecutor.addWorker(ThreadPoolExecutor.java:941)
       at java.util.concurrent.ThreadPoolExecutor.execute(ThreadPoolExecutor.java:1348)
       at android.os.AsyncTask.executeOnExecutor(AsyncTask.java:623)
       at com.facebook.react.devsupport.DevServerHelper.closePackagerConnection(DevServerHelper.java:186)
       at com.facebook.react.devsupport.DevSupportManagerImpl.reload(DevSupportManagerImpl.java:967)
       at com.facebook.react.devsupport.DevSupportManagerImpl.setDevSupportEnabled(DevSupportManagerImpl.java:480)
       at com.facebook.react.ReactInstanceManager.onHostPause(ReactInstanceManager.java:529)
       at com.facebook.react.ReactInstanceManager.onHostPause(ReactInstanceManager.java:551)
       at com.facebook.react.ReactActivityDelegate.onPause(ReactActivityDelegate.java:119)
       at com.facebook.react.ReactActivity.onPause(ReactActivity.java:60)
       at android.app.Activity.performPause(Activity.java:6824)
       at android.app.Instrumentation.callActivityOnPause(Instrumentation.java:1323)
       at android.app.ActivityThread.performPauseActivityIfNeeded(ActivityThread.java:3769)
       at android.app.ActivityThread.performPauseActivity(ActivityThread.java:3746)
       at android.app.ActivityThread.performPauseActivity(ActivityThread.java:3720)
       at android.app.ActivityThread.handlePauseActivity(ActivityThread.java:3694)
       at android.app.ActivityThread.-wrap16(ActivityThread.java)
       at android.app.ActivityThread$H.handleMessage(ActivityThread.java:1517)
       at android.os.Handler.dispatchMessage(Handler.java:102)
       at android.os.Looper.loop(Looper.java:154)
       at android.app.ActivityThread.main(ActivityThread.java:6186)
       at java.lang.reflect.Method.invoke(Method.java)
       at com.android.internal.os.ZygoteInit$MethodAndArgsCaller.run(ZygoteInit.java:889)
       at com.android.internal.os.ZygoteInit.main(ZygoteInit.java:779)
Instead if I use the "standard" debugger (http://localhost:8081/debugger-ui) in Google Canary (v64.0.3247.0, macOS X) this doesn't happen.
The other "main difference" is that I set, in the GCanary debugger Maintain Priority to true.
Hope it may help in any way.
 kelset
on 23 Oct 2017
kelset
on 23 Oct 2017
Not sure if this is the right issue to post this on!
After reloading a number of times, memory usage goes up substantially. It drops down if I restart react-native-debugger.
 Jarred-Sumner
on 19 Mar 2018
Jarred-Sumner
on 19 Mar 2018
We have a similar issue. But more specifically, using react-native-debugger 0.8.1 with react-native 0.57.7 we see a memory leak in XCode (9.4.1)'s profiler with iOS 12 and it never garbage collects. Android does not report the memory issue with its profiler but like @Jarred-Sumner above it still shows a steady increase in macOS system ram usage. The specifc issue of XCode simulator ram ballooning does not seem to exist in react-native debugger 0.8.1 when combined with react-native 0.55.4. It's demonstrably not our app and doesn't occur when we don't use JS debugging or instead use Chrome 71 dev tools. Also like @Jarred-Sumner the system memory usage drops right back when react-native-debugger is restarted.
tl;dr: there seems to be an interplay with memory issues reported in the iOS simulator and the specific combination of version of react-native-debugger and the version of react-native
 JofBigHealth
on 14 Dec 2018
JofBigHealth
on 14 Dec 2018
Yeah the app performance is horrible and crazy bad
 radjivF
on 8 Jan 2019
radjivF
on 8 Jan 2019
Related issues
 inferusvv
·
26Comments
inferusvv
·
26Comments
 AndrewMorsillo
·
15Comments
AndrewMorsillo
·
15Comments
 jgcmarins
·
23Comments
jgcmarins
·
23Comments
 jan-happy
·
29Comments
jan-happy
·
29Comments
 maxhungry
·
50Comments
maxhungry
·
50Comments
Most helpful comment
Yeah the app performance is horrible and crazy bad