React-native-ble-plx: Memory Leak on iOS
Prerequisites
I am running version 1.0.3 with React Native 58.6 (also tried 58.3).
Expected Behavior
I want to read several BLE characteristics each second.
Current Behavior
When I read a characteristic each second, the memory usage of the app steadily increases in iOS. This is not happening in Android.
Steps to Reproduce
Please provide detailed steps for reproducing the issue.
- Create new react native app
- Connect to BLE device
- Read characteristic each second and console.log the value.
- Use profiler in xCode, memory climbs over time. Over the course of about 16 hours, my app went from ~50M to about ~500M.
 andycamp
All 28 comments
I tested react-native-ble-plx v1.0.2 and react-native v58.3, it has the same issue. react-native-ble-plx v1.0.1 and react-native v57.5 does not seem to have the problem.
andycamp
on 21 May 2019
Hey,
I tested this issue with XCode 10.2.1, RN 0.58.5, and rn-ble-plx 1.0.3 and I couldn't reproduce your problems.
Please send me a results of your profiling via "Allocations" instruments.
- Select in XCode menu: Product / Profile
- Open "Allocations" instrument.
- Click recording button.
- Navigate inside your app to the point where you can start increasing memory.
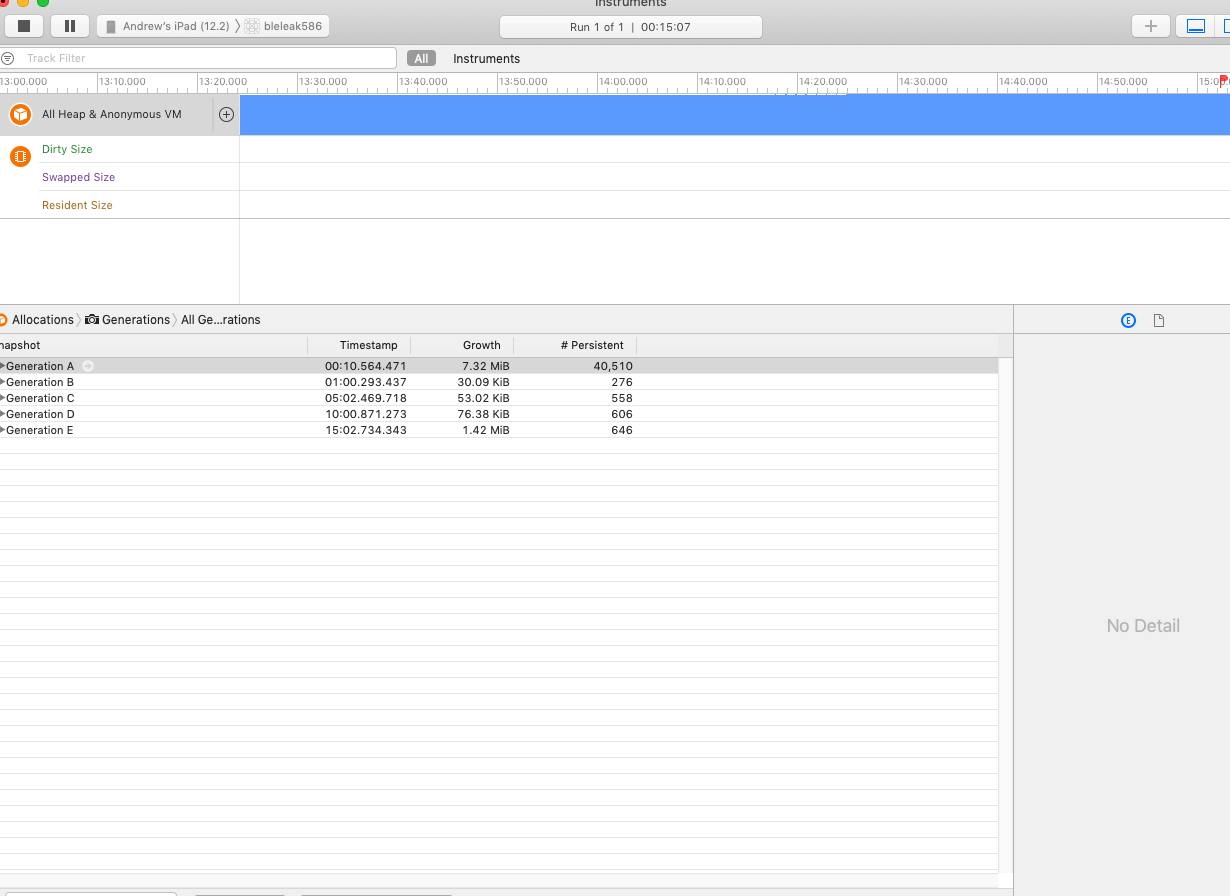
- Click on "Statistics" and change it to "Generations"
- Click "Mark Generations" before tests.
- Execute a test increasing a memory footprint.
- Click "Mark Generations" once again and send me an output of the newest generation.
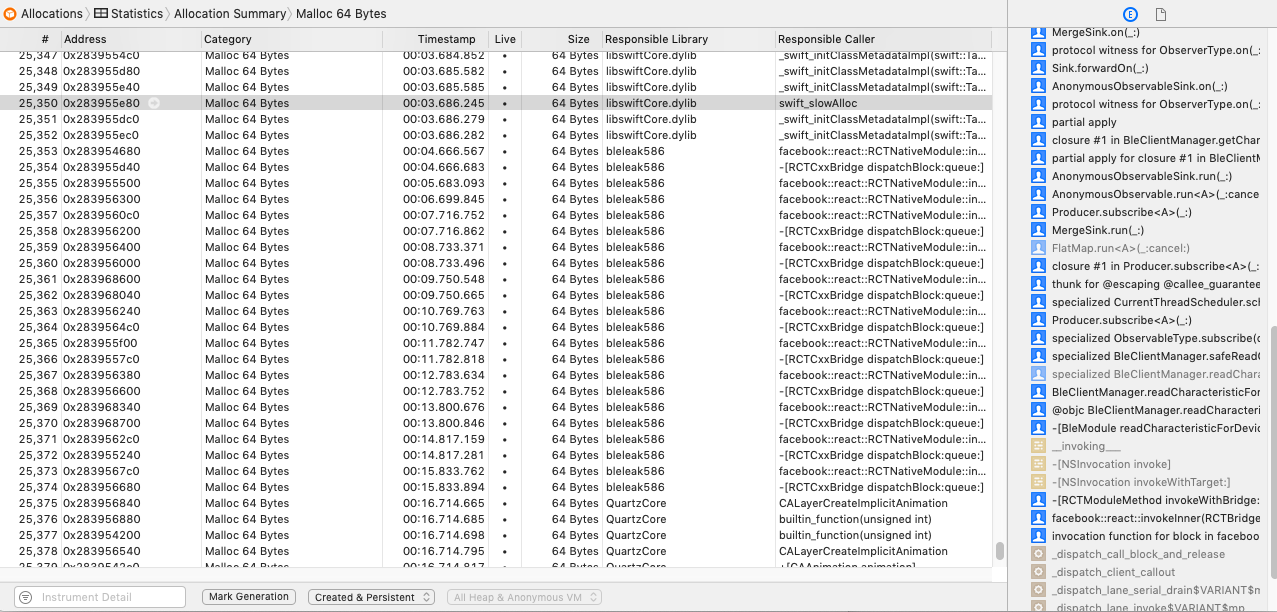
- Additionally go back to "Statistics" and type "BleClient" inside "Instrument Detail" text field in the bottom.
- Send me a list. Number of persistent allocations should not increase.
 Cierpliwy
on 24 May 2019
Cierpliwy
on 24 May 2019
Pretty sure it may be related to:
https://github.com/Polidea/RxBluetoothKit/issues/302
 nethergrim
on 24 May 2019
nethergrim
on 24 May 2019
Hi,
We're in the process of upgrading our app that's been in production for about a year and a half. The app is written with react-native 47 and react-native-ble-plx 0.8.0 and we build it using Xcode 9.0. We've been working on upgrading the app to react-native 58.6 and react-native-ble-plx 1.0.3. During testing, we found that the upgraded app crashed on long running tests, when we looked into the reason for the crashes, it was insufficient memory.
When we profile our app, it appears that memory is constantly increasing regardless of user interaction. We are reading about eight characterics in an interval of 1 second. When our app is not connected to ble there is no issue with memory. All of these statistics were gathered from the app running with no user interaction, no network interaction, nothing other than BLE reads.
react-native 47, react-native-ble-plx 0.8.0, Xcode 9.0
- 0 min: 69.5 MB
- 10 min: 72.5 MB
- 15 min: 75.1 MB
- 20 min: 77.3 MB
- 25 min: 79.6 MB
react-native 58.6, react-native-ble-plx 1.0.3, Xcode 10.2
- 0 min: 80.2 MB
- 10 min: 129 MB
- 15 min: 154 MB
- 20 min: 180 MB
- 25 min: 208 MB
We wanted to rule out any other code in our app, and any other packages. So, we made a new, empty app with only react-native-ble-plx installed. We made one for both versions of react-native and react-native-ble-plx we have been testing. In these apps we are creating an interval and reading a single characteristic each second in the App.js component.
Sample code (App.js)
constructor() {
    super()
    console.log('app constructor xxx')
    console.log('App didMount')
    this.manager = new BleManager()
    const subscription = this.manager.onStateChange((state) => {
      if (state === 'PoweredOn') {
        this.scanAndConnect()
        subscription.remove()
      }
    }, true)

  }

  async scanAndConnect(byService = null) {
    if (__DEV__) console.log('start scan')
    this.manager.startDeviceScan(null, null, async (error, device) => {
      console.log('Scanning...')
      console.log(device.name)
      if (device && device.name && (device.name.includes('name-of-device'))) {
        if (__DEV__) console.log('BLE found. connecting.')
        this.manager.stopDeviceScan()
        if (__DEV__) console.log('stop scan, clear timers ')
        device.connect()
          .then(async (device) => {
            if (__DEV__) console.log('Device = ' + device.id)
            if (__DEV__) console.log('Discovering services and bleChars')
            return (await device.discoverAllServicesAndCharacteristics())
          })
          .then((device) => {
            console.log('Setting notifications')
            setInterval(() => {
              console.log('interval ')
              device.readCharacteristicForService(serviceUUID, heartbeatUUID)
                .then((res) => {
                  console.log(`heartbeat ${ res.value}`)
                })
            }, 1000)
          })
      }
    })

  }
react-native 47.2, react-native-ble-plx 0.8.0, Xcode 9.0
"dependencies": {
     "react": "16.0.0-alpha.12",
     "react-native": "0.47.2",
     "react-native-ble-plx": "github:Polidea/react-native-ble-plx#ac062c2ec7ad2da31d224a6c953178aa845f9537"
   }
- 0 min: 35.5 MB
- 10 min: 37.2 MB
- 15 min: 38.9 MB
- 20 min: 40.1 MB
- 25 min: 41.3 MB
react-native 58.6, react-native-ble-plx 1.0.3, Xcode 10.2
  "dependencies": {
    "react": "16.6.3",
    "react-native": "0.58.6",
    "react-native-ble-plx": "^1.0.3"
  }
- 0 min: 40 MB
- 10 min: 52.5 MB
- 15 min: 56.7 MB
- 20 min: 61.2 MB
- 25 min: 65.5 MB
I've run all of these tests on an iPad 4 mini, but we've reproduced the same issues on an iPhone 6s.
andycamp
on 29 May 2019
Hello @andycamp
I see that your last post seems to have a mistake in titles before tests. E.g.
react-native 58.6, react-native-ble-plx 0.8.0, Xcode 10.2
  "dependencies": {
    "react": "16.6.3",
    "react-native": "0.58.6",
    "react-native-ble-plx": "^1.0.3"
  }
You could fix them so we would be the accurate picture.
The best / most efficient way to track the leak would be if you could follow the steps suggested in the previous post
Best regards
 dariuszseweryn
on 31 May 2019
dariuszseweryn
on 31 May 2019
Thanks. I fixed the mistake.
andycamp
on 31 May 2019
Are other titles ok?
Could you perform and report the suggested tests?
dariuszseweryn
on 31 May 2019
I did just find another mistake. I did perform the other tests, but I don't know of an easy way to share the results in this context, and it's unclear from the instructions exactly what I'm supposed to share. In a brand new app, with nothing running other than reading a characteristic each second, memory always increases. Stop reading the characteristic, and memory stays constant.
andycamp
on 31 May 2019
There should be an option to export the results. Even a screenshot of the list should be enough for a start
dariuszseweryn
on 31 May 2019
We're definitely still struggling with this. It doesn't make sense that RAM usage keeps going up. This running a react-native 58.6 app with react-native-ble-plx 1.0.3 using only the sample code that was posted last week.
andycamp
on 6 Jun 2019
I can't see any problems in your attached screen. I think that you should create minimal repository which reproduces issues on your side (could be a fork of SensorTag), so that we can test it.
Cierpliwy
on 7 Jun 2019
Here's a repo that will reproduce the issues that we are seeing.
https://github.com/TruckingOffice/bleleak_pub
There are some values in BleReader that will need to be populated on your end.
Calling this a memory leak may be the wrong terminology, but we can't find a way to call multiple characteristics per second without having memory usage of our app increase to the point of failure. If this app is left to run on a device, it will eventually run out of memory and the app will crash. Making the interval longer (2000ms) slows the growth in memory. Making the interval shorter (200ms) increases the growth in memory.
We haven't seen this happen on android.
Any help or guidance would be greatly appreciated.
andycamp
on 12 Jun 2019
Unfortunately I got 404 when I try to open your link... It's seems this account doesn't have any public repositories except react-native-version-number.
Cierpliwy
on 14 Jun 2019
I just made it public.
andycamp
on 14 Jun 2019
Hey,
I tested your repo with SensorTag and following configuration:
const deviceName = 'SensorTag'
const serviceUUID = 'f000aa10-0451-4000-b000-000000000000'
const characteristic1UUID = 'f000aa11-0451-4000-b000-000000000000'
const characteristic2UUID = 'f000aa12-0451-4000-b000-000000000000'
const characteristic3UUID = 'f000aa13-0451-4000-b000-000000000000'
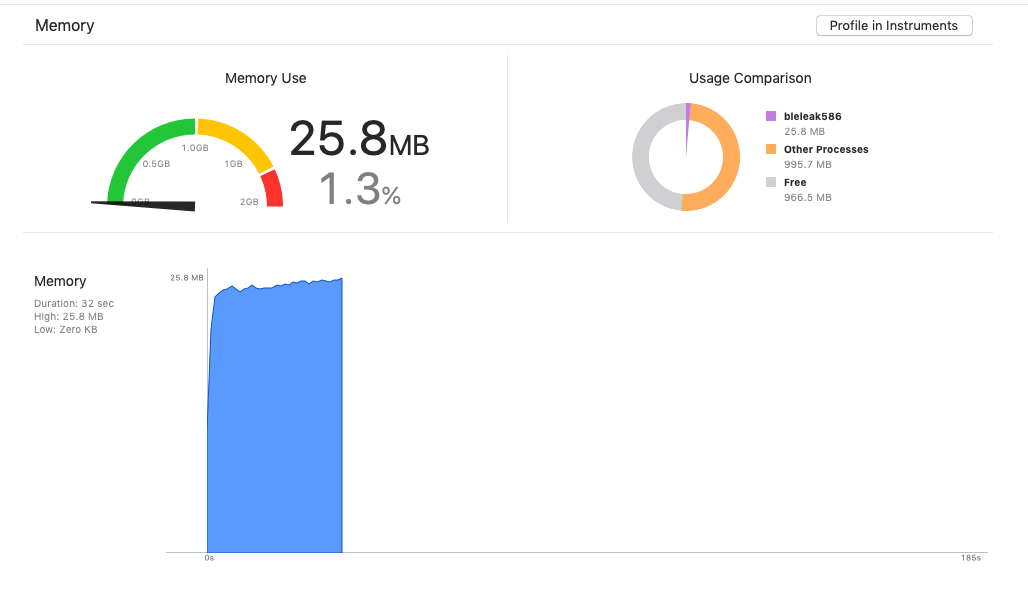
with Xcode 10.2.1 and iPhone 8 (12.3.1). I didn't spot any obvious memory leaks during 1,5h of testing:
Memory stopped at ~9,5 MB.
Cierpliwy
on 17 Jun 2019
Hi,
Thanks for the response. We ordered a SensorTag and should have it tomorrow. So, we can try to reproduce your results.
Xcode 10.2.1, iPad mini 4 (12.2)
Profiling in Instruments
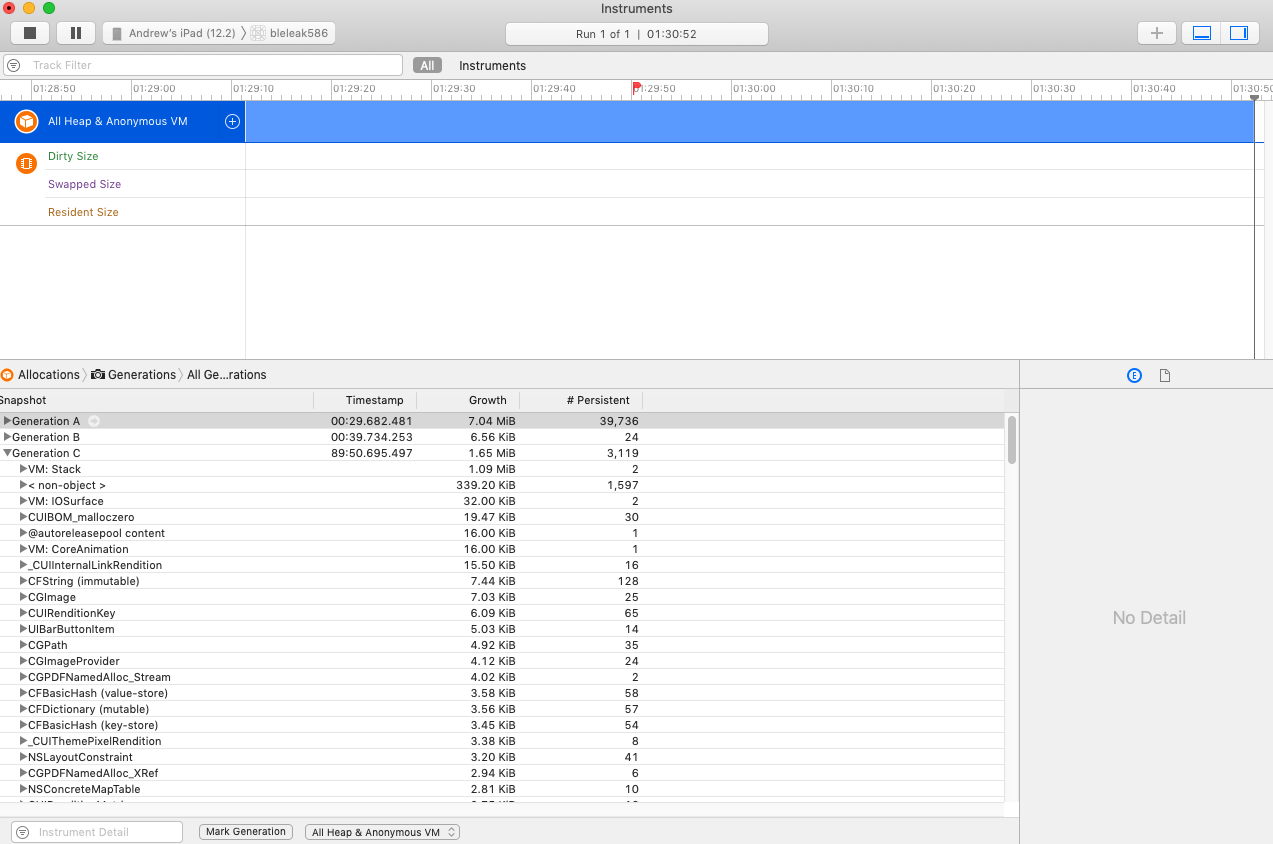
Monitoring in XCode (Release build)
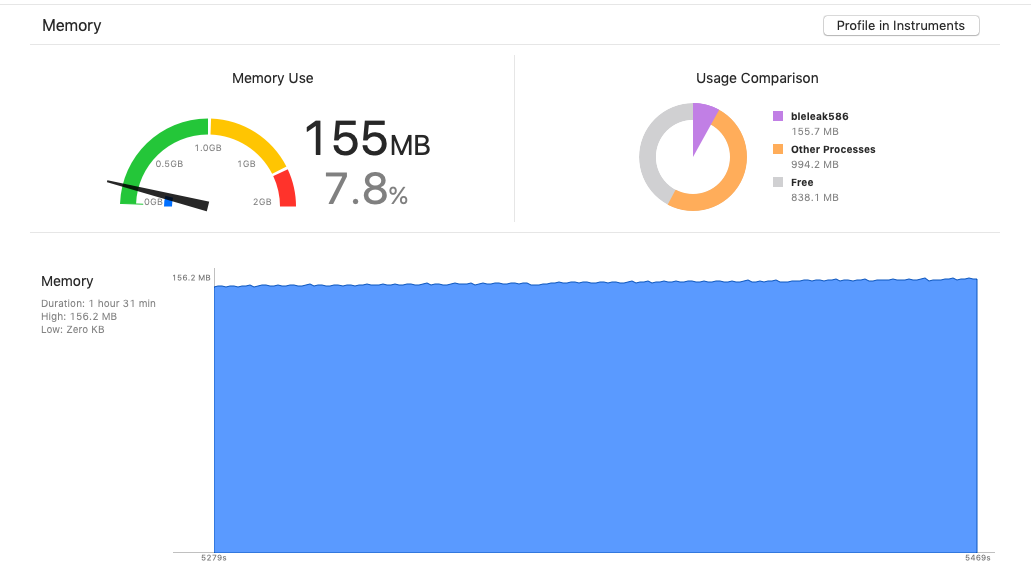
Our testing looks like this for multiple users and many different devices. No matter how we run this, we see persistent memory growth. We are wondering if it may have to do with the data type of the BLE characteristic. The characteristics we are reading are strings.
andycamp
on 17 Jun 2019
@andycamp
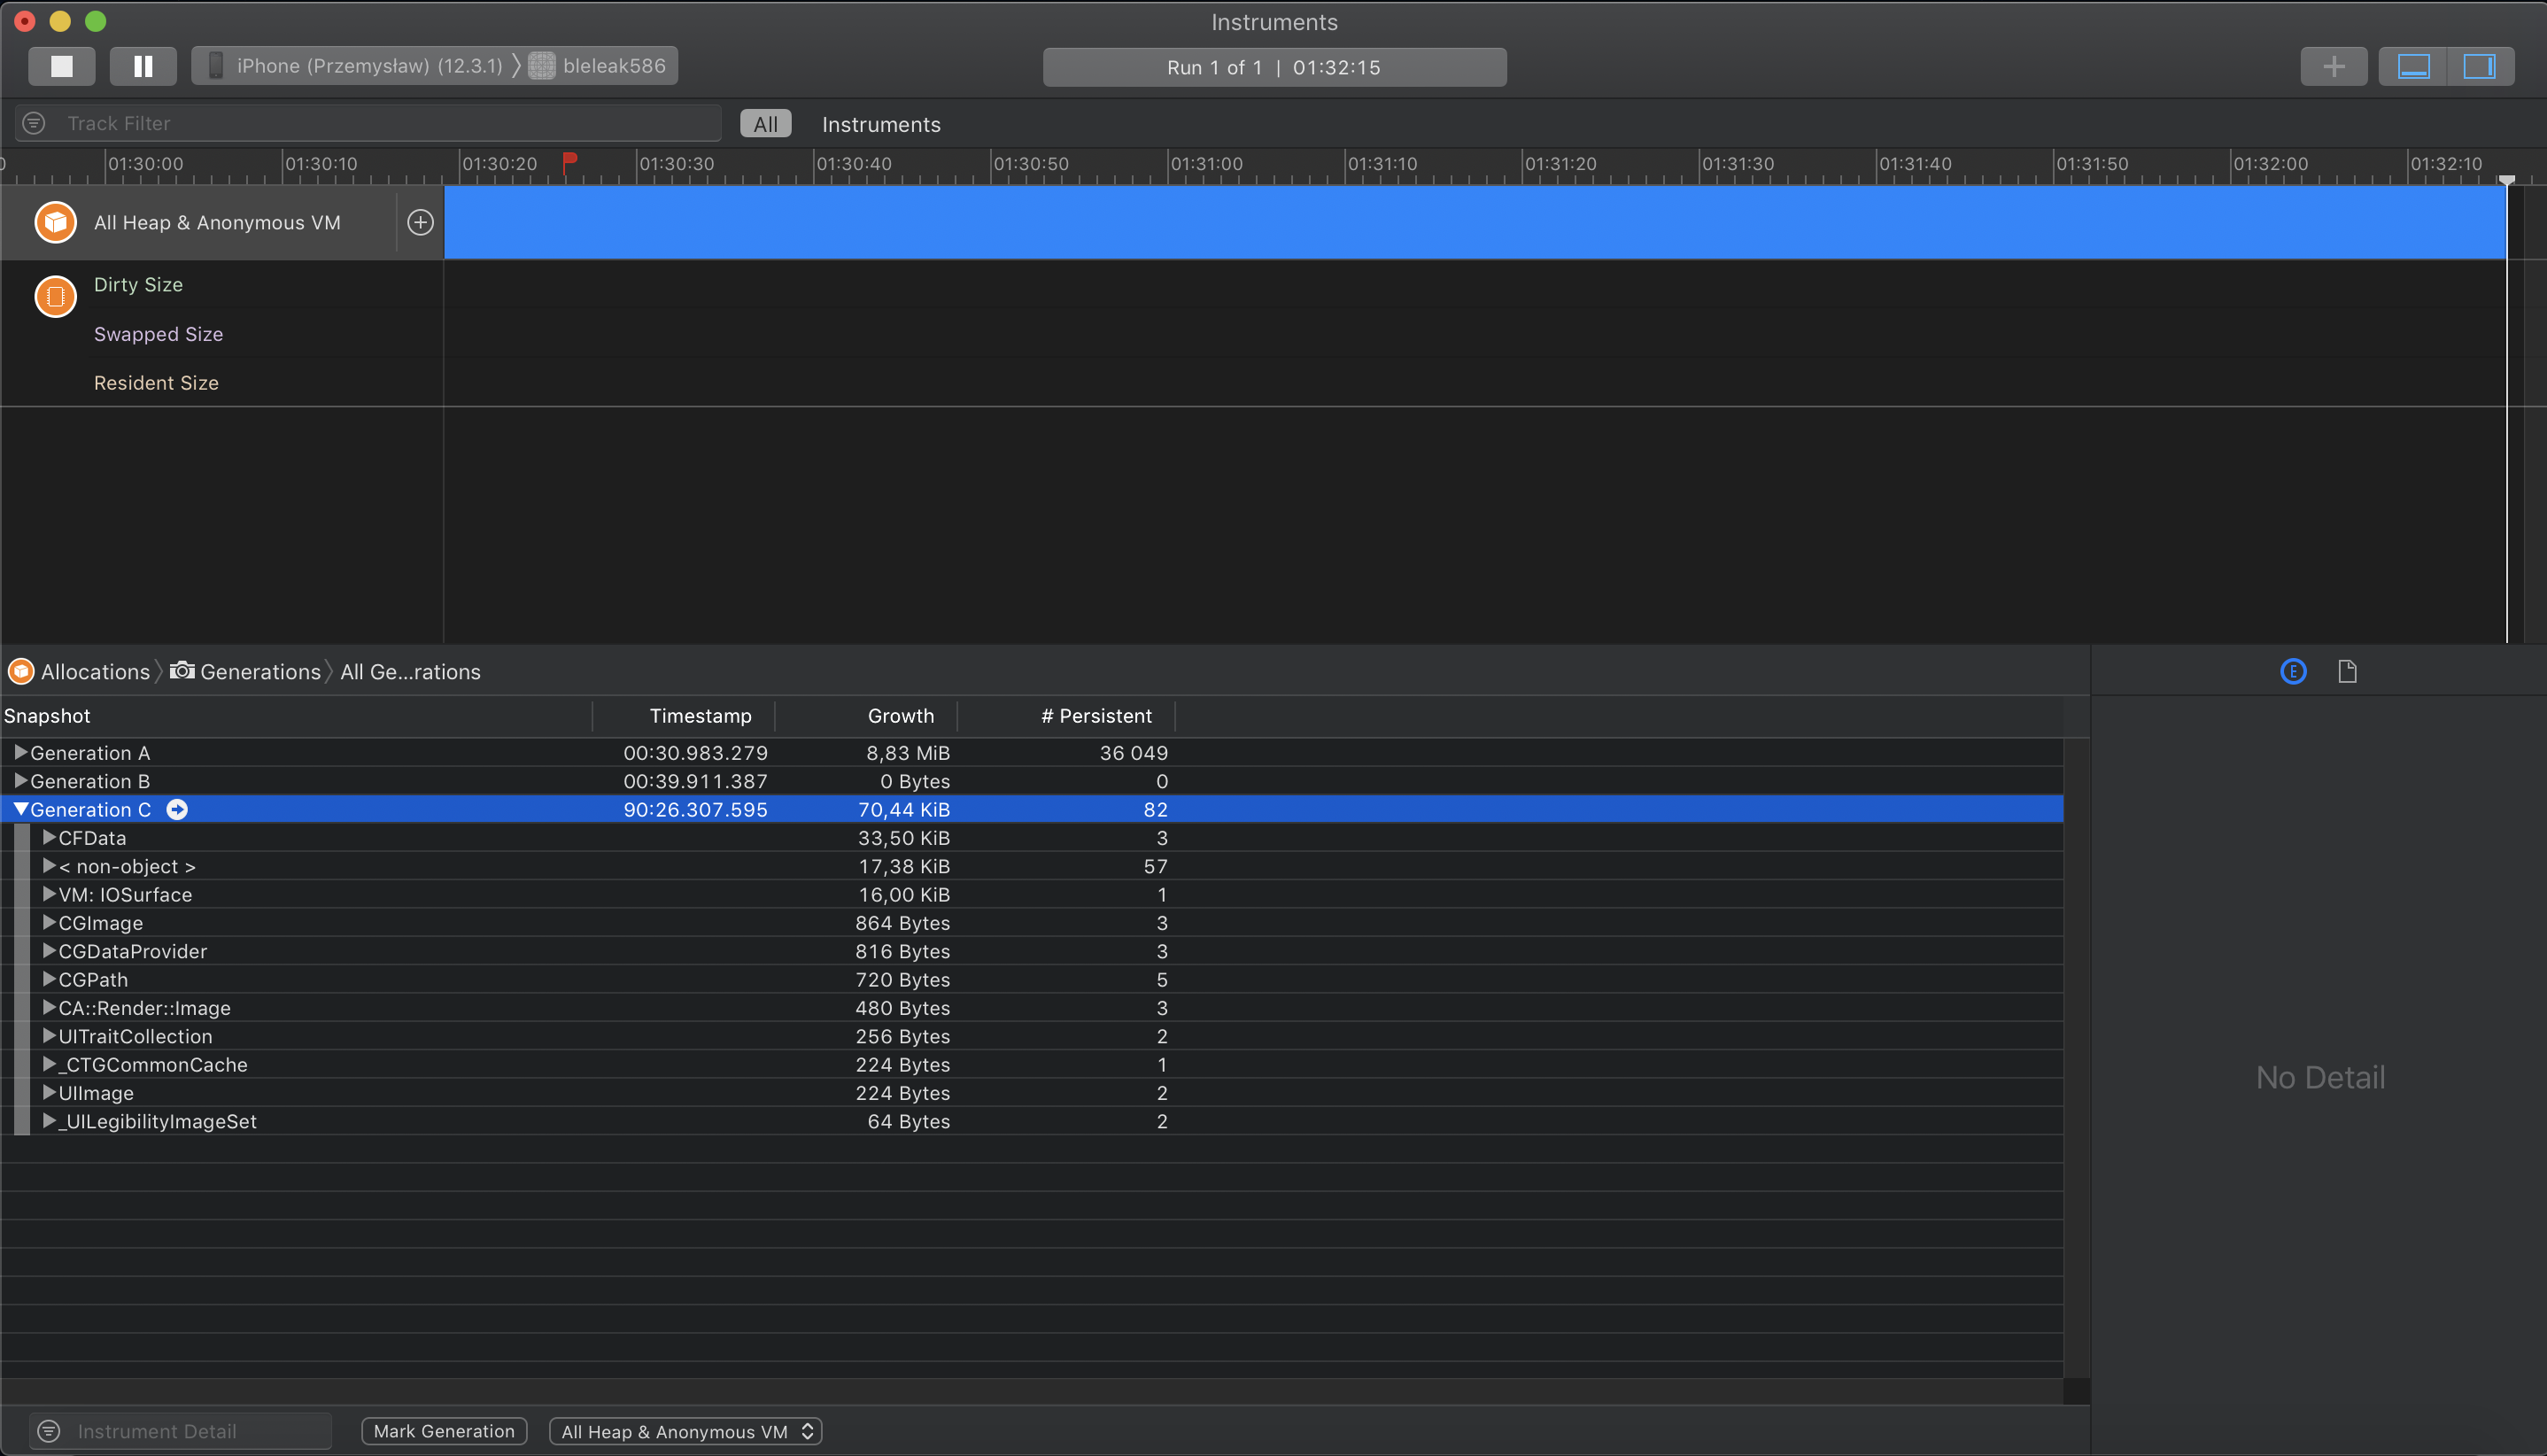
On Friday I had time to look into this memory leak issue. I started by using your example application (bleleak586) and I modified it a little bit for my needs:
- I replaced 3 read operations with one operation which was called every 100ms.
- I added single write operation after connection step to be able to observe different values. (Sensor Tag specific thing).
With these changes, I tested a few scenarios during a 5 min period of time:
- normal run: memory increased from ~44,5 MB to ~56,2-59,8 MB.
- I commented out actual read operation inside
BleModule.swift:660and replaced it withObservable.just(characteristic): ~44,5MB to ~57,3-58,2 MB. - I commented out whole BLE implementation in bridge function
BleClient.m:243with simpleresolve(@{@"value": @"test2"})function call: ~44,5MB to ~53,5 MB.
It was weird for me that these changes didn't have any major impact on memory leakage. Just to be sure I created the same example application, but without intermediate RN bridge. I used the same API which is present in BleClient.m file. After a few attempts I didn't spot any obvious memory leaks - memory usage stayed constant at ~44,5MB.
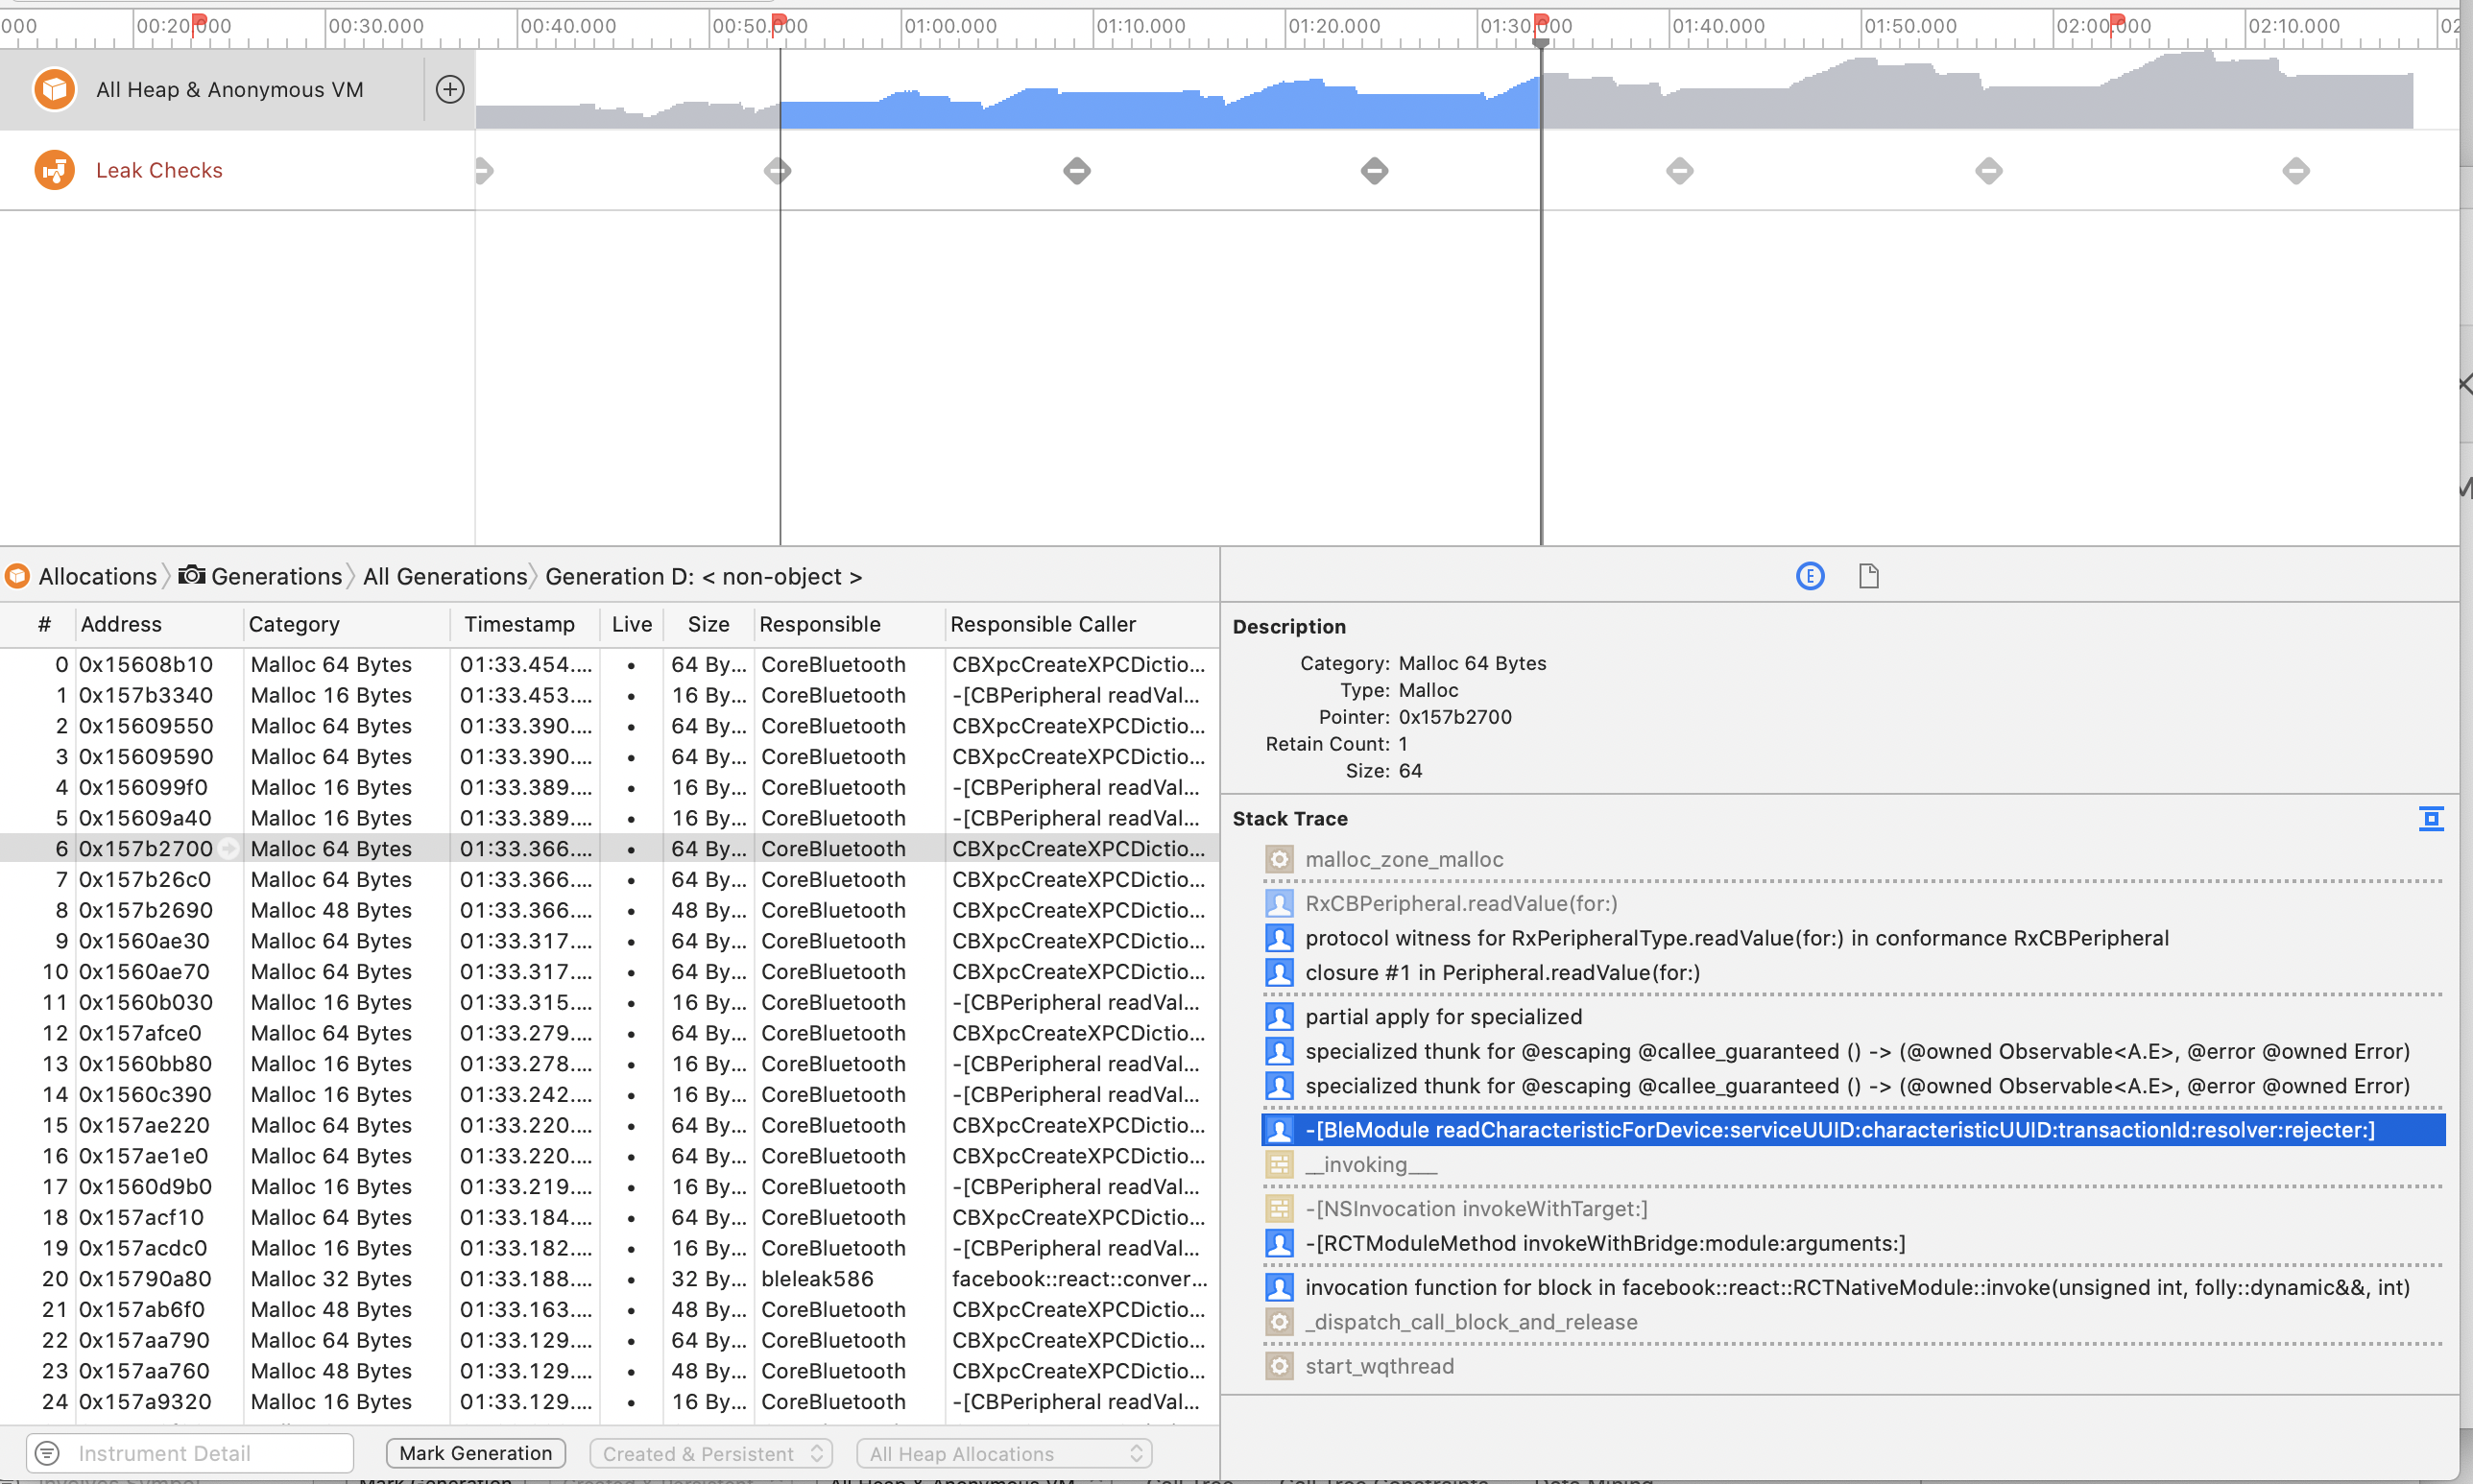
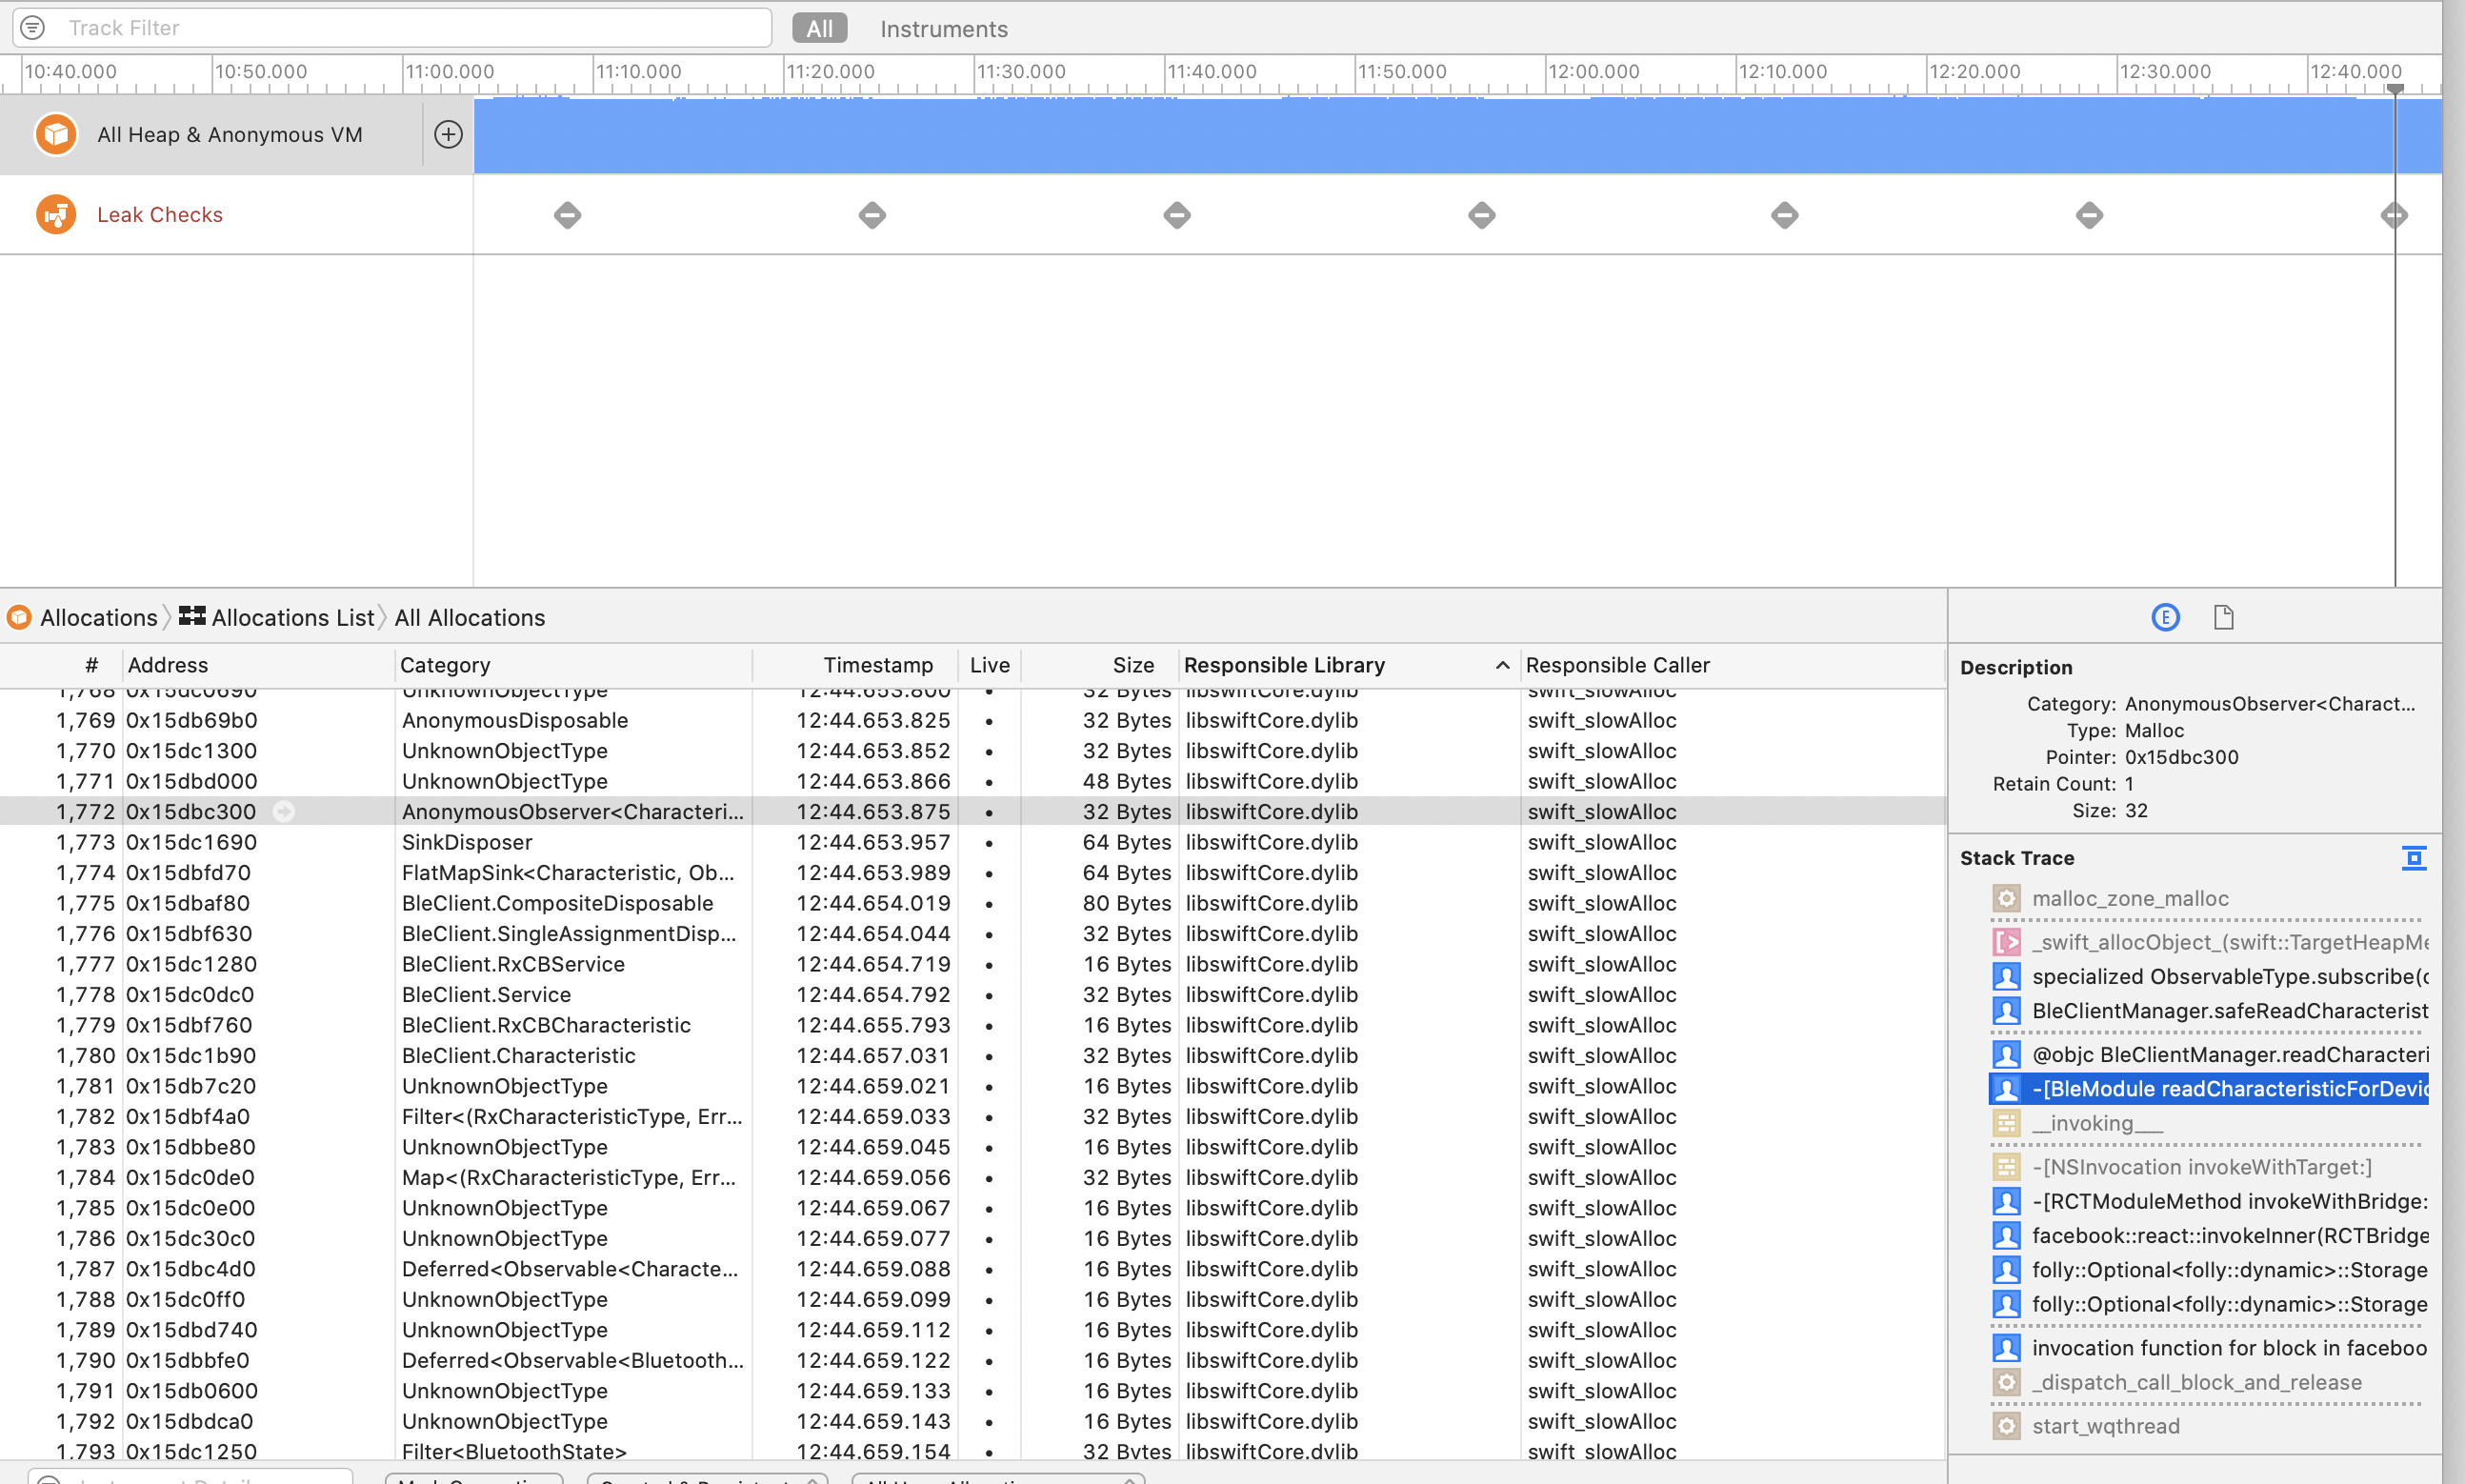
Afterward, I reimplemented readCharacteristicForDevice as follows:
RCT_EXPORT_METHOD(readCharacteristicForDevice:(NSString*)deviceIdentifier
                                  serviceUUID:(NSString*)serviceUUID
                           characteristicUUID:(NSString*)characteristicUUID
                                transactionId:(NSString*)transactionId
                                     resolver:(RCTPromiseResolveBlock)resolve
                                     rejecter:(RCTPromiseRejectBlock)reject) {
    NSMutableString *string = [NSMutableString new];
    for (int i = 0; i < 10000; i++) {
        [string appendString:@"very long string..."];
    }
    NSDictionary* value = @{@"value": @"test2", @"something": string};
    resolve(value);
}
... and memory was skyrocketing.
I concluded that whole bridge implementation retains resolved value even though it doesn't have to - it's converted to C++ object. I will try to check it further on Wednesday.
Cierpliwy
on 7 Jul 2019
Hi? Does anyone have any updates on this issue? It is a serious dealbreaker for many apps, and it is driving us away from potentially using this library
 Jorl17
on 9 Aug 2019
Jorl17
on 9 Aug 2019
Hi,
There haven't been any updates to this issue in a while. We tried the ble leak repo with react native 60.5 and ble-plx 1.1.0. It still has the same problem.
andycamp
on 25 Sep 2019
+1
 julioxavierr
on 3 Oct 2019
julioxavierr
on 3 Oct 2019
we are (@julioxavierr and I) having a similar issue on iOS... in our particular case, we have to send writeCharacteristicWithoutResponseForDevice every ~1s. every time this method is called, the memory usage increases and keeps increasing to the point that, after 5 min, the app is using ~300MB.
react 16.8.3
react-native 0.59.10
react-native-ble-plx 1.1.0
 juliobetta
on 3 Oct 2019
juliobetta
on 3 Oct 2019
+
nethergrim
on 7 Oct 2019
If someone is struggling with this, updating react-native to 0.61.2 fixed the problem for us, ran a session that kept communicating with BLE devices during 7 hours. Worth a try.
It was happening with both platforms since we updated to 0.59+.
julioxavierr
on 9 Oct 2019
This is great news! We cannot yet confirm that this resolves the issue and will be waiting for further feedback. Thank you @julioxavierr
Jorl17
on 9 Oct 2019
This also appears to be fixed for me too. I think there's a typo in the react native version. I tested using react-native 0.61.2. Memory stays constant when reading lots of characteristics.
andycamp
on 9 Oct 2019
Can we close this one @Cierpliwy ?
julioxavierr
on 25 Feb 2020
We have had no problems in production with react native 61.2 and ble-plx 1.1.0.
andycamp
on 25 Feb 2020
I guess we can.
Cierpliwy
on 26 Feb 2020
Related issues
 biks152207
·
3Comments
biks152207
·
3Comments
 juanjo-ramos
·
3Comments
juanjo-ramos
·
3Comments
 kevinmeyvaert
·
4Comments
kevinmeyvaert
·
4Comments
 brycejacobs
·
5Comments
brycejacobs
·
5Comments
 cltsang
·
4Comments
cltsang
·
4Comments
Most helpful comment
If someone is struggling with this, updating react-native to 0.61.2 fixed the problem for us, ran a session that kept communicating with BLE devices during 7 hours. Worth a try.
It was happening with both platforms since we updated to 0.59+.