React-chartjs-2: Control Pie Chart & Legend Area separately
Hi,
I am trying to make my Pie chart mobile-friendly, but using the dimension properties for the

 jbbae
jbbae
All 5 comments
Hey @nickbae91 ,
I think your solution will be a combination of things. You'll need to fiddle with it to get it exactly right for you.
Pass it an options object that turns off responsive behavior and updates the legend
http://www.chartjs.org/docs/latest/general/responsive.html
http://www.chartjs.org/docs/latest/configuration/legend.html
const options = {
  maintainAspectRatio: false,
  responsive: false,
  legend: {
    position: 'left',
    labels: {
      boxWidth: 10
    }
  }
}
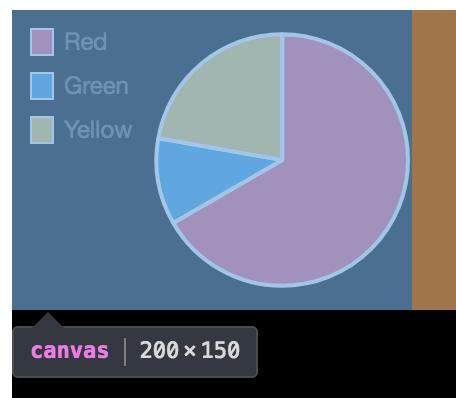
I put the legend to the side and shrank the width of the boxes. The Pie chart seems to take it's size from the width value, so I filled in the vacant space above the chart by reducing the height.
<Pie data={data} height={150} width={200} options={options}/>
Full Code
import {Pie} from 'react-chartjs-2';

const data = {
  labels: [
    'Red',
    'Green',
    'Yellow'
  ],
  datasets: [{
    data: [300, 50, 100],
    backgroundColor: [
    '#FF6384',
    '#36A2EB',
    '#FFCE56'
    ],
    hoverBackgroundColor: [
    '#FF6384',
    '#36A2EB',
    '#FFCE56'
    ]
  }]
};

const options = {
  maintainAspectRatio: false,
  responsive: false,
  legend: {
    position: 'left',
    labels: {
      boxWidth: 10
    }
  }
}

class App extends React.Component {


  render() {
    return(
      <div style={{height: '500px', width: '500px', backgroundColor: 'black', position: 'relative'}}>
        <Pie data={data} height={150} width={200} options={options}/>
      </div>
    );
  }
}
 dbrodie122
on 31 Oct 2017
dbrodie122
on 31 Oct 2017
@dbrodie122 Thanks so much for the help!!! I really appreciate it.
 jerairrest
on 31 Oct 2017
jerairrest
on 31 Oct 2017
@jerairrest thank YOU for making this library. It saved my job, no joke!
dbrodie122
on 31 Oct 2017
@jerairrest I am trying to do the same using react-chartjs-2. However, for plotting Pie chart, i am getting undefined at the center of Pie chart. Can anyone help me how can we remove that?
 narenvaishnavi
on 5 Dec 2019
narenvaishnavi
on 5 Dec 2019
@narenvaishnavi please open a new issue with code examples and a sanbox reproducing the bug you are describing. Closing this issue for now.
 Pringels
on 11 Dec 2019
Pringels
on 11 Dec 2019
Related issues
 n1c01a5
·
4Comments
n1c01a5
·
4Comments
 thanh121094
·
3Comments
thanh121094
·
3Comments
 Holychung
·
4Comments
Holychung
·
4Comments
 LuizMoreira
·
3Comments
LuizMoreira
·
3Comments
 davidcalhoun
·
5Comments
davidcalhoun
·
5Comments
Most helpful comment
@jerairrest thank YOU for making this library. It saved my job, no joke!